
 ?Mathematical formulae have been encoded as MathML and are displayed in this HTML version using MathJax in order to improve their display. Uncheck the box to turn MathJax off. This feature requires Javascript. Click on a formula to zoom.
ABSTRACT
To study the role of inflammation in the pathophysiology of the fatty liver haemorrhagic syndrome (FLHS), mature laying hens were treated with oestrogen (β-oestradiol-17-dipropionate or E2) and challenged with lipopolysaccharide (LPS). Oestrogen injections induced FLHS, but the incidence and severity of the condition was increased with a combination of E2 & LPS. Hepatic mRNA levels of the genes encoding key regulators of inflammation, such as interleukin-1β (IL-1β), interleukin-6 (IL-6) and interleukin-18 (IL-18), were evaluated. The expression of IL-6 mRNA in hepatocytes of all treated groups (E2, LPS and E2 & LPS hens) was elevated from 6-fold to 56-fold (P < 0.01), when compared to baseline and control values, with the highest fold change at 3 h post-treatment. The mRNA levels for IL-1β were better expressed at 24 h post-treatments with E2, LPS and E2 & LPS. The expression of IL-18 mRNA in the liver tissue was lower than IL-1β and IL-6 mRNA in all treated birds. At 24 h post-treatment, total white blood cell (WBC) counts and fibrinogen levels were elevated (P < 0.05) in E2-, LPS- and E2- & LPS-treated hens. Histologically, livers of hens from E2- and E2- & LPS-treated groups revealed inflammatory alterations with areas showing mononuclear aggregations, vacuolar fatty degeneration of hepatocytes, and increased sinusoidal congestion and haemorrhages. It was concluded that liver lipid accumulation and injury were associated with incidences of local (hepatic) and systemic inflammation, which could have initiated liver blood vessel and capsule rupture and, subsequently, the onset of FLHS.
Introduction
In laying hens, fatty liver haemorrhagic syndrome (FLHS) is a metabolic disorder associated with numerous factors such as diet, increased feed intake, lack of exercise, and environment (Wolford & Murphy, Citation1972; Lee et al., Citation1975; Pearson et al., Citation1978; Simonsen, Citation1978; Naber & Biggert, Citation1989; Branton et al., Citation1995; Cherian & Goeger, Citation2004; Cain et al., Citation2014; Richards & Proszkowiec-Weglarz, Citation2007; Rozenboim et al., Citation2016). Fatty liver (without haemorrhage) or so-called hepatic steatosis has been reported in a number of avian species including domestic fowl, geese, turkey, duck (Butler, Citation1976), and some psittacine birds (Hochleithner et al., Citation2006), as a feature of several infectious and non-infectious diseases. In Anseriformes, natural susceptibility to fatty liver e.g. in ducks and geese (deliberately induced through force feeding to produce “foie gras”), and in migrating wild waterfowl (physiologically induced to store energy before long distance migration) are partly under genetic control (Pilo & George, Citation1983; Mourot et al., Citation2000; Guémené et al., Citation2001; Davail et al., Citation2003). If individual ducks are given too much food or are fed for too long, their metabolic capacity will be overloaded resulting in fibrosis, haemorrhages, and jaundice (EU Report Citation1998). In Galliformes, highly productive commercial chickens and turkeys, the liver is often adversely affected by hepatic steatosis (or hepatic lipidosis in turkey hens) with an aetiology involving dietary and hormonal factors that stimulate lipogenesis (Hünigen et al., Citation2016). Hepatic steatosis in laying hens may result in the FLHS, but these two conditions are different (Diaz et al., Citation1994). The pathogenesis of FLHS is poorly understood but has similarities to non-alcoholic fatty liver disease in humans.
Evidence has accrued in recent years, showing that the dysfunction of metabolic and immune pathways underlies many chronic metabolic diseases, including non-alcoholic fatty liver diseases (NAFLD) that occur in man as a consequence of acquired or inherited overeating in conjunction with reduced physical activity (Hotamisligil, Citation2006; Hotamisligil & Erbay, Citation2008; Osborn & Olefsky, Citation2012). It is also well established that obesity in humans is associated with a state of chronic low-grade inflammation (metabolic inflammation), a major player in the link between metabolic syndrome and fatty liver disease (Wisse, Citation2004; Kohjima et al., Citation2007; Cusi, Citation2012; Kirpich et al., Citation2015).
The inflammatory response is a defence mechanism, and inflammation itself is a very complex process that involves immune cells and many other cell types and molecules; many of them are multifunctional and contribute to different stages of inflammation, the initiation, progression, or resolution phase (Serhan, Citation2011; Newton & Dixit, Citation2012). Almost all immune cells have been found in adipose tissue, and seem to play a critical role in orchestrating the inflammatory response in conditions such as obesity and type 2 diabetes in mammalian models and humans (Ouchi et al., Citation2011). Adipose tissue is also considered to be an endocrine gland that produces hormones and bioactive substances, such as endocrine factors, cytokines, and chemokines that regulate many physiologic processes and immune functions (Coelho et al., Citation2013). One group of endocrine factors produced by adipose tissue in response to changes in triacylglycerol storage and inflammation are the adipokines (Mancuso, Citation2016). Both adipocytes and inflammatory cells (that migrate to adipose tissue) secrete numerous pro- and anti-inflammatory cytokines and promote a low-grade chronic inflammation (Mraz & Haluzik, Citation2014; Asghar & Sheikh, Citation2017). Similar to adipocytes, lipid droplets in hepatocytes (also known as lipid bodies or adiposomes) are inducible organelles with roles in regulation of lipid metabolism and control of the synthesis and secretion of inflammatory mediators (Anderson & Borlak, Citation2008; Bozza & Viola, Citation2010; Arisqueta et al., Citation2013; Welte, Citation2015).
In a preceding study, we induced FLHS in a hen model following oestrogen (E2) injection and demonstrated that lipid droplets were present inside hepatocytes and also in perisinusoidal cells in the subendothelial space between hepatocytes and sinusoidal endothelial cells (Shini et al., Citation2019b). Presumably, in the case of fatty livers in laying hens, hepatocyte lipid droplets could be the cause of hepatocellular injury and inflammation, resulting in liver tissue swelling and capsule rupture. In the previous study, leukocytes and fibrinogen levels were elevated along with significant inflammatory alterations of liver tissue. It was suggested that, due to elevated oestrogen levels, liver fat content was increased, causing a low-grade inflammation of the liver tissue, and the onset of FLHS (Shini et al., Citation2019b).
The aim of the current study was to examine the relationship between liver inflammation and the incidence of FLHS. To investigate the role of inflammation in the pathophysiology of FLHS, hens were concurrently exposed to E2 and lipopolysaccharide (LPS). Lipopolysaccharide from Escherichia coli was used as a potential environmental (bacterial) inducer of inflammation on the background of increased fatty liver infiltration caused by injections of E2 (Kaisho & Akira, Citation2002; Rorato et al., Citation2017). Studies with human and mouse models have also indicated that circulating endotoxin levels were found elevated in patients with NAFLD (Harte et al., Citation2010).
Materials and methods
Experiments conducted in this study were approved by the University of Queensland Animal Ethics Committee and complied with the Australian Code of Practice for the Care and Use of Animals for Scientific Purposes. Experiments were carried out at the Poultry Science Unit of the University of Queensland, Gatton Campus.
Laying hens and experimental design
Ninety six, 30-week old, Hisex brown laying hens were housed in individual cages in a temperature-controlled shed and exposed to standard lighting programme (16L:8D). Birds were fed a commercial layer (wheat-sorghum-soybean) diet with the specifications as described in the first paper (Shini et al., Citation2019b). Water and feed were provided ad libitum. For details of experimental treatments and sampling protocol (see the Supplementary Material, Table 1). The hens were randomly assigned to six treatments with 18 replicate hens for each treatment. Birds treated with oestradiol were injected with exogenous E2, 5 mg/kg body weight intramuscular (i.m.) every 4 days (days 1, 5, 9 and 13) as described previously (Shini et al., Citation2019b). For the LPS treatments, on day 1, hens were injected intravenously (i.v.) with a single dose of 8 mg/kg body weight of ultra-pure E. coli 0111:B4 strain LPS (InvivoGen, San Diego, CA, USA). Oestradiol was administered dissolved in 0.5 ml corn oil/kg BW, while LPS was dissolved in 0.5 ml PBS /kg BW. Birds in the control group were not treated, whereas birds in control-experiment groups were injected with 0.5 ml vehicle alone (corn oil or saline solution).
Blood and liver samples
Blood samples were collected at 3 h and 24 h, and on days 7 and 14 post first treatment with E2 and LPS injections. At each sampling time, three hens per treatment were euthanized by cervical dislocation, and all hens were euthanized on day 14 of the experiment. Blood samples were taken from the wing vein using individual EDTA vacutainers. Each bird was appropriately restrained to ensure as little stress as possible on the bird. Whole blood was used to measure haematological parameters in an automated analyser (CELL-DYN® System 3700CS, Abbott Park, IL 60064, USA) and plasma was used to determine fibrinogen (Schalm, Citation1980), and plasma metabolites triglycerides (TG) and gamma-glutamyltransferase (GGT). The procedures for these parameters are described in detail in Shini et al., Citation2019b.
The liver was removed, weighed, and examined for the presence of haemorrhagic lesions, and liver haemorrhages were graded on a scale from 0 to 5 (Shini et al., Citation2019a). Liver samples were taken for mRNA extraction and histology. Small pieces of liver were fixed in 10% formalin and embedded in paraffin, and sections stained with H&E. Liver slides were examined blind by two independent observers. Spleen was also collected and weighed. Body weights (g) of hens were recorded at day 1 (time 0 h) and then weekly on days 7 and 14. Mortality was recorded daily, and mortality rate was calculated as percentage (%) of cumulative mortality from the start of the experiment.
RNA extraction and real-time quantitative RT-PCR
The mRNA expression levels of IL-1β, IL-6, IL-18 were measured using real-time quantitative reverse transcription polymerase chain reaction (qRT-PCR) assays. Three 30-mg pieces of liver from each sample were immediately placed into RNA-Later and stored at –20°C prior to RNA purification. Total RNA was extracted from liver samples using an RNeasy plus mini kit (Qiagen, Doncaster, VIC Australia), following the manufacturer’s directions. Isolated RNA was eluted in 50 ml RNase-free water, and stored at –80°C until use. The yield of total RNA was determined using absorption of light at 260 and 280 nm in a Nanodrop (ND-1000) spectrophotometer. Primers and probes for the housekeeping gene (28S) and target genes (encoding IL-1β, IL-6, and IL-18) were designed, based upon sequences available from public databases, and synthesized by a commercial laboratory (OPERON Technologies, Cologne, Germany). All primers and probes tested in this study are presented in . All probes were labelled with the fluorescent reporter dye 5-carboxyfluorescein (FAM) at the 5′ end and with the quencher N, N, N, N′-tetramethyl-6-carboxyrhodamine (TAMRA) at the 3′ end. Reverse transcription and PCR were performed in separate reactions as previously described (Shini et al., Citation2010). First, 2 μg of RNA were reverse-transcribed into cDNA in a 20 μl RT reaction using SuperScript™ III First-Strand Synthesis System for RT-PCR (Invitrogen, Carlsbad, CA, USA) in a GeneAmp® PCR system 9700 (Applied Biosystems Inc., Foster City, CA, USA). After template denaturation at 65°C for 5 min, 10 μl of cDNA Synthesis Mix were added per tube and the programme was continued at 55°C for 50 min, 85°C for 5 min and then held at 4°C until removal from the machine. The PCR was performed in a 10 μl reaction containing 2 μl of cDNA from the RT reaction, 5 μl TaqMan® Universal PCR Master Mix (Applied Biosystems), 2 μl primer (at 3 μmol) and 1 μl probe (at 1.5 μmol). Each PCR plate contained target genes and 28S rRNA in triplicate and a no-template negative control, containing 2 μl water instead of cDNA. The real-time reactions were carried out on an ABI Prism 7900HT Fast Real-Time PCR System (Applied Biosystems) with the following cycle profile: 95°C for 10 min, and 50 repeat cycles of 95°C for 15 s and then 60°C for 1 min.
Table 1. Primer and probe sequences for qRT-PCR.
Quantification was based on the increased fluorescence detected by the 7900 Fast Sequence Detection System due to hydrolysis of the target-specific probes by the 5' nuclease activity of the rTth DNA polymerase during PCR amplification. Results are expressed in terms of the threshold cycle value (Ct), the cycle at which the change in the reporter dye passes a significance threshold (Rn). To account for variation in sampling and RNA preparation, the Ct values for cytokine-specific product for each sample were standardized using the Ct value of 28S rRNA product for the same sample. To normalize RNA levels between samples within an experiment, the mean Ct value for 28S rRNA-specific product was calculated by pooling values from all samples in that experiment. Tube-to-tube variations in 28S rRNA Ct values about the experimental mean were calculated. The slope of the 28S rRNA log10 dilution series regression line was used to calculate differences in input total RNA. Using the slopes of the respective cytokine and chemokine or 28S rRNA log10 dilution series regression lines, the difference in input total RNA, as represented by the 28S rRNA, was then used to adjust cytokine-specific Ct values, as follows:where Ct = mean sample Ct; Nt = mean experimental 28S;
= mean 28S of sample; S = cytokine slope, and S′ = 28S slope.
Statistical analysis
Biochemistry and haematology testing was done in duplicate for each sample and the average was used for further analyses. The mean (n = 6) and standard error of the mean (mean ± SEM) of plasma metabolites, WBC counts and performance parameters of controls and treated chickens were determined by one-way ANOVA for repeated measures (SAS Inc., Citation2001). Differences were further separated using Duncan’s multiple range test and considered significant at P < 0.05. Correlations between different significant measures were determined using Pearson's correlation coefficient. For cytokine mRNA expressions, statistical analyses were performed using Microsoft Office Excel 2010 v14.0 (Microsoft Corporation). PCR tests were repeated two times and each sample was assayed in triplicate. Data from two repeated tests were pooled for presentation and statistical analysis. The mean (n = 6) ± SEM for all cytokines were calculated for each group/treatment. For statistical purposes, an unpaired t-test was used to compare two means (control vs. E2 treatment; control vs. LPS treatment; control vs E2 & LPS treatment, and E2 vs. LPS treatment) and determine the P value. A 99% confidence interval for the true difference between the means was set, and the values were considered significant at P < 0.01.
Results
Mortality and liver haemorrhagic score demonstrated that all birds (100%) treated with E2 and E2 & LPS developed FLHS (). Birds treated with E2 & LPS showed more severe signs of FLHS. The mortality rate was higher (P < 0.05) in E2-treated birds than in E2- & LPS-treated birds. There were no mortalities in control-untreated and LPS-treated birds. All control groups had a low incidence of FLHS, in terms of haemorrhagic score (only one bird had liver haemorrhagic score 1–2). Body weight, relative organ (liver and spleen) weights and egg weight did not change significantly in response to treatments (supplementary material, ).
Table 2. Effect of oestrogen injections, and a single LPS injection on mortality, the incidence of FLHS, and liver haemorrhagic score of laying hensa.
Blood cell counts
Data on blood parameters (total WBC and RBC counts, percentages of heterophils and lymphocytes, and H/L ratios) are presented in . At 3 h post-treatment (with E2, LPS and E2 & LPS), WBC counts were significantly increased (P < 0.05) in E2- and LPS-treated birds when compared to other groups (controls and E2- & LPS-treated birds). As shown in , from the differential counts of heterophils and lymphocytes, and H/L ratios, the increase in leukocytes included both heterophils and lymphocytes. At 24 h post-treatment, hens exposed to LPS had an increase in total WBC; at this sampling point the increase favoured heterophils. The elevation in heterophil percentages and H/L ratio was significant (P < 0.05) compared to controls and previous measurement at 3 h (1.42 vs. 0.48 or 0.43, respectively). At 24 h post-treatment, WBC numbers were significantly raised (P < 0.01) in birds treated with E2 & LPS. Birds treated with E2 only, continued to have elevated WBC numbers approximately at the same level as at 3 h post-treatment. Birds treated with E2 or E2 & LPS demonstrated high numbers of leukocytes at week 1 and 2 post-treatment. At week 1 the increase in leukocytes included mainly heterophil numbers, but at week 2 the increase was proportional; therefore the H/L ratio was decreased and significantly different (P < 0.05) from LPS-treated birds, but was similar to values at 3 h (). One week after treatment started, WBC of birds treated with LPS were still elevated (approx. 32 × 109/l), and decreased significantly (P < 0.01) and reached the level of the control birds (approx. 18.6 × 10⁹/l) at week 2.
Table 3. Changes in blood cell counts (WBC and RBC), heterophil (H) and lymphocyte (L) percentages and H/L ratios in control and treated laying hens.a,b
Other WBC types did not show any significant change in percentages (data not shown); thrombocyte percentages were measured inconsistently, and not included in the study. Data on RBC counts of treated and untreated birds are presented in . The average RBC counts were consistent in all birds (untreated and treated). There was a slight but significant increase (P < 0.05) in RBC counts in control birds at 24 h and in E2-treated birds at week 2 compared to LPS-treated birds at 3 h and at week 1.
Fibrinogen
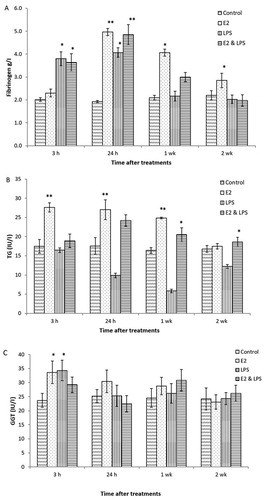
As shown in a, at 3 h plasma fibrinogen concentrations in LPS- and E2- & LPS-treated birds were slightly elevated (P < 0.05) when compared to control birds (3.8 and 3.6 g/l vs. 2.0 g/l, respectively). At 24 h there was an increase in fibrinogen concentration in all treated birds (E2, LPS and E2 & LPS); surprisingly, in E2-treated hens, fibrinogen concentration was higher than in LPS-treated hens (5 g/l vs. 4.1 g/ l, respectively). In terms of time, fibrinogen concentration started rising in LPS-treated birds earlier than in E2-treated birds. As presented in (a), elevated concentrations of fibrinogen remained high in weeks 1 and 2 post-treatment with E2, while in LPS-treated birds (LPS and E2 & LPS treatments), fibrinogen concentrations declined to the value for control birds after the first week of treatment. In general, fibrinogen levels in E2 treated birds followed WBC levels.
Figure 1. Plasma concentrations of fibrinogen, triglycerides (TG), and gamma glutamyl transferase (GGT) in treated and untreated hens. E2 = oestrogen-treated; LPS = LPS-treated; E2 & LPS = E2- and LPS-treated; control = data are pooled for all controls (not treated, corn-oil treated and PBS-treated hens). Values are expressed as mean ± SEM (n = 6).
Plasma metabolites
Plasma concentration for TG and GGT for treated (E2, LPS, and E2 & LPS) and untreated birds, are presented in (b,c), respectively. Data from control groups are pooled and presented together (control/untreated, oil- and saline-treated groups). Hens treated with E2 showed increased (P < 0.01) levels of plasma TG ((b)). In both E2-treated groups, plasma TG rose significantly 24 h after the first treatment, and remained elevated at week 1 post-treatment. Birds treated with LPS had a significant decrease (P < 0.05) in plasma TG, especially at 24 h post-treatment when compared to control birds. For this study, both GGT and AST levels were measured, as both enzymes could indicate liver damage. Only data for GGT are presented ((c)), as there was an increase (P < 0.05) in activity within 3 h after first treatment with E2 and LPS. No significant changes were detected for AST. No control birds had any changes in plasma metabolites at any measurement point.
Liver histological examination
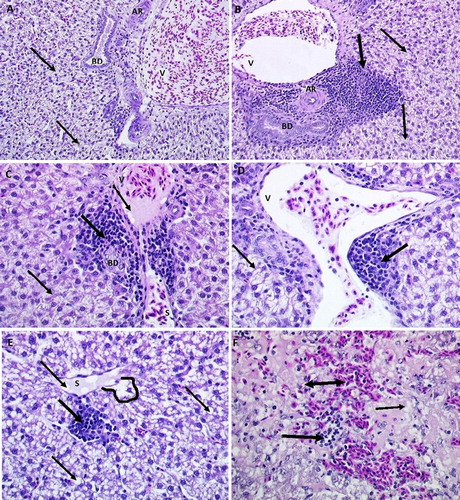
The liver tissue of hens treated with E2, LPS, and E2 & LPS had significant histological changes when compared to samples from control hens ((a–f)). Liver samples from treated hens revealed the most extensive fat deposition (in terms of cells with 50–75% vacuolization) and infiltrations with WBC (2b and 2d) and RBC in the areas surrounding blood vessels or into liver parenchyma. Large vacuoles containing fat distended many hepatocytes ((c,d)) or totally replaced the cytoplasm and atrophied the nucleus ((e,f)). Other abnormalities associated with lipid droplets were found in the sinusoidal endothelial cells ((e)), Disse space (area located between the sinusoidal membrane and plasma membrane of the liver cell), perisinusoidal cells ((a)) or in the spaces of periportal hepatic arterioles and portal venules ((c)). In particular, major areas of mononuclear aggregations, and increased incidence of sinusoidal congestions and petechial haemorrhages were evident in livers from both E2, and E2 & LPS groups ((f)).
Figure 2. Histological sections (H&E stain) showing livers from control, LPS-treated, and E2- & LPS-treated hens. Image A (×200) shows normal portal triad from control hens (V = portal venule; AR = hepatic artery; BD = bile duct), with some hepatocyte fat infiltration (thin arrows). Image B (×200) shows inflammatory cell infiltration (thick arrow) in the periportal area surrounding portal triad. Images C and D (×400) show periportal inflammation in livers from E2-treated hens. Note moderate periportal inflammation (thick arrow) and fat infiltration (thin arrow). Images E and F (×400) show inflammation and haemorrhages in livers from LPS- & E2-treated hens. Note severe parenchymal and sinusoidal (S) fat (thin arrow), leukocyte (thick arrow), RBC (double-headed arrow) infiltration and sinusoidal dilation (lined area), congestion and telangiectasia.
Cytokine gene expression in hepatocytes
Results are expressed as differences (n-fold) between treated samples and controls. Data on mRNA expression of targeted cytokines (IL-1β, IL-6, and IL-18) from hepatocytes are presented at 3 h and 24 h after first treatment with E2, LPS, and E2 & LPS (). These two sampling times were found relevant in terms of acute phase changes post LPS and E2 administrations. shows the standardized data for cytokines of treated birds expressed as fold changes in mRNA levels compared to basal mRNA levels. At 3 h following treatments with E2 and LPS, the mean mRNA levels of IL-1β, IL-6 and IL-18 of each group/treatment pooled together increased by 3-fold to 58-fold, compared to basal levels (P < 0.01).
Figure 3. Cytokine mRNA expression profiles from real-time qRT-PCR analyses of hepatocytes of treated hens compared to baseline levels and controls at 3 h and 24 h post-treatments. E2 = oestrogen-treated; LPS = LPS-treated; E2 & LPS = E2- and LPS-treated. All Ct values were corrected using the housekeeping gene 28S, and time point 0 was used as the calibrator. Values are expressed as mean ± SEM fold change relative to control (data are pooled for all controls: not treated, corn-oil treated and PBS-treated birds). Error bars show SEM from triplicate samples (n = 16) from two separate qRT-PCR experiments (P < 0.01, unpaired t-test).
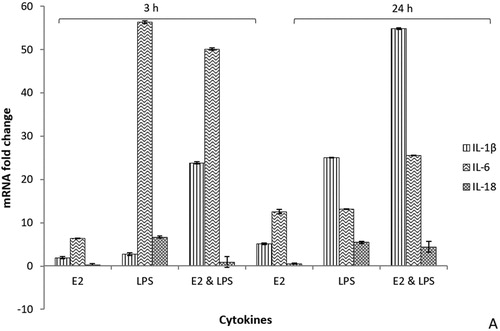
The expression of IL-6 mRNA in hepatocytes of all treated groups (E2, LPS and E2 & LPS hens) was elevated (P < 0.01) from 6-fold to 56-fold as compared to baseline and controls. The largest change was found in LPS- and E2- & LPS-treated birds at 3 h post-treatment when compared to controls. At 24 h later, IL-6 gene expression was slightly decreased, but was still significantly elevated by approximately 20-fold. When compared to E2 only treatments, all LPS and E2 & LPS birds demonstrated higher (P < 0.01) levels of IL-6 and IL-1β. The expression of mRNA for IL-6 and IL-1β in E2-treated birds was moderate, but significantly up-regulated (P < 0.01) from 3-fold to 12-fold at 3 h and 24 h after treatment with E2, respectively. The mRNA levels for IL-1β were highly expressed at 24 h in all treated birds (E2, LPS, and E2 & LPS). At 3 h and 24 h, mRNA levels for IL-1β were highly (P < 0.01) up-regulated in E2- & LPS-treated birds when compared to other treatments (E2 and LPS). The expression of IL-18 mRNA in the liver tissue was lower than IL-1β and IL-6 mRNAs for all treatments. At 3 h and 24 h post-treatment with E2, the mRNA levels for IL-18 were minimal to undetectable in E2- treated birds. In LPS-treated birds, at 3 h and 24 h, the expression of mRNA IL-18 was significantly (P < 0.01) elevated (< 5-fold).
Discussion
Studies were conducted to investigate the role of inflammation in the pathophysiology and onset of FLHS. In a previous study, we used an oestrogenized laying hen as a model to investigate FLHS (Shini et al., Citation2019b). This model suggested that an inflammatory response was implicated in altered lipid metabolism, and could have been the reason for the hepatic injury triggering FLHS. In the current study, we have extended the oestrogenized laying hen model by challenging hens with LPS to induce inflammation.
Lipopolysaccharide is an endotoxin derived from the outer membrane of Gram-negative bacteria (natural inhabitants of the intestinal tract). It is detected in the portal venous blood suggesting that dietary and microbial LPS is absorbed through the intestinal epithelia, and in the case of an “overdose” it induces inflammation that might lead to cell injury and hepatic damage (Ramaiah & Rose, Citation2010; Rorato, et al., Citation2017; Yücel et al., Citation2017). The LPS challenge, introduced at the start of oestradiol treatments in this study, was based on suggestions that LPS is suitable for studies of systemic and hepatic inflammation (Harte, et al., Citation2010; Kanuri & Bergheim, Citation2013; Fukunishi et al., Citation2014). It initiates a hepatic inflammatory response, and stimulates the production of acute phase proteins (APP) including fibrinogen (Gruys et al., Citation2005) and immune cytokines (Gruys, et al., Citation2005; Cray et al., Citation2009).
The progression of the inflammatory response in the FLHS hen model was assessed through the evaluation of cellular and molecular inflammatory biomarkers of plasma and liver tissue. Among other parameters, the hepatic mRNA levels of the genes that encode key regulators of the hepatic inflammation such as IL-1β, IL-6 and IL-18 (Braunersreuther et al., Citation2012; Finotto et al., Citation2004) were evaluated. Chicken cytokines (IL-1β, IL-6, and IL-18) are known to be involved in the activation and promotion of leukocyte infiltration at sites of injury (Kalaiyarasu et al., Citation2016). Adipokines also possess pro- and anti-inflammatory properties and play a critical role in integrating systemic metabolism with immune response; in individuals with normal metabolic status, there is a balance of pro- and anti-inflammatory adipokines (Mancuso, Citation2016). However, there is research published that confirms the loss/absence of several adipokine genes in the chicken genome (Daković et al., Citation2014), therefore adipokine gene expression levels were not measured in this study.
In the current study, the expression levels of IL-1β, IL-6, and IL-18 mRNA in hepatocytes of laying hens were quantified using real-time qRT-PCR. As presented in the results (), at 3 h post-treatment, the expression of both IL-1β, IL-6 was highly upregulated in both E2- and LPS-treated hens, with IL-6 responding stronger in the acute phase response (3 h post-treatment), and IL-1β being more expressed at a later stage (at 24 h). The expression of IL-18 mRNA was significantly elevated only in LPS-treated birds. It is recognized that cytokines crosstalk on multiple levels. IL-6 is a pro-inflammatory cytokine and the major inducer of APP production in hepatocytes (El-Kadre & Tinoco, Citation2013; Gruys, et al., Citation2005), but there have been suggestions that IL-6 also has anti-inflammatory properties. IL-6 also appears to be the primary inducer of some hepatocyte-derived AAP with anti-inflammatory properties (Barton, Citation1997). It is no surprise that IL-6 expression was elevated in all treated birds (in response to both LPS and or E2 challenge), given the important role of this cytokine in homeostasis. IL-1β and IL-18 are related cytokines that were recognized early on for their ability to cause a wide variety of biological effects associated with infection, inflammation, and autoimmunity (Finotto, et al., Citation2004; Dinarello, Citation2006). Both IL-1β and IL-18 are members of the same structural family; IL-1β regulates systemic and local responses to infection, injury and immunological challenge by generating fever, activating lymphocytes and promoting leukocyte transmigration into sites of injury or infection (Dinarello, Citation2006), while IL-18 is produced by many cell types, such as Kupffer cells, keratinocytes, macrophages, dendritic cells, and activated T cells, and it is seen as a unique cytokine that enhances innate immunity and activates both Th1- and Th2-driven immune responses (Dinarello et al., Citation2013). Cellular signalling studies have shown that IL-1β counteracts signal transduction of IL-6-type cytokines at different levels: it affects IL-6-induced gene expression by acting on target gene promoters (Radtke et al., Citation2010). This mechanism explains observations in our study such as the down-regulation of the IL-6 mRNA expression, while levels of IL-1β mRNA were highly up-regulated.
In terms of the treatments, LPS-treated birds had an increased inflammatory response and up-regulation of IL-6, IL-1β mRNA expression in hepatocytes. The administration of E2 only moderately stimulated the expression of IL-6, IL-1β, but the combination of E2 with LPS caused a higher and stronger (than E2 alone) and longer (than LPS alone) response, thus reinforcing the hypothesis that the inflammatory response (induced by E2 and LPS in this study) triggered liver injury in the context of hepatic steatosis. The liver is not only a LPS target organ (Pagani et al., Citation2003), but also the organ for LPS clearance (Mimura et al., Citation1995; Pagani et al., Citation2003). Thus, LPS and LPS-induced pro-inflammatory cytokines are seen as important mediators implicated in the pathogenesis of liver diseases including hepatic steatohepatitis (Harte et al., Citation2010), and FLHS in the laying hen. To our knowledge, this is the first study to explore endotoxin-induced inflammation in an endocrine-induced FLHS model, and demonstrate inflammatory cytokine involvement in the pathogenesis of FLHS in the hen.
It should be noted that there are a number of cytokines involved in the regulation of endocrine and metabolic responses which are produced by leukocytes, hepatocytes and adipocytes. In the pathogenesis of NAFLD, a multi-hit (factorial) hypothesis has been proposed where the saturated fatty acids (FAs) represent the first hit, followed by other hits released from LPS and pro-inflammatory mediators leading to inflammation, hepatocellular injury, steatosis and non-alcoholic steatohepatitis (NASH) (Csak et al., Citation2011; Bieghs & Trautwein, Citation2013; Zwolak et al., Citation2015). Among other factors, interactions between the intestinal mucosal barrier and liver (known as gut-liver axis) have been considered to play an important role (Kirpich et al., Citation2015; Zwolak et al., Citation2015). In humans, due to dysbiosis, intestinal permeability and small intestinal bacterial overgrowth are increased in NAFLD patients and these factors are associated with the severity of hepatic steatosis (Henao-Mejia et al., Citation2012; Miele et al., Citation2009). Similarly, in laying hens, a simple fat infiltration (steatosis or so-called physiological fatty liver) with minimal inflammation, tends to be stable over time (as seen in (a) in livers of control hens). It appears that LPS (or other mediators induced by LPS) could be the reason for the transition of simple steatosis to FLHS in the current study. Under commercial conditions, there are many nutritional and environmental factors that could deliver “the second hit” through LPS, and or other gut-liver axis mediators, and trigger the transition of fatty livers to haemorrhagic fatty livers in susceptible hens. In laying hens, 3–5% of a flock (Pearson & Butler, Citation1978; Dimitrov et al., Citation1980; Hansen & Walzem, Citation1993; Valkonen et al., Citation2008) or in extreme cases over 20% of a flock (Weitzenburger et al., Citation2005), or 40–70% of dead hens (Shini et al., Citation2006; Shini, et al., Citation2019a) are diagnosed with FLHS.
Recent studies in mammals have also shown that intestinal flora influences nutrient acquisition, energy homeostasis, and, ultimately, the control of body weight (Frazier et al., Citation2011; Le Roy et al., Citation2013; Kirpich et al., Citation2015). The interplay between dietary factors, gut microbiota, and gut-liver axis is seen as a critical component of obesity and obesity-associated NAFLD (Kirpich et al., Citation2015). It is thought that feed (dietary factors including lipids), and other husbandry factors that alter the gut microbiota and intestinal barrier function in chickens, will affect the first and most visited organ, the liver.
Other markers of liver inflammation that were evaluated in this study were peripheral leukocyte counts. Data on leukocyte counts, and percentages, in challenged hens demonstrated an increase in systemic lymphocytes most probably due to their movement towards liver tissue (triggered by APP and LPS, and the release of hepatic cytokines). One inflammatory molecule that has not previously been mentioned in the pathology of FLHS is fibrinogen, an APP. Fibrinogen levels were altered in the experiments with E2 and E2 & LPS treatments ((a)), and were found to follow patterns similar to other birds, reacting as a slow responding APP with a possible delay of some days after the challenge (Gruys et al., Citation2005; Cray et al., Citation2009). Fibrinogen is a clotting factor that provides a substrate for fibrin formation, and thus is important in tissue repair; it plays a multifaceted role in the immune and inflammatory response (Mosesson et al., Citation2001), as it regulates leukocyte function, migration, cytokine and chemokine expression, degranulation, and other specialized processes (Ugarova & Yakubenko, Citation2001; Flick et al., Citation2004). Fibrinogen concentration can be used as a general clinical biomarker of inflammation, including cases of liver inflammation and damage. However, fibrinogen concentration is not a specific parameter to be used, as it may identify the inflammation or infection, but would not identify the source of inflammation within the body. Elevated levels of fibrinogen, 2 to 10 times higher than normal values, could indicate the development of cellular and molecular processes involved in coagulation, inflammation and injury-related diseases (Levi et al., Citation2003). Elevated plasma levels of fibrinogen, indicating chronic subclinical inflammation, have been associated with metabolic diseases (Bhatia et al., Citation2012), suggesting that fibrinogen testing could help in the detection of low-grade inflammation as a critical component of the metabolic syndrome (Wisse, Citation2004). The stimulation of fibrinogen synthesis during acute-phase reaction is mediated by IL-6, which has a prominent role in direct up-regulation of fibrinogen gene expression (Caso et al., Citation2009). In the current study the evaluation of mRNA expression of IL-6 demonstrated an earlier up-regulation of IL-6 (at 3 h post-treatment with LPS, and E2 & LPS) than the fibrinogen levels. Increased levels of fibrinogen followed the IL-6 up-regulation and peaked at 24 h post-treatment. These data demonstrate the importance of IL-6 and fibrinogen as protective molecules that participate in the resolution of inflammation and tissue repair, as is the case for FLHS induced by E2 and E2 & LPS in hens. Other plasma metabolites measured in this study were TG and GGT; GGT was measured as it is a more specific indicator of liver dysfunction in mammals and birds (Center, Citation2007; Lim et al., Citation2007). Studies in humans and birds have shown that there is a correlation between GGT and TG in patients with steatohepatitis (Sakugawa et al., Citation2004; Lim et al., Citation2007). In this study, GGT was slightly elevated (P < 0.05) within 3 h after first treatment with E2 and LPS, while plasma TG rose significantly in E2 treated birds, at 24 h and 1 week post-treatment. Hens treated with LPS had a significant decrease (P < 0.05) in plasma TG, which reflects the increase in lipolysis induced by LPS and cytokines (Feingold et al., Citation1994). Fat mobilization is one of the predominant metabolic alterations during the acute phase response (Khovidhunkit et al., Citation2004).
The results of this study suggest that FLHS is most probably the result of the impact of a disturbed lipid metabolism on hepatic tissue and function, resulting in pathomorphological and pathophysiological alterations in this organ. In particular, in the laying hen that has an increased need for fat (to synthetize fat delivered in the egg; one egg yolk contains approx. 6 g fat), fats absorbed from the intestinal tract and fats synthetized from non-lipid compounds (lipogenesis) are deposited as organ and egg lipids (Annison, Citation1983). As we have discussed and proposed in the accompanying paper, the specific structural features of chicken liver could be the reason for hepatic steatosis (Shini et al., Citation2019b). The chicken liver histomorphology differs from mammals, in that the fenestra in the sinusoidal endothelium are smaller in size and lower in number; therefore, the endothelium is less porous than in mammals (Braet & Wisse, Citation2002; Fraser et al., Citation1986), allowing only small macromolecules and portomicrons to traverse through their fenestrations to hepatocytes. Large particles that cannot pass the fenestrae in the sinusoidal capillary bed, and cannot be also processed by the liver, are trapped inside the sinusoids surrounding the central vein. Hepatocytes are swamped by increased lipogenesis, while interstitial tissue is flooded by dietary fat, both sources creating the intracapsular lipid pressure. The interstitial lipid pressure of an inflamed and injured liver tissue causes internal damage of the tissue and blood vessels (generating small or large haematomas), or the rupture of the overstretched liver capsule and massive haemorrhage. Under field conditions, susceptible hens (high-producing laying hens with elevated oestrogen levels), which are also exposed to an inflammatory insult, are prone to FLHS.
Disclosure statement
No potential conflict of interest was reported by the authors.
Acknowledgements
The authors would like to acknowledge the Australian Egg Corporation Limited (AECL) and the Poultry CRC, for funding which made this study possible.
References
- Anderson, N. & Borlak, J. (2008). Molecular mechanisms and therapeutic targets in steatosis and steatohepatitis. Pharmacological Reviews, 60, 311–357. doi: 10.1124/pr.108.00001
- Annison, E. (1983). Lipid metabolism. In B. Freeman (Ed.), Physiology and biochemistry of the domestic fowl (pp. 165–174). London, UK: Academic Press.
- Arisqueta, L., Nunez-Garcia, M., Ogando, J., Garcia-Arcos, I., Ochoa, B., Aspichueta, P., Fresnedo, O. & Rueda, Y. (2013). Involvement of lipid droplets in hepatic responses to lipopolysaccharide treatment in mice. Biochimica et Biophysica Acta, 1831, 1357–1367. doi: 10.1016/j.bbalip.2013.04.015
- Asghar, A. & Sheikh, N. (2017). Role of immune cells in obesity induced low grade inflammation and insulin resistance. Cellullar Immunology, 315, 18–26. doi: 10.1016/j.cellimm.2017.03.001
- Barton, B.E. (1997). IL-6: insights into novel biological activities. Clinical Immunology and Immunopathology, 85, 16–20. doi: 10.1006/clin.1997.4420
- Bhatia, L.S., Curzen, N.P., Calder, P.C. & Byrne, C.D. (2012). Non-alcoholic fatty liver disease: a new and important cardiovascular risk factor? European Heart Journal, 33, 1190–1200. doi: 10.1093/eurheartj/ehr453
- Bieghs, V. & Trautwein, C. (2013). The innate immune response during liver inflammation and metabolic disease. Trends in Immunology, 34, 446–452. doi: 10.1016/j.it.2013.04.005
- Bozza, P.T. & Viola, J.P. (2010). Lipid droplets in inflammation and cancer. Prostaglandins, Leukotrienes & Essential Fatty Acids, 82, 243–250. doi: 10.1016/j.plefa.2010.02.005
- Braet, F. & Wisse, E. (2002). Structural and functional aspects of liver sinusoidal endothelial cell fenestrae: a review. Comparative Hepatology, 1, 1–17. doi: 10.1186/1476-5926-1-1
- Branton, S.L., Lott, B.D., Maslin, W.R. & Day, E.J. (1995). Fatty liver-hemorrhagic syndrome observed in commercial layers fed diets containing chelated minerals. Avian Diseases, 39, 631–635. doi: 10.2307/1591819
- Braunersreuther, V., Viviani, G.L., Mach, F. & Montecucco, F. (2012). Role of cytokines and chemokines in non-alcoholic fatty liver disease. World Journal of Gastroenterology, 18, 727–735. doi: 10.3748/wjg.v18.i8.727
- Butler, E. (1976). Fatty liver diseases in the domestic fowl-a review. Avian Pathology, 5, 1–14. doi: 10.1080/03079457608418164
- Cain, J., Hales, D., Small, C., Banz, W. & Davis, J. (2014). Effect of plant-based polyunsaturated fatty acids on characteristics of fatty liver disease in laying hens. The FASEB Journal, 28, 829.27.
- Caso, G., Mileva, I., Kelly, P., Ahn, H., Gelato, M.C. & McNurlan, M.A. (2009). Feeding acutely stimulates fibrinogen synthesis in healthy young and elderly adults. Journal of Nutrition, 139, 2032–2036. doi: 10.3945/jn.109.107532
- Center, S.A. (2007). Interpretation of liver enzymes. Veterinary Clinics of North America: Small Animal Practice, 37, 297–333. doi: 10.1016/j.cvsm.2006.11.009
- Cherian, G. & Goeger, M.P. (2004). Hepatic lipid characteristics and histopathology of laying hens fed CLA or n-3 fatty acids. Lipids, 39, 31–36. doi: 10.1007/s11745-004-1198-2
- Coelho, M., Oliveira, T. & Fernandes, R. (2013). Biochemistry of adipose tissue: an endocrine organ. Archives of Medical Science, 9, 191–200. doi: 10.5114/aoms.2013.33181
- Cray, C., Zaias, J. & Altman, N.H. (2009). Acute phase response in animals: a review. Comparative Medicine, 59, 517–526.
- Csak, T., Ganz, M., Pespisa, J., Kodys, K., Dolganiuc, A. & Szabo, G. (2011). Fatty acid and endotoxin activate inflammasomes in mouse hepatocytes that release danger signals to stimulate immune cells. Hepatology, 54, 133–144. doi: 10.1002/hep.24341
- Cusi, K. (2012). Role of obesity and lipotoxicity in the development of nonalcoholic steatohepatitis: pathophysiology and clinical implications. Gastroenterology, 142, 711–725. doi: 10.1053/j.gastro.2012.02.003
- Daković, N., Térézol, M., Pitel, F., Maillard, V., Elis, S., Leroux, S., Lagarrigue, S., Gondret, F., Klopp, C., Baeza, E., Duclos, M.J., Roest Crollius, H. & Monget, P. (2014). The loss of adipokine genes in the chicken genome and implications for insulin metabolism. Molecular Biology and Evolution, 10, 2637–2646. doi: 10.1093/molbev/msu208
- Davail, S., Rideau, N., Guy, G., André, J.M., Hermier, D. & Hoo-Paris, R. (2003). Hormonal and metabolic responses to overfeeding in three genotypes of ducks. Comparative Biochemistry and Physiology Part A: Molecular & Integrative Physiology, 134, 707–715. doi: 10.1016/S1095-6433(02)00365-3
- Diaz, G.J., Squires, E.J. & Julian, R.J. (1994). Effect of selected dietary antioxidants on fatty liver-haemorrhagic syndrome in laying hens. British Poultry Science, 35, 621–629. doi: 10.1080/00071669408417727
- Dimitrov, A., Antonov, S., Stoianov, P., Petrova, L. & Aleksandrova, E. (1980). [Fatty liver syndrome in laying hens]. Veterinarno-medicinski nauki, 17, 81–89.
- Dinarello, C.A. (2006). Interleukin 1 and interleukin 18 as mediators of inflammation and the aging process. The American Journal of Clinical Nutrition, 83, 447S–455S. doi: 10.1093/ajcn/83.2.447S
- Dinarello, C.A., Novick, D., Kim, S. & Kaplanski, G. (2013). Interleukin-18 and IL-18 binding protein. Frontiers in Immunology, 4, 1–10.
- El-Kadre, L.J. & Tinoco, A.C. (2013). Interleukin-6 and obesity: the crosstalk between intestine, pancreas and liver. Current Opinion in Clinical Nutrition and Metabolic Care, 16, 564–568.
- EU Report. (1998). Welfare aspects of the production of foie gras in ducks and geese. Summary. Scientific Committee on Animal Health and Animal Welfare, p. 43, Retrieved from https://ec.europa.eu/food/sites/food/files/safety/docs/sci-com_scah_out17_en.pdf.
- Feingold, K.R., Marshall, M., Gulli, R., Moser, A.H. & Grunfeld, C. (1994). Effect of endotoxin and cytokines on lipoprotein lipase activity in mice. Arteriosclerosis, Thrombosis, and Vascular Biology, 14, 1866–1872. doi: 10.1161/01.ATV.14.11.1866
- Finotto, S., Siebler, J., Hausding, M., Schipp, M., Wirtz, S., Klein, S. & Finotto, S. (2004). Severe hepatic injury in interleukin 18 (IL-18) transgenic mice: a key role for IL-18 in regulating hepatocyte apoptosis in vivo. Gut, 53, 392–400. doi: 10.1136/gut.2003.018572
- Flick, M.J., Du, X., Witte, D.P., Jirouskova, M., Soloviev, D.A., Busuttil, S.J., Plow, E.F. & Degen, J.L. (2004). Leukocyte engagement of fibrin(ogen) via the integrin receptor alphaMbeta2/Mac-1 is critical for host inflammatory response in vivo. Journal of Clinical Investigation, 113, 1596–1606. doi: 10.1172/JCI20741
- Fraser, R., Heslop, V.R., Murray, F.E. & Day, W.A. (1986). Ultrastructural studies of the portal transport of fat in chickens. British Journal of Experimental Pathology, 67, 783–791.
- Frazier, T.H., DiBaise, J.K. & McClain, C.J. (2011). Gut microbiota, intestinal permeability, obesity-induced inflammation, and liver injury. The Journal of Parenteral and Enteral Nutrition, 35, 14s–20s. doi: 10.1177/0148607111413772
- Fukunishi, S., Sujishi, T., Takeshita, A., Ohama, H., Tsuchimoto, Y., Asai, A., Tsuda, Y. & Higuchi, K. (2014). Lipopolysaccharides accelerate hepatic steatosis in the development of nonalcoholic fatty liver disease in Zucker rats. Journal of Clinical Biochemistry and Nutrition, 54, 39–44. doi: 10.3164/jcbn.13-49
- Gruys, E., Toussaint, M.J., Niewold, T.A. & Koopmans, S.J. (2005). Acute phase reaction and acute phase proteins. Journal of Zhejiang University SCIENCE B, 6, 1045–1056. doi: 10.1631/jzus.2005.B1045
- Guémené, D., Guy, G., Noirault, J., Garreau-Mills, M., Gouraud, P. & Faure, J.M. (2001). Force-feeding procedure and physiological indicators of stress in male mule ducks. British Poultry Science, 42, 650–657. doi: 10.1080/00071660120088489
- Hansen, R.J. & Walzem, R.L. (1993). Avian fatty liver hemorrhagic syndrome: a comparative review. Advances in Veterinary Science and Comparative Medicine, 37, 451–468.
- Harte, A.L., da Silva, N.F., Creely, S.J., McGee, K.C., Billyard, T., Youssef-Elabd, E.M., Tripathi, G., Ashour, E., Abdalla, M.S., Sharada, H.M., Amin, A.I., Burt, A.D., Kumar, S., Day, C.P. & McTernan, P.G. (2010). Elevated endotoxin levels in non-alcoholic fatty liver disease. Journal of Inflammation, 7, 15. doi: 10.1186/1476-9255-7-15
- Henao-Mejia, J., Elinav, E., Jin, C., Hao, L., Mehal, W.Z., Strowig, T., Thaiss, C.A., Kau, A.L., Eisenbarth, S.C., Jurczak, M.J., Camporez, J.-P., Shulman, G.I., Gordon, J.I., Hoffman, H.M. & Flavell, R.A. (2012). Inflammasome-mediated dysbiosis regulates progression of NAFLD and obesity. Nature, 482, 179–185. doi: 10.1038/nature10809
- Hochleithner, M., Hochleithner, C. & Harrison, L.D. (2006). Clinical Avian Medicine. In G.J. Harrison & T.L. Lightfoot (Eds.), Evaluating and treating the liver (pp. 441–449). Palm Beach, FL: Spix Publishing Inc.
- Hotamisligil, G.S. (2006). Inflammation and metabolic disorders. Nature, 444, 860–867. doi: 10.1038/nature05485
- Hotamisligil, G.S. & Erbay, E. (2008). Nutrient sensing and inflammation in metabolic diseases. Nature Reviews Immunology, 8, 923–934. doi: 10.1038/nri2449
- Hünigen, H., Mainzer, K., Hirschberg, R.M., Custodi, S.P., Gemeinhardt, O., Al Masri, S., Richardson, K.C., Hafez, H.M. & Plendl, J. (2016). Structure and age-dependent development of the turkey liver: a comparative study of a highly selected meat-type and a wild-type turkey line. Poultry Science, 95, 901–911. doi: 10.3382/ps/pev358
- Kaisho, T. & Akira, S. (2002). Toll-like receptors as adjuvant receptors. Biochimica et Biophysica Acta, 1589, 1–13. doi: 10.1016/S0167-4889(01)00182-3
- Kalaiyarasu, S., Bhatia, S., Mishra, N., Sood, R., Kumar, M., SenthilKumar, D., Bhat, S. & Dass Prakash, M. (2016). Elevated level of pro inflammatory cytokine and chemokine expression in chicken bone marrow and monocyte derived dendritic cells following LPS induced maturation. Cytokine, 85, 140–147. doi: 10.1016/j.cyto.2016.06.022
- Kanuri, G. & Bergheim, I. (2013). In vitro and in vivo models of non-alcoholic fatty liver disease (NAFLD). International Journal of Molecular Sciences, 14, 11963–11980. doi: 10.3390/ijms140611963
- Khovidhunkit, W., Kim, M.S., Memon, R.A., Shigenaga, J.K., Moser, A.H., Feingold, K.R., & Grunfeld, C. (2004). Effects of infection and inflammation on lipid and lipoprotein metabolism: mechanisms and consequences to the host. Journal of Lipid Research, 45, 1169–1196. doi: 10.1194/jlr.R300019-JLR200
- Kirpich, I.A., Marsano, L.S. & McClain, C.J. (2015). Gut–liver axis, nutrition, and non-alcoholic fatty liver disease. Clinical Biochemistry, 48, 923–930. doi: 10.1016/j.clinbiochem.2015.06.023
- Kohjima, M., Enjoji, M., Higuchi, N., Kato, M., Kotoh, K., Yoshimoto, T., Fujino, T., Yada, M., Yada, R., Harada, N., Takayanagi, R. & Nakamuta, M. (2007). Re-evaluation of fatty acid metabolism-related gene expression in nonalcoholic fatty liver disease. International Journal of Molecular Medicine, 20, 351–358.
- Le Roy, T., Llopis, M., Lepage, P., Bruneau, A., Rabot, S., Bevilacqua, C., Martin, P., Philippe, C., Walker, F., Bado, A., Perlemuter, G., Cassard-Doulcier, A.-M. & Gérard, P. (2013). Intestinal microbiota determines development of non-alcoholic fatty liver disease in mice. Gut, 62, 1787–1794. doi: 10.1136/gutjnl-2012-303816
- Lee, K., Flegal, C.J. & Wolford, J.H. (1975). Factors affecting liver fat accumulation and liver hemorrhages associated with fatty liver-hemorrhagic syndrome in laying chickens. Poultry Science, 54, 374–380. doi: 10.3382/ps.0540374
- Levi, M., Keller, T.T., van Gorp, E. & ten Cate, H. (2003). Infection and inflammation and the coagulation system. Cardiovascular Research, 60, 26–39. doi: 10.1016/S0008-6363(02)00857-X
- Lim, J.S., Lee, D.H., Park, J.Y., Jin, S.H. & Jacobs, D.R. Jr. (2007). A strong interaction between serum gamma-glutamyltransferase and obesity on the risk of prevalent type 2 diabetes: results from the Third National Health and Nutrition Examination Survey. Clinical Chemistry, 53, 1092–1098. doi: 10.1373/clinchem.2006.079814
- Mancuso, P. (2016). The role of adipokines in chronic inflammation. ImmunoTargets and Therapy, 5, 47–56. doi: 10.2147/ITT.S73223
- Miele, L., Valenza, V., La Torre, G., Montalto, M., Cammarota, G., Ricci, R., Mascianà, R., Forgione, A., Gabrieli, M.L., Perotti, G., Vecchio, F.M., Rapaccini, G., Gasbarrini, G., Day, C.P. & Grieco, A. (2009). Increased intestinal permeability and tight junction alterations in nonalcoholic fatty liver disease. Hepatology, 49, 1877–1887. doi: 10.1002/hep.22848
- Mimura, Y., Sakisaka, S., Harada, M., Sata, M. & Tanikawa, K. (1995). Role of hepatocytes in direct clearance of lipopolysaccharide in rats. Gastroenterology, 109, 1969–1976. doi: 10.1016/0016-5085(95)90765-3
- Mosesson, M.W., Siebenlist, K.R. & Meh, D.A. (2001). The structure and biological features of fibrinogen and fibrin. The Annals of the New York Academy of Sciences, 936, 11–30. doi: 10.1111/j.1749-6632.2001.tb03491.x
- Mourot, J., Guy, G., Lagarrigue, S., Peiniau, P. & Hermier, D. (2000). Role of hepatic lipogenesis in the susceptibility to fatty liver in the goose (Anser anser). Comparative Biochemistry & Physiology Part B: Biochemistry and Molecular Biology, 126, 81–87. doi: 10.1016/S0305-0491(00)00171-1
- Mraz, M. & Haluzik, M. (2014). The role of adipose tissue immune cells in obesity and low-grade inflammation. Journal of Endocrinology, 222, R113–127. doi: 10.1530/JOE-14-0283
- Naber, E.C. & Biggert, M.D. (1989). Patterns of lipogenesis in laying hens fed a high fat diet containing safflower oil. Journal of Nutrition, 119, 690–695. doi: 10.1093/jn/119.5.690
- Newton, K. & Dixit, V.M. (2012). Signaling in innate immunity and inflammation. Cold Spring Harbor Perspectives in Biology, 4, 1–8. doi: 10.1101/cshperspect.a006049
- Osborn, O. & Olefsky, J.M. (2012). The cellular and signaling networks linking the immune system and metabolism in disease. Nature Medicine, 18, 363–374. doi: 10.1038/nm.2627
- Ouchi, N., Parker, J.L., Lugus, J.J. & Walsh, K. (2011). Adipokines in inflammation and metabolic disease. Nature reviews. Immunology, 11, 85–97. doi: 10.1038/nri2921
- Pagani, R., Portoles, M.T., De La Vina, S., Melzner, I. & Vergani, G. (2003). Alterations induced on cytoskeleton by Escherichia coli endotoxin in different types of rat liver cell cultures. Histology and Histopathology, 18, 837–848.
- Pearson, A.W., Arkhipov, A.V., Butler, E.J. & Laursen-Jones, A.P. (1978). Influence of dietary cereal and energy content on the accumulation of lipids in the liver in fatty liver-haemorrhagic syndrome in the fowl. Research in Veterinary Science, 24, 72–76. doi: 10.1016/S0034-5288(18)33101-1
- Pearson, A.W. & Butler, E.J. (1978). Pathological and biochemical observations on subclinical cases of fatty liver-haemorrhagic syndrome in the fowl. Resarch in Veterinary Science, 24, 65–71. doi: 10.1016/S0034-5288(18)33100-X
- Pilo, B. & George, J.C. (1983). Diurnal and seasonal variations in liver glycogen and fat in relation to metabolic status of liver and m. pectoralis in the migratory starling. Sturnus roseus, wintering in India. Comparative Biochemistry & Physiology, Part A: Molecular & Integrative Physiology, 74, 601–604. doi: 10.1016/0300-9629(83)90554-6
- Radtke, S., Wuller, S., Yang, X.P., Lippok, B.E., Mutze, B., Mais, C., de Leur, H.S.-V., Bode, J.G., Gaestel, M., Heinrich, P.C., Behrmann, I., Schaper, F. & Hermanns, H.M. (2010). Cross-regulation of cytokine signalling: pro-inflammatory cytokines restrict IL-6 signalling through receptor internalisation and degradation. Journal of Cell Science, 123, 947–959. doi: 10.1242/jcs.065326
- Ramaiah, S.K. & Rose, R.E. (2010). 9.08 – Endotoxin-induced hepatotoxicity. In C.A. McQueen (Ed.), Comprehensive Toxicology (2nd ed., pp. 613–625). Oxford: Elsevier.
- Richards, M.P. & Proszkowiec-Weglarz, M. (2007). Mechanisms regulating feed intake, energy expenditure, and body weight in poultry. Poultry Science, 86, 1478–1490. doi: 10.1093/ps/86.7.1478
- Rorato, R., Borges, B.D.C., Uchoa, E.T., Antunes-Rodrigues, J., Elias, C.F. & Elias, L.L.K. (2017). LPS-induced low-grade inflammation increases hypothalamic JNK expression and causes central insulin resistance irrespective of body weight changes. International Journal of Molecular Sciences, 18, 1431. doi: 10.3390/ijms18071431
- Rozenboim, I., Mahato, J., Cohen, N.A. & Tirosh, O. (2016). Low protein and high-energy diet: a possible natural cause of fatty liver hemorrhagic syndrome in caged White Leghorn laying hens. Poultry Science, 95, 612–621. doi: 10.3382/ps/pev367
- Sakugawa, H., Nakayoshi, T., Kobashigawa, K., Nakasone, H., Kawakami, Y., Yamashiro, T., Maeshiro, T., Tomimori, K., Miyagi, S., Kinjo, F. & Saito, A. (2004). Metabolic syndrome is directly associated with gamma glutamyl transpeptidase elevation in Japanese women. World Journal of Gastroenterology, 10, 1052–1055. doi: 10.3748/wjg.v10.i7.1052
- SAS Institute Inc. (2001). SAS/STAT Guide for personal computers. Cary, NC USA.
- Schalm, O.W. (1980). Manual of feline and canine hematology. In P. Company (Ed.), Veterinary practice (p. 152). Santa Barbara, CA.
- Serhan, C.N. (2011). The resolution of inflammation: the devil in the flask and in the details. FASEB Journal, 25, 1441–1448. doi: 10.1096/fj.11-0502ufm
- Shini, A., Shini, S. & Bryden, W.L. (2019a). Fatty liver haemorrhagic syndrome occurrence in laying hens: impact of production system. Avian Pathology, 48, 25–34. doi: 10.1080/03079457.2018.1538550
- Shini, S., Shini, A. & Bryden, W.L. (2019b). Unravelling fatty liver haemorrhagic syndrome: 1. Oestrogen and inflammation. Avian Pathology, 49, 92–103.
- Shini, S., Shini, A. & Kaiser, P. (2010). Cytokine and chemokine gene expression profiles in heterophils from chickens treated with corticosterone. Stress, 13, 185–194. doi: 10.3109/10253890903144639
- Shini, S., Stewart, G., Shini, A. & Bryden, W. (2006). Mortality rates and causes of death in laying hens kept in cage and alternative housing systems. In D.G. Martin (Ed.), 12th European Poultry Conference (p. 601). Verona Italy: World Poultry Science Association.
- Simonsen, H.B. (1978). Battery-cages as the cause of environmental and behavioural dependent diseases (author's transl). Nordisk Veterinaermedicin, 30, 241–252.
- Ugarova, T.P. & Yakubenko, V.P. (2001). Recognition of fibrinogen by leukocyte integrins. The Annals of the New York Academy of Sciences, 936, 368–385. doi: 10.1111/j.1749-6632.2001.tb03523.x
- Valkonen, E., Venalainen, E., Rossow, L. & Valaja, J. (2008). Effects of dietary energy content on the performance of laying hens in furnished and conventional cages. Poultry Science, 87, 844–852. doi: 10.3382/ps.2007-00237
- Weitzenburger, D., Vits, A., Hamann, H. & Distl, O. (2005). Effect of furnished small group housing systems and furnished cages on mortality and causes of death in two layer strains. British Poultry Science, 46, 553–559. doi: 10.1080/00071660500303206
- Welte, M.A. (2015). Expanding roles for lipid droplets. Current Biology, 25, R470–R481. doi: 10.1016/j.cub.2015.04.004
- Wisse, B.E. (2004). The inflammatory syndrome: the role of adipose tissue cytokines in metabolic disorders linked to obesity. Journal of the American Society of Nephrology, 15, 2792–2800. doi: 10.1097/01.ASN.0000141966.69934.21
- Wolford, J.H. & Murphy, D. (1972). Effect of diet on fatty liver-hemorrhagic syndrome incidence in laying chickens. Poultry Science, 51, 2087–2094. doi: 10.3382/ps.0512087
- Yücel, G., Zhao, Z., El-Battrawy, I., Lan, H., Lang, S., Li, X., Buljubasic, F., Zimmermann, W.-H., Cyganek, L., Utikal, J., Ravens, U., Wieland, T., Borggrefe, M., Zhou, X.-B. & Akin, I. (2017). Lipopolysaccharides induced inflammatory responses and electrophysiological dysfunctions in human-induced pluripotent stem cell derived cardiomyocytes. Scientific Reports, 7, 2935. doi: 10.1038/s41598-017-03147-4
- Zwolak, A., Szuster-Ciesielska, A., Daniluk, J., Slabczynska, O. & Kandefer-Szerszen, M. (2015). Hyperreactivity of blood leukocytes in patients with NAFLD to ex vivo lipopolysaccharide treatment is modulated by metformin and phosphatidylcholine but not by alpha ketoglutarate. PLoS One, 10, 11–17. doi: 10.1371/journal.pone.0143851