
ABSTRACT
Despite the efforts to achieve a consistent classification scheme based on the complete S1 gene, the genetic characterization of infectious bronchitis virus (IBV) is often performed on partial S1 regions due to economic and time constraints in the diagnostic routine. Sanger sequencing remains the most common and cost-effective option even if the analysis of samples where multiple field and vaccine strain populations coexist can lead to partial or misleading results. The present study aimed to evaluate the different diagnostic outcomes of three commonly used RT–PCR methods targeting two regions of the S1 gene. A possible bias in IBV detection and characterization was investigated in relation to the adopted method, the strain concentration as well as their ratio in mixed samples. Thirty samples were prepared by artificially mixing two vaccine strains, combined at different ratios and selected among four different IBV lineages, i.e. GI-1 (Mass), GI-13 (793/B), GI-19 (QX), GI-23 (Israeli Variant 2). Sequence analysis was conducted both manually and with bioinformatic methods. The result agreement among methods, replicates and analysis approaches was statistically evaluated. Consistent results emerged among the three assays, with a few discrepancies likely caused by primer affinity and target amount. This study confirms the complexity of IBV strain identification and highlights the importance of evaluating and updating the available diagnostic assays for a reliable detection of all circulating IBV strains.
Introduction
Infectious bronchitis virus (IBV), classified within the avian coronavirus species, is the cause of infectious bronchitis (IB), which is still one of the most burdensome and frequent diseases in poultry, affecting both bird health and management costs (Jackwood et al., Citation2012). The clinical manifestations are generally characterized by respiratory signs, and a reduction in growth and egg-laying, and they are commonly controlled by biosecurity measures and vaccination (Jackwood & De Wit, Citation2020). To achieve the widest cross-protection levels, different vaccine strains have historically been associated and administered together (Cook et al., Citation1999; Terregino et al., Citation2008; Awad et al., Citation2016), at least in Europe, where Mass-based (GI-1) vaccines are commonly combined with either a 793/B-based (GI-13) vaccine or a vaccine based on locally circulating strains (Franzo et al., Citation2016) to provide homologous protection.
Nonetheless, this well-known strategy based on the association of different strains and/or multiple administrations (Jordan, Citation2017) presents some drawbacks other than the direct costs. Typically, IBV vaccines are attenuated and can replicate and persist for a long time in birds (Tucciarone et al., Citation2018). Since the induced immunity is not sterilizing, coinfection with field strains can occur, increasing the likelihood of recombination events (Jackwood, Citation2012). Moreover, it has been proven that some vaccines can persist at the population level as long as they are administered to the flocks (Franzo et al., Citation2014). Therefore, the simultaneous presence of several strains confuses both the epidemiological picture (Legnardi et al., Citation2019) and the diagnostic process.
The coinfection issue is particularly challenging considering that routine diagnostic assays are typically unable to identify more than one strain at the same time. The identification of multiple strains within one sample can be obtained only by screening with several genotype-specific molecular assays or by using deep sequencing techniques, the costs of which often make them unviable options for everyday use. For IBV characterization, routine diagnosis mainly relies on RT–PCR and Sanger sequencing, making the best of costs, rapidity and efficiency of the assays. However, no standardized protocol has been defined, and each laboratory adopts different assays in the attempt to keep up with local epidemiology, IBV evolution and technological progress (De Wit, Citation2000). In fact, due to the extreme genetic variability of IBV (Valastro et al., Citation2016), the selection of a single assay able to identify every strain appears impossible and requires the careful evaluation and update of current methods, accounting for the virus propensity to evolve rapidly, the local epidemiological situation and administered vaccines. While a relevant amount of information can still be achieved by RT–PCR followed by sequencing, this technique is not free from limitations, primarily the inability to identify minor viral subpopulations and coinfections, and can also be affected by possible flaws in the RT–PCR process, such as poor sensitivity and specificity.
In an attempt to evaluate the influence of the diagnostic method and operator interpretation on the diagnostic outcome, this study was designed to compare (both manually, and with a bioinformatic approach) the results of three common RT–PCR assays followed by Sanger sequencing, on artificially coinfected samples.
Materials and methods
Sample preparation, amplification and sequencing
Four common vaccines based on GI-1 (Mass), GI-13 (793/B), GI-19 (QX), and GI-23 (Israeli Variant 2) lineages were selected and RNA was extracted using High Pure Viral RNA Kit (Roche, Basel, Switzerland) following the manufacturer’s instructions.
Samples were tested with a real-time RT–PCR targeting the UTR region (Callison et al., Citation2006), and diluted in order to achieve a comparable initial concentration (CT value ∼18) for each vaccine. These were considered as starting samples (SD, starting dilution) for the artificial coinfection reproduction. Each SD was diluted again at 1:100 (−2) and 1:10,000 (−4) and mixed with another vaccine dilution, to produce 30 samples (Supplementary Table 1).
Samples were then amplified in triplicate with the following RT–PCR assays:
Method A, a one-step RT–PCR performed with primers XCE1+ and XCE2− (Cavanagh et al., Citation1999);
Method B, a two-step nested RT–PCR performed with primers SX1+ and SX2−, SX3+ and SX4− (Worthington et al., Citation2008);
Method C, a one-step RT–PCR performed with primers IBV260+ and IBV548− (Valastro et al., Citation2010).
Assay A was performed using the SuperScript™ III One-Step RT–PCR System with Platinum™ Taq DNA Polymerase kit (Invitrogen™, Waltham, MA, USA), assay C with the QIAGEN OneStep RT–PCR Kit (QIAGEN, Hilden, Germany), whereas the retrotranscription phase of assay B was performed separately with the High-Capacity cDNA Reverse Transcription Kit (Applied Biosystems™, Waltham, MA, USA) and the following PCRs were performed with the Platinum™ Taq DNA Polymerase Kit (Invitrogen, USA).
Products were visualized by capillary gel electrophoresis. Amplicons were Sanger sequenced in both directions with the same primers that were also used in the amplification. Chromatograms were both manually inspected and automatically analysed with bioinformatic means.
Operator-driven analysis and lineage classification
For the manual analysis, chromatograms were visually inspected for a preliminary quality check, and trimmed to remove the primer sequence using FinchTV software (Geospiza, Inc., Seattle, WA, US). Sequences were copied in FASTA format before and after the consensus assembly with ChromasPro 2.1.8 (Technelysium Pty Ltd, Brisbane, QLD, Australia). Consensus, forward and reverse sequences were aligned to the vaccine reference sequences, and a phylogenetic tree was reconstructed within assay to allow a comparison of the characterization outcome.
Read quality evaluation and automatic lineage classification
The operator-independent chromatogram analysis was performed in R using the sangeranalyseR library. Briefly, chromatograms were automatically trimmed in the regions with a Phred quality score lower than 20. Since coinfection can lead to double peaks, the occurrence of these events was annotated. A ratio of 0.2 of the height of the secondary peak to the primary peak was selected to differentiate random noise from actual sub-population presence.
A database was created including the following features for each chromatogram: raw read length, trimmed read length, mean raw read quality, mean trimmed read quality, number of secondary peaks in the raw and trimmed sequences. Additionally, composite measures were created describing the percentage of information lost after trimming compared to the expected read length. Similarly, the percentage of nucleotide positions with double peak evidence was calculated.
The effect of different methods, vaccine and dilution combination on mean trimmed quality, secondary peaks and percentage of information lost were statistically evaluated using a mixed linear model, accounting for the same samples being tested in multiple runs for different methods. All models were fitted using the nlme (Pinheiro et al., Citation2019) library in R 3.4.4, and the statistical significance of each model improvement over simpler ones was assessed by the likelihood-ratio test.
When forward and reverse chromatograms of adequate quality were available, the respective FASTA files were generated as well as consensus sequences. For each method, the obtained sequences were aligned with the respective references and a neighbor-joining phylogenetic tree based on the p-distance was reconstructed using MEGA X (Kumar et al., Citation2018) to classify them. The agreement between runs, methods, manual and automatic classification was assessed by calculating the Fleiss’ kappa (K) using the irr library in R. The statistical significance level was set to P-value < 0.05 for all mentioned tests.
Results
All 30 combinations tested positive by every RT–PCR method and run, and therefore a total of 270 amplicons was obtained and then Sanger sequenced.
Operator-driven analysis and lineage classification
Overall, 212 out of 270 (78.5%) forward, 209 reverse (77.4%) and 197 (72.9%) consensus sequences of adequate quality were obtained. In detail, 21, 26, 22 consensus sequences were assembled in the three runs for method A; 24, 24, 24 for method B; and 18, 18, 20 for method C (). Method B globally yielded the highest number of sequences and appeared the most reproducible method. Forward and reverse sequences were always concordant, although, in some cases, only the forward or reverse sequence was obtained, hence preventing the consensus assembly. Generally, samples with a low and similar amount of vaccines were sequenced with difficulty, especially with methods A and C, whereas method B seemed affected by a more prominent within-run variability (). A substantial agreement (K = 0.645; P-value < 0.001) was observed among methods and among runs, within the method, while the agreement among forward and reverse reads was almost perfect (K = 0.860).
Table 1. Summary of sample classification into lineages based on forward and reverse reads and consensus sequences obtained from the 270 amplicons.
Table 2. Summary of K values of agreement among methods, runs and sequencing direction within analytic approach (operator-driven and automatic genotype classification) and between the two analytic approaches (P-value < 0.001).
Read quality evaluation and automatic lineage classification
Overall, 192 out of 270 (71.1%) forward sequences, 190 (70.4%) reverse sequences, and 190 (70.4%) consensus sequences of adequate quality were obtained. In detail, 19, 23, 20 consensus sequences in the three runs for method A; 23, 24, 24 for method B; and 19, 16, 22 for method C were assembled ().
A moderate agreement (K = 0.410; P-value < 0.001) was observed among methods, although it was significantly depressed by the disagreement among N.S. reads. On the other hand, the agreement among runs within method was substantial (K = 0.68; P-value < 0.001), whereas the agreement among forward and reverse reads was almost perfect (K = 0.99; P-value < 0.001) ().
Finally, the overall agreement between operator-driven and automatic classification was almost perfect (K = 0.892; P-value < 0.001) ().
Additionally, the following features were selected to evaluate the effect of different experimental conditions on the read quality:
average Phred score after trimming;
% of information lost due to poor quality region trimming;
% of secondary peaks in the read after trimming.
Independently of the considered outcome, the effect of RT–PCR method, lineage and dilution combinations was proven to be statistically significant, as well as their interaction ().
Table 3. Summary of the statistical significance of independent variables (i.e. diagnostic method, vaccine and dilution combination) for the considered outcome of interest.
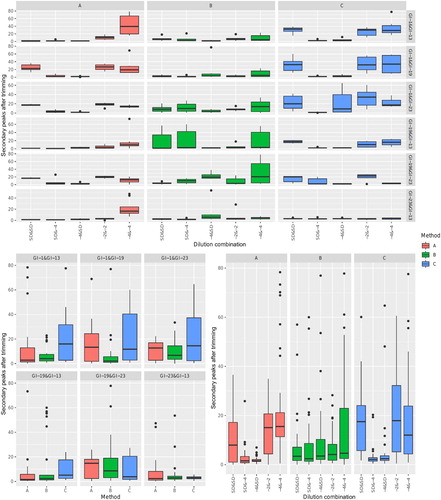
While the significant effect of so many independent variables makes a point by point dissertation challenging, some main trends can be identified. Independently of the method, the most challenging reads were obtained when both lineages were present at low viral titre ( and ). On the contrary, the combination of high and low viral titres for different lineages guaranteed the overall best performances. Besides, different methods revealed different performances depending on the tested lineage combination. The presence of double peaks appears more influenced by the ratio of the two lineages rather than the absolute titre. However, an effect of the particular combination of method and lineage was also clear in this case ().
Figure 1. Boxplot reporting the distribution of average read quality after automatic trimming. Different diagnostic methods have been colour-coded. In the upper figure, score values have been faceted based on both vaccine and dilution combination. The overall effect of vaccine combination or dilution has been reported in the lower left and right panels, respectively.
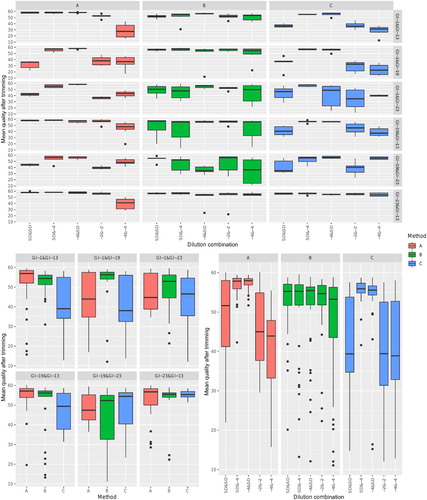
Figure 2. Boxplot reporting the distribution of percentage of information lost due to trimming. Different diagnostic methods have been colour-coded. In the upper figure, values have been faceted based on both vaccine and dilution combination. The overall effect of vaccine combination or dilution has been reported in the lower left and right panels, respectively.
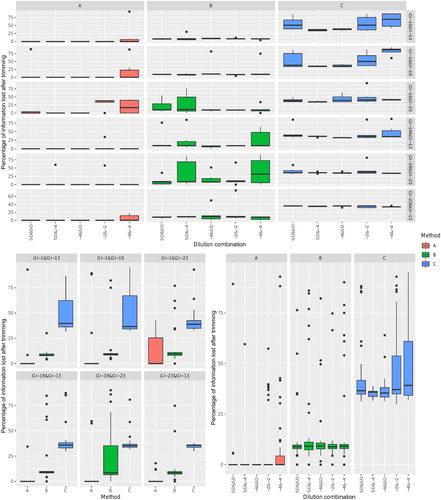
Figure 3. Boxplot reporting the distribution of the percentage of secondary peaks in the read after trimming. Different diagnostic methods have been colour-coded. In the upper figure, values have been faceted based on both vaccine and dilution combination. The overall effect of vaccine combination or dilution has been reported in the lower left and right panels, respectively.
Discussion
The present study systematically evaluated the effect of co-infection, at variable ratios, with different IBV lineages on commonly applied diagnostic assays, followed by Sanger sequencing, thus simulating a regular scenario of the everyday diagnostic process. For this reason, four vaccines were selected to represent the most frequently encountered genotypes in the routine diagnostic activity, at least in Europe. The use of vaccines rather than isolated field strains was necessary to ensure the presence of a single population in the specimen.
An undeniable impact of all tested variables on the chromatogram quality was observed (), thus leading to an extremely complex pattern and poor outcome predictability. Each method performed differently based on the combination of lineages involved and their ratio, as demonstrated by the statistical significance of interactions for all considered outcomes (i.e. read quality, information loss and double peak presence) (). Despite this, some general patterns could still be highlighted.
The presence of an equal template amount was definitely the most challenging scenario, leading to an average lower read quality and the presence of a higher percentage of double peaks, with the partial exception of method B (). A comparable template amount can, in fact, lead to a similar ratio of amplicons and comparable fluorescence during Sanger sequencing. The percentage of lost information was also affected (), since a more intensive trimming was requested in case of a similar template amount. However, this was particularly severe at the lowest dilutions, suggesting a limit of the RT–PCR process rather than sequencing. The lineage effect is likely due to the differential primer affinity, and the overall outcome was further magnified by the interaction between these factors (, ).
In addition to a decreasing sequence quality, sequence exclusion due to mixed templates also occurred, just as it can happen during the diagnostic activity when a confident characterization cannot be achieved. In this framework, the subjective evaluation of the operator could significantly discern if the reads can be retained or excluded, or affect the length of the trimmed regions, potentially leading to a different percentage of reads that were not sequencable (N.S. reads) or lineage classification. Even if understandable from a technical perspective, this last circumstance can cause misleading results, complicating the interpretation of the epidemiological scenario or leading to a decrease in clients’ trust. For this reason, the common operator-dependent approach was compared to an automatic approach, and the agreement between them was assessed, as well as the agreement among methods, runs and sequencing direction (i.e. forward or reverse).
The agreement among methods in lineage classification was substantial in most instances, although lower for the automatic approach. However, the main source of disagreement was represented by the N.S. reads, where a much higher variability was observed. This evidence was particularly clear for the automatic approach, where the presence of fixed cut-offs for exclusion led to the discordant exclusion of “borderline” reads. Conversely, a well-trained operator was able to preserve a higher number of reads and therefore of consensus sequences.
The inability to achieve a sequence can have serious implications under field conditions, including false-negative results if the diagnostic protocol requires sequencing confirmation, costs for sample retesting, or at least the lack of a proper classification of the detected strains (i.e. field/vaccine strain, lineage, historical or emerging/recently introduced strain), severely hampering our control capabilities.
Although much less marked, the imperfect agreement among methods in the final lineage outcome can also lead to misleading results. The primer affinity for different templates clearly plays a role in this sense. For example, the genotype detected with method A corresponded mainly to the most abundant strain in the sample, with the sole exception of one sample composed by low concentration of GI-19 (QX) and GI-23 (Israeli Variant 2) vaccines, which was identified as GI-19 (QX) in the first run and as GI-23 (Israeli Variant 2) in the second (data not shown). This inconsistency could come from the randomness in primer annealing when the target templates have a similar concentration and from the rapid excess of amplification of one strain over the other. With method B, the most frequently detected strain was GI-13 (793/B), reflecting a primer affinity that was probably intensified by the three-phased process (cDNA synthesis and double amplification). Remarkably, the GI-19 (QX) vaccine was never identified by this method. A more focused analysis highlighted that the primers of the first PCR round presented the highest number of mismatches with GI-19 (QX) lineage (up to five mismatches in the forward primers, up to six in the reverse primers) (data not shown), thus supporting the primer-affinity hypothesis. On the contrary, method C was particularly efficient in detecting GI-19 (QX), since this assay was expressly validated for this purpose (Valastro et al., Citation2010). Method C appeared heavily affected by the presence of multiple strains in the samples though, resulting in low-quality to unreadable sequences.
Even so, a generally high agreement was observed among different runs, suggesting that the final output is the result of a deterministic process, influenced by template concentration and primer affinity, rather than a stochastic one. Also in this case, the most common discrepancies were related to discarded reads. Unfortunately, the complexity of the observed patterns makes this process hardly predictable. Additionally, it must be stressed that the observed results were obtained with reference vaccine strains, leaving out the evaluation of how the within-lineage heterogeneity could affect primer affinity and the relative sequencing results. Finally, an almost perfect agreement was proven between forward and reverse reads, testifying that the strain classification is determined by RT–PCR reaction dynamics rather than sequencing dynamics.
Overall, the present study discloses how a standardized laboratory process could still influence the results when working on tricky samples. Although Sanger sequencing can give some hints of mixed populations, such as by the presence of a strong background signal or double peaks, the method itself is not suited for detecting more than one strain. Therefore, while an expert laboratory worker can inform field veterinarians of such evidence, further insights into the actual coinfection composition are prevented. Neither the automatic nor the operator-driven approach was able to effectively deal with the presence of coinfections in the achievement of a confident characterization, which was significantly determined by the selected diagnostic method. Human operators are generally able to more efficiently retain and interpret poor quality sequences, which are typically excluded by automatic approaches. While this could represent an economical and practical advantage for the veterinarians in everyday diagnostic activity, the effect of such subjective, operator-based, sequence evaluation should be carefully evaluated and accounted for when more precise epidemiological studies are the final target.
It cannot be underemphasized that, although some “general” rules were identified in the specific cases, the complexity of the interactions among the considered variables, including specific lineage pairs and their concentration, prevents any inference or prevision on the method performances in unknown field samples. Additionally, the experimental conditions poorly represent the field conditions, where samples are frequently coinfected but rarely contain equally concentrated strains, further complicating the diagnostic scenario.
Even if the evaluation of the different outcome and possible determinants of this variability aimed to assist in the choice of the diagnostic assay, a decisive answer is impossible to obtain and different assays exhibited pros and cons. The variability of the target region, the primer design and assay update including the emerging strains are only a few of the elements that can influence the performances of the diagnostic process.
The choice of the diagnostic assay should be based on the specific diagnostic purpose and consider all available elements indicating the presence of multiple strains, such as recent vaccination, clinical symptoms and epidemiological data. Information about the vaccination protocol could facilitate the interpretation of the results or suggest the use of a strain-specific assay to specifically detect, in light of a particular clinical suspicion, the most likely field strain rather than a co-infecting vaccine one. Otherwise, in complete absence of indications, the least biased assay should be preferred, aiming to identify the prevalent strain, still acknowledging the possibility of other undetected strains, and being aware of potentially misleading results, the occurrence of which is largely unpredictable a priori.
Based on these considerations, a diagnostic algorithm combining several assays with different designs and features, should be developed to process difficult samples and assist in the achievement of a truthful characterization of the strain composition of the samples.
Supplemental Material
Download MS Word (16.8 KB)Disclosure statement
No potential conflict of interest was reported by the authors.
References
- Awad, F., Hutton, S., Forrester, A., Baylis, M. & Ganapathy, K. (2016). Heterologous live infectious bronchitis virus vaccination in day-old commercial broiler chicks: clinical signs, ciliary health, immune responses and protection against variant infectious bronchitis viruses. Avian Pathology, 45, 169–177.
- Callison, S.A., Hilt, D.A., Boynton, T.O., Sample, B.F., Robison, R., Swayne, D.E. & Jackwood, M.W. (2006). Development and evaluation of a real-time Taqman RT-PCR assay for the detection of infectious bronchitis virus from infected chickens. Journal of Virological Methods, 138, 60–65.
- Cavanagh, D., Mawditt, K., Britton, P. & Naylor, C.J. (1999). Longitudinal field studies of infectious bronchitis virus and avian pneumovirus in broilers using type-specific polymerase chain reactions. Avian Pathology, 28, 593–605.
- Cook, J.K.A., Orbell, S.J., Woods, M.A. & Huggins, M.B. (1999). Breadth of protection of the respiratory tract provided by different live-attenuated infectious bronchitis vaccines against challenge with infectious bronchitis viruses of heterologous serotypes. Avian Pathology, 28, 477–485.
- De Wit, J.J. (2000). Detection of infectious bronchitis virus. Avian Pathology, 29, 71–93.
- Franzo, G., Naylor, C.J., Lupini, C., Drigo, M., Catelli, E., Listorti, V., Pesente, P., Giovanardi, D., Morandini, E. & Cecchinato, M. (2014). Continued use of IBV 793B vaccine needs reassessment after its withdrawal led to the genotype’s disappearance. Vaccine, 32, 6765–6767.
- Franzo, G., Tucciarone, C.M., Blanco, A., Nofrarías, M., Biarnés, M., Cortey, M., Majó, N., Catelli, E. & Cecchinato, M. (2016). Effect of different vaccination strategies on IBV QX population dynamics and clinical outbreaks. Vaccine, 34, 5670–5676.
- Jackwood, M.W. (2012). Review of infectious bronchitis virus around the world. Avian Diseases, 56, 634–641.
- Jackwood, M.W. & De Wit, S. (2020). Infectious bronchitis. In David E. Swayne, Martine Boulianne, Catherine M. Logue, Larry R. McDougald, Venugopal Nair, David L. Suarez, Sjaak de Wit, Tom Grimes, Deirdre Johnson, Michelle Kromm, Teguh Yodiantara Prajitno, Ian Rubinoff & Guillermo Zavala (Eds.). Diseases of Poultry, 14th edn (pp. 167–188). Hoboken, NJ: Wiley.
- Jackwood, M.W., Hall, D. & Handel, A. (2012). Molecular evolution and emergence of avian gammacoronaviruses. Infection, Genetics and Evolution, 6, 1305–1311.
- Jordan, B. (2017). Vaccination against infectious bronchitis virus: a continuous challenge. Veterinary Microbiology, 206, 137–143.
- Kumar, S., Stecher, G., Li, M., Knyaz, C. & Tamura, K. (2018). MEGA x: molecular evolutionary genetics analysis across computing platforms. Molecular Biology and Evolution, 35, 1547–1549.
- Legnardi, M., Franzo, G., Koutoulis, K.C., Wiśniewski, M., Catelli, E., Tucciarone, C.M. & Cecchinato, M. (2019). Vaccine or field strains: the jigsaw pattern of infectious bronchitis virus molecular epidemiology in Poland. Poultry Science, 98, 6388–6392.
- Pinheiro, J., Bates, D., DebRoy, S., Sarkar, D. & Team, R.C. (2019). Nlme: linear and nonlinear mixed effects models. R Package, 3, 1–117.
- Terregino, C., Toffan, A., Serena Beato, M., De Nardi, R., Vascellari, M., Meini, A., Ortali, G., Mancin, M. & Capua, I. (2008). Pathogenicity of a QX strain of infectious bronchitis virus in specific pathogen free and commercial broiler chickens, and evaluation of protection induced by a vaccination programme based on the Ma5 and 4/91 serotypes. Avian Pathology, 37, 487–493.
- Tucciarone, C.M., Franzo, G., Berto, G., Drigo, M., Ramon, G., Koutoulis, K.C., Catelli, E. & Cecchinato, M. (2018). Evaluation of 793/B-like and mass-like vaccine strain kinetics in experimental and field conditions by real-time RT-PCR quantification. Poultry Science, 97, 303–312.
- Valastro, V., Holmes, E.C., Britton, P., Fusaro, A., Jackwood, M.W., Cattoli, G. & Monne, I. (2016). S1 gene-based phylogeny of infectious bronchitis virus: an attempt to harmonize virus classification. Infection, Genetics and Evolution, 39, 349–364.
- Valastro, V., Monne, I., Fasolato, M., Cecchettin, K., Parker, D., Terregino, C. & Cattoli, G. (2010). QX-type infectious bronchitis virus in commercial flocks in the UK. Veterinary Record, 167, 865–866.
- Worthington, K.J., Currie, R.J.W. & Jones, R.C. (2008). A reverse transcriptase-polymerase chain reaction survey of infectious bronchitis virus genotypes in Western Europe from 2002 to 2006. Avian Pathology, 37, 247–257.