
ABSTRACT
Keel bone fractures are a serious animal welfare problem in laying hens. The aim of the current study was to assess the influence of egg production, oestradiol-17ß, and selection for high laying performance on bone quality. Hens of two layer lines differing in laying performance (WLA: 320 eggs per year, G11: 200 eggs per year) were allocated to four treatment groups. Group S received a deslorelin acetate implant that suppressed egg production. Group E received an implant with the sexual steroid oestradiol-17ß. Group SE received both implants and group C did not receive any implant. In the 63rd week of age, composition and characteristics of the tibiotarsi were assessed using histological analysis, three-point bending test, thermogravimetric analysis, infrared spectroscopy, and two-dimensional X-ray diffraction, respectively. Non-egg-laying hens showed a higher total bone area and a higher relative amount of cortical bone compared to egg-laying hens. Hens of layer line G11 showed a higher relative amount of medullary bone and a higher degree of mineralization of the cortical bone compared to hens of layer line WLA. These differences in bone composition may explain different susceptibility to keel bone fractures in non-egg-laying compared to egg-laying hens as well as in hens of layer lines differing in laying performance. The effect of exogenous oestradiol-17ß on bone parameters varied between the layer lines indicating a genetic influence on bone physiology and the way it can be modulated by hormone substitution.
Introduction
The prevalence of keel bone damage in laying hens is very high and it is considered to be one of the main animal welfare problems in the egg production industry (EFSA, Citation2005; FAWC, Citation2010, Citation2013). The keel bone is subject to fractures in up to 97% of hens within one flock (Rodenburg et al., Citation2008; Wilkins et al., Citation2011; Richards et al., Citation2012; Petrik et al., Citation2015; Heerkens et al., Citation2016) and to deviations in up to 83% of hens within one flock (Fleming et al., Citation2004; Käppeli et al., Citation2011). In addition to negatively influencing animal welfare, keel bone fractures also have negative economic implications to the producers due to reduced egg production and higher food and water intake in affected hens (Nasr et al., Citation2012; Nasr et al., Citation2013).
There is evidence that egg production and the selection for high laying performance may be an underlying cause of keel bone fractures. Hens in which egg production was suppressed by administering an implant with the GnRH agonist deslorelin acetate showed a markedly decreased risk of keel bone fractures compared to egg-laying control hens (Eusemann, Sharifi et al., Citation2018; Eusemann et al., Citation2020). Furthermore, a recent study found a very low prevalence of keel bone fractures in the red junglefowl, the ancestor of the domestic chicken that has not been selected for egg production (Kittelsen et al., Citation2020). Several researchers also found differences in bone characteristics and fracture risk in layer lines differing in laying performance. Layer lines with a high laying performance showed an increased prevalence of keel bone fractures and a lower breaking strength of the tibiotarsus compared to moderately performing layer lines (Habig et al., Citation2017; Eusemann, Baulain et al., Citation2018; Eusemann et al., Citation2020). Similarly, the risk of experimental keel bone fractures was found to be lower in an experimental layer line descended from a dam line which had not been selected for any breeding goal for several years and a sire line which had been bred for dual egg and meat production, compared to layer lines that had been selected for high laying performance (Candelotto et al., Citation2017). In addition, a higher breaking strength of humeri and tibiotarsi were found in traditional breeds with a comparatively low laying performance compared to commercial breeds with a high laying performance (Hocking et al., Citation2003).
Another factor that may influence bone characteristics is the gonadal steroid oestradiol. Some authors suggest that the rise in oestrogen plasma concentration at the onset of lay stimulates the osteoblasts to form medullary rather than structural bone, which leads to depression in structural bone formation, and osteoporosis (Miller & Bowman, Citation1981; Whitehead & Fleming, Citation2000). Accordingly, reduced bone strength was found in laying hens as well as roosters and capons treated with exogenous oestradiol compared to their untreated counterparts (Urist & Deutsch, Citation1960; Chen et al., Citation2014). In our own previous study, a moderately higher risk of keel bone fracture was found in egg-laying hens treated with exogenous oestradiol-17ß compared to untreated control hens. However, non-egg-laying hens that received exogenous oestradiol-17ß showed a lower risk of keel bone fracture when compared to non-egg-laying hens without oestradiol-17ß supplementation (Eusemann et al., Citation2020). This indicates that the effect of oestradiol-17ß on bone physiology is dependent on the reproductive state of the hen (Eusemann et al., Citation2020).
Little is known about the mechanisms behind the differences in bone strength and keel bone fracture risk between different layer lines, egg-laying and non-egg-laying hens as well as hens treated with exogenous oestradiol-17ß and untreated hens. In general, bone strength is determined by total bone mass, mineral content as well as the geometrical distribution of bone and its structural organization at different scales (Weiner & Wagner, Citation1998; Fratzl et al., Citation2004; Gupta et al., Citation2006, Zimmermann et al., Citation2011; Rodriguez-Navarro et al., Citation2018). In a previous study, non-egg-laying hens showed a higher radiographic density of the keel bone compared to egg-laying hens (Eusemann et al., Citation2020). Furthermore, in a study by Hocking et al. (Citation2003), radiographic density of keel bones and tibiotarsi was higher in traditional breeds with a comparatively low laying performance compared to commercial breeds with a high laying performance. In addition, a higher bone mineral density of the tibiotarsus was found in moderately performing layer lines compared to layer lines with a high laying performance (Habig et al., Citation2017). These findings indicate that there are differences in bone mass and / or degree of mineralization between egg-laying and non-egg-laying hens as well as between layer lines differing in laying performance. However, to assess the exact differences between the bones of different treatment groups or layer lines, more specific methods are required.
The aim of this study was to examine the influence of egg production, layer line, and exogenous oestradiol-17ß on bone strength, bone structure, and chemical composition of long bones in hens. We hypothesized that bone strength, amount of cortical bone, degree of mineralization, and degree of bone maturity would be higher in non-egg-laying compared to egg-laying hens. Furthermore, we hypothesized that the same differences would exist between hens of a moderately performing line compared to a high performing layer line. Concerning exogenous oestradiol-17ß, we hypothesized that within egg-laying hens, hens treated with oestradiol-17ß would show a lower breaking strength, lower amount of cortical bone, lower degree of mineralization, and a lower degree of bone maturity compared to untreated control hens. However, we hypothesized that within non-egg-laying hens, those treated with exogenous oestradiol-17ß would show a higher breaking strength, higher amount of cortical bone, higher degree of mineralization, and a higher degree of bone maturity compared to hens without oestradiol-17ß supplementation.
Materials and methods
Birds and housing conditions
The current experiment was performed in accordance with the German Animal Protection Law and approved by the Lower Saxony State Office for Consumer Protection and Food Safety (No. 33.19-42502-04-15/1966).
Hens that were examined in the present study were identical to those used by Eusemann et al., (Citation2020) and details on housing conditions and treatment can be found there. In short, we examined two different pure-bred lines of laying hens (Gallus gallus domesticus) which are both closely related but differ in laying performance. Layer line WLA originates from a breeding line of Lohmann Tierzucht GmbH, Cuxhaven, Germany selected for laying performance. The line has been maintained without selection since 2012 at the Friedrich-Loeffler-Institut, Institute of Farm Animal Genetics, Mariensee, Germany. Hens of this line lay around 320 eggs per year. The other line, G11, kept at the same institute since 1965 as a conservation flock, is a moderately performing layer line with an average laying performance of 200 eggs per year. Laying maturity, defined as age at the first egg laid, is reached in the 20th week of age in WLA and in the 24th week of age in G11 (Lieboldt et al., Citation2015).
All chicks (WLA: n = 256, G11: n = 235) were hatched on the same day and the birds were raised in a floor housing system in separate rearing compartments of 23 m2 each. These were littered with wood-shavings and straw, and perches were provided from the 4th week of age onwards. A standard light programme was applied throughout the rearing period and a conventional complete feed for chicks (until 7 weeks of age; 12.97 MJ AMEn/kg DM, 189.61 g/kg crude protein, 31.38 g/kg crude fat, 9.14 g/kg Ca, 6.94 g/kg P) and pullets (from 8 to 19 weeks of age; 12.82 MJ AMEn/kg DM, 151.67 g/kg crude protein, 30.21 g/kg crude fat, 15.83 g/kg Ca, 8.11 g/kg P) as well as water were offered ad libitum.
At 11 weeks of age, 100 pullets per layer line were relocated to the experimental site where they were kept for the remainder of the experiment. There were two pens per layer line resulting in 50 hens per pen. All four pens were located in the same poultry house and were identical: each pen measured 11 m2, was littered with wood-shavings and straw and provided with perches and a nest box. Duration of the light period increased gradually from 10 h/d (until the 18th week of age) to 14 h/d (from the 24th week of age onwards). All laying hens were fed ad libitum on a conventional laying hen diet (11.68 MJ AMEn/kg DM, 168.11 g/kg crude protein, 29.43 g/kg crude fat, 50.05 g/kg Ca, 5.06 g/kg P) and had ad libitum access to water.
Treatment
As mentioned above, the hens of the present study were identical to those used by Eusemann et al., (Citation2020) and details of treatment can be found there. In short, there were four different treatment groups per layer line which were equally allocated to the pens: 38 hens per layer line were administered a sustained release implant containing 4.7 mg of the gonadotropin-releasing hormone (GnRH) agonist deslorelin acetate (Suprelorin®, Virbac, Carros, France), which has been shown to inhibit egg production (Eusemann, Sharifi et al., Citation2018) (group S). Twelve hens per layer line were administered a sustained release implant which contains 75 mg of the gonadal steroid oestradiol-17ß (Innovative Research of America, Sarasota, FL, USA) (group E). 12 hens per layer line were administered both implants (group SE) and, thus, did not lay eggs but showed oestradiol-17ß plasma concentrations that were comparable to egg-laying control hens (Eusemann et al., Citation2020). Lastly, 38 hens per layer line were kept as control hens and did not receive any implant (group C). All implants were administered subcutaneously and hens were anaesthetized with 2–3% isoflurane (CP-Pharma Handelsgesellschaft mbH, Burgdorf, Germany) in compressed air with a flow rate of 500 ml/min delivered via face mask during administration. The first implant was given shortly after the onset of lay. Thus, WLA received the first implant in the 25th week of age, and G11 in the 27th week of age. Administration was then repeated every 90 days.
Dissection and bone morphology
A subgroup of hens was euthanized in their 63rd week of age and their tibiotarsi were used for the present study.
The right tibiotarsus of 49 hens (layer line G11: seven C, five E, seven S, four SE; layer line WLA: six C, seven E, six S, seven SE) was stored in 4% neutral buffered formaldehyde for histological analysis. The left tibiotarsus of 131 hens (layer line G11: 24 C, five E, 27 S, four SE; layer line WLA: 24 C, eight E, 28 S, 10 SE) was stored at −20° C without chemical fixatives for the analyses of bone morphology, bone strength, and chemical composition. The morphological characteristic bone length was measured using a caliper. Afterwards, the tibiotarsus was weighed. Bone weight was then set in relation to body weight and is given as relative bone weight in per cent.
Histology
Tissue preparation
A piece of 1.5 cm in length was cut from the midshaft of the diaphysis and decalcified for six weeks in buffered ethylene-diamine tetra acetic acid (EDTA). EDTA was changed twice per week. After decalcification, the bone piece was washed with tap water for 24 h, dehydrated, and embedded in paraffin wax. Sections were cut at 5 µm and mounted on a slide covered with poly-l-lysine (Thermo Fisher Scientific Inc., Waltham, MA, USA). Finally, each slice was stained with haematoxylin and eosin (H&E).
Analysis of the slices
H&E-stained slices were digitized using an Aperio CS2 slide scanner equipped with a 20x Plan Apo objective (Leica Mikrosyteme Vertrieb GmbH, Wetzlar, Germany). Halo imaging software (Indica Labs, Albuquerque, NM, USA) was used to assess the digital slices as follows. The cross section of the tibiotarsus was manually traced and defined as region of interest (ROI). A classifier was created in order to distinguish (i) cortical bone, (ii) medullary bone, and (iii) bone marrow. The training set consisted of the tibiotarsi of two randomly selected chickens per group and each tissue type was predefined in five different locations per slice. Afterwards, the identical classifier was used to measure the area of each tissue type in all chickens. The absolute areas (mm2) were converted to relative areas by division by the total tibiotarsal cross-sectional area.
Bone strength measurement
Biomechanical properties of the tibiotarsi were determined by a three-point bending test using a material testing machine (Instron 3345, Instron Co., Canton, MA, USA) with a load of 500 N at 1 mm/min. Two values were given for breaking strength: absolute breaking strength (N) and breaking strength corrected per bone area (MPa).
Analysis of the chemical composition
For all analyses of the chemical composition, bone marrow and medullary bone were separated from cortical bone by scratching them out with a scalpel, and analyses were performed separately for cortical bone on the one hand and bone marrow together with medullary bone, if present, on the other hand. Bone marrow and medullary bone are summarized as medullary cavity throughout the manuscript. The analyses of the chemical composition are summarized hereafter and described in more detail elsewhere (Rodriguez-Navarro et al., Citation2018).
Thermogravimetric analysis
The percentage of water, organic matter, carbonate and phosphate was determined by thermogravimetry (TGA) in cortical bone and medullary cavity samples using a minimum of 25 mg of powdered cortical bone or medullary cavity samples, respectively. Samples were recovered at temperatures of 200°C, 600°C, and 900°C and weighed. From the weight loss from each temperature interval, the water, organic matter, carbonate, and phosphate content in bone were determined.
Infrared spectroscopy
The chemical composition of powdered bone tissue (cortical bone) and medullary cavity were analyzed by Fourier-transform infrared spectroscopy (FTIR) with a spectrometer JASCO 6200 equipped with a diamond attenuated total reflectance (ATR) accessory (ATR Pro ONE, JASCO, Japan). The infrared spectra were recorded at a 2 cm−1 resolution over 32 scans. From the peak areas, the following compositional parameters were determined to define bone material properties:
In cortical bone, the relative amount of mineral to organic matrix (PO4/Amide I) determined as the ratio between the main phosphate (v1, v3 PO4; 900–1200 cm−1) and Amide I (1590–1710cm−1) band area. In medullary cavity, the relative amount of mineral to organic matrix was determined as the ratio between the main carbonate (CO3_1415) and Amide I band area.
The amount of carbonate substituted in the mineral as the ratio of the v2 CO3 (850–890 cm−1) to the v3 CO3 (1390–1440 cm−1) band area.
Two-dimensional X-ray diffraction
A piece of cortical bone (about 1 × 1 cm) was cut from the midshaft of the diaphysis and analyzed in transmission mode with an X-ray single crystal diffractometer (D8 Venture, Bruker, MA, USA) equipped with a PHOTON area detector and Mo radiation. Crystallinity of bone mineral was determined by measuring the full width at half maximum (FWHM) of the main apatite peaks (e.g. 002, 211, 310) displayed in 2Theta scan. A quantitative estimation of the degree of alignment of the c-axis of apatite crystals in the cortical bone (order parameter) was determined from the angular breadth of bands displayed in the intensity profile along the Debye-Scherrer ring associated with the 002 reflection of apatite mineral (002 Gamma scan; Rodriguez-Navarro et al., Citation2018).
Statistical analysis
Statistical analysis was performed in R 3.5.2 (R Core Team R: A Language and Environment for Statistical Computing. Vienna: R Foundation for Statistical Computing. (2018). Available online at: https://www.R-project.org/). Linear models using generalized least squares were used to evaluate all outcome variables with the gls method from the nlme package (Pinheiro et al., Citation2018). In each of these models, layer line (factor with two levels: G11 and WLA), treatment (factor with four levels: C, E, S, and SE), and their two-way interaction were included as fixed effects. To avoid multiple hypothesis testing, no model simplification was performed (Forstmeier & Schielzeth, Citation2011). Significant P-values for the fixed effects were obtained from the examination of the full model and the test statistic for the full model is presented for each outcome variable in the text of the results section and in tables. All model assumptions were verified using graphical analysis of residuals. When an outcome variable was found to be significantly influenced by treatment group or the two-way interaction between treatment group and layer line, post-hoc tests were performed using the Scheffé method to analyze which specific groups significantly differed from each other. Results of the post-hoc tests are presented in the text and in the figures, where different letters indicate a significant difference (P < 0.05) between specific groups.
Results
The underlying raw data can be found in the supplementary material. Supplementary material 1 refers to the histological analyses and Supplementary material 2 refers to bone morphology, bone strength, and the analysis of the chemical composition.
Histology
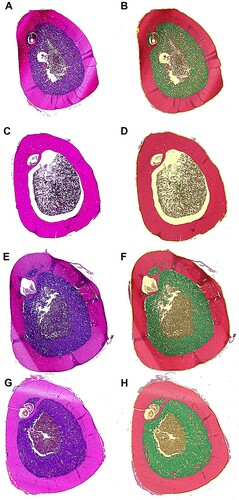
Representative slices of the tibiotarsus of all four treatment groups are shown in .
Figure 1. Representative slices of the tibiotarsus of all treatment groups. (A + B) layer line G11, control hen (group C), (C + D) layer line G11, hen treated with deslorelin acetate (group S), (E + F) layer line G11, hen treated with oestradiol-17ß (group E), (G + H) layer line G11, hen treated with deslorelin acetate and oestradiol-17ß (group SE). Left side: histopathologic slices, (H & E) staining; right side: pseudocoloured images after processing with halo imaging software, red: cortical bone, green: medullary bone, brown: bone marrow.
The total area of the analysed slice of the tibiotarsus (mm2) was significantly influenced by treatment (F3,41 = 5.91, P = 0.0019; (a), ): post-hoc analysis revealed that the total area was significantly larger in groups S and SE compared to group C (P < 0.05). In addition, the total area of the analysed slice of the tibiotarsus (mm2) tended to be larger in layer line WLA compared to layer line G11 (layer line: F1,41 = 3.74, P = 0.0599; (b), ).
Figure 2. Histological analyses I. Each boxplot represents the median, first and third quartile, and minimum and maximum of (a) the total area of the histological slice of the tibiotarsus (mm2) of each treatment group; (b) the total area of the histological slice of the tibiotarsus (mm2) of each layer line; (c) the relative area of cortical bone (%) within the tibiotarsus of each treatment group. Boxplots with different letters are significantly different (P < 0.05). The black lines represent the model estimates. Numbers of hens that were included in the analysis are given under each boxplot. C: control hens (egg-laying), E: hens treated with oestradiol-17ß (egg-laying), S: hens treated with deslorelin acetate (non-egg-laying), SE: hens treated with deslorelin acetate and oestradiol-17ß (non-egg-laying); G11: low performing layer line, WLA: high performing layer line.
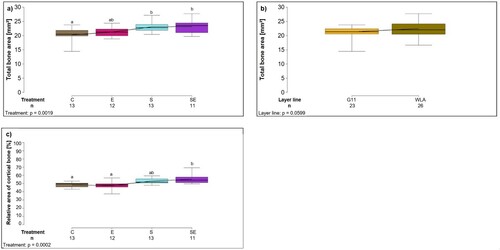
Table 1. Model results (numDF, F-value, P-value) for the fixed effects treatment group, layer line, and their two-way interaction of the histological parameters total bone area, relative area of cortical bone, relative area of medullary bone, and relative area of bone marrow.
The relative area of cortical bone was significantly influenced by treatment (F3,41 = 8.57, P = 0.0002; (c), ): post-hoc analysis revealed that relative area of cortical bone was significantly larger in group SE compared to groups C and E (P < 0.05) and tended to be larger in group S compared to groups C and E (P < 0.1). In contrast, the relative area of cortical bone did not significantly differ between the layer lines (F1,41 = 0.002, P = 0.9677; ).
The relative area of medullary bone was significantly influenced by treatment (F3,41 = 15.68, P < 0.0001; (a), ): post-hoc analysis revealed that relative area of medullary bone was significantly larger in groups C, E, and SE compared to group S (P < 0.05). In addition, relative area of medullary bone was significantly larger in layer line G11 compared to layer line WLA (layer line: F1,41 = 4.93, P = 0.032; (b), ).
Figure 3. Histological analyses II. Each boxplot represents the median, first and third quartile, and minimum and maximum of (a) the relative area of medullary bone (%) within the tibiotarsus of each treatment group; (b) the relative area of medullary bone (%) within the tibiotarsus of each layer line; (c) the relative area of bone marrow (%) within the tibiotarsus of each treatment group within each layer line. Boxplots with different letters are significantly different (P < 0.05). The black lines represent the model estimates. Numbers of hens that were included in the analysis are given under each boxplot. C: control hens (egg-laying), E: hens treated with oestradiol-17ß (egg-laying), S: hens treated with deslorelin acetate (non-egg-laying), SE: hens treated with deslorelin acetate and oestradiol-17ß (non-egg-laying); G11: low performing layer line, WLA: high performing layer line.
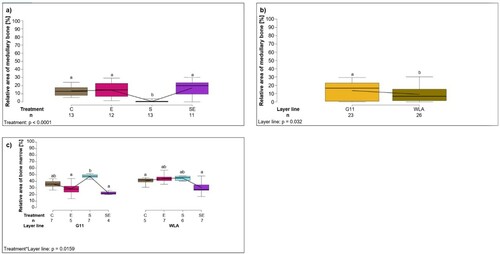
The relative area of bone marrow was significantly influenced by the two-way interaction between treatment and layer line (treatment*layer line: F3,41 = 3.87, P = 0.0159; (c), ): within layer line G11, the relative area of bone marrow was significantly larger in group S compared to groups E and SE (P < 0.05). Within layer line WLA, the relative area of bone marrow tended to be smaller in group SE compared to groups E and S (P < 0.1). In addition, the relative area of bone marrow tended to be larger in layer line WLA compared to layer line G11 within group E (P < 0.1).
Bone morphology
The length of the tibiotarsus was significantly influenced by the two-way interaction between treatment and layer line (treatment*layer line: F3,122 = 4.53, P = 0.0048; (a), ): the tibiotarsus was significantly longer in groups C, S, and SE of layer line WLA compared to group E of layer line WLA (P < 0.05) and compared to all treatment groups of layer line G11 (P < 0.05). In contrast, the length of the tibiotarsus did not differ between treatment groups within layer line G11 (P > 0.05).
Figure 4. Bone morphology. Each boxplot represents the median, first and third quartile, and minimum and maximum of (a) the length of the tibiotarsus (cm) of each treatment group within each layer line; (b) the relative weight (%) of the tibiotarsus of each treatment group within each layer line. Boxplots with different letters are significantly different (P < 0.05). The black lines represent the model estimates. Numbers of hens that were included in the analysis are given under each boxplot. C: control hens (egg-laying), E: hens treated with oestradiol-17ß (egg-laying), S: hens treated with deslorelin acetate (non-egg-laying), SE: hens treated with deslorelin acetate and oestradiol-17ß (non-egg-laying); G11: low performing layer line, WLA: high performing layer line.
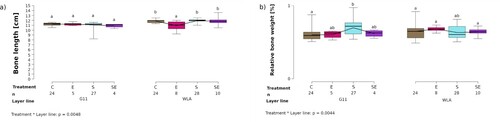
Table 2. Model results (numDF, F-value, P-value) for the fixed effects treatment group, layer line, and their two-way interaction of the morphological parameters bone length and relative bone weight.
Relative bone weight was significantly influenced by the two-way interaction between treatment and layer line (treatment*layer line: F3,122 = 4.59, P = 0.0044; (b), ): the relative bone weight was significantly higher in treatment group S compared to group C within layer line G11 (P < 0.05) while there was no significant difference in relative bone weight between treatment groups within layer line WLA (P > 0.05) or between the layer lines (P > 0.05).
Bone strength measurement
Absolute bone breaking strength was significantly influenced by the two-way interaction between treatment and layer line (treatment*layer line: F3,121 = 13.43, P < 0.0001; (a), ): Within layer line G11, absolute bone breaking strength was significantly higher in group SE compared to groups C and S (P < 0.05). Within layer line WLA, absolute bone breaking strength was significantly higher in group S compared to group C (P < 0.05). Furthermore, absolute bone breaking strength was significantly higher in layer line WLA compared to G11 within treatment group S (P < 0.05) while the layer lines did not significantly differ within the other treatment groups (P > 0.05).
Figure 5. Bone strength. Each boxplot represents the median, first and third quartile, and minimum and maximum of (a) the total bone breaking strength (N) of each treatment group within each layer line; (b) the bone breaking strength corrected for bone area (MPa) of each treatment group; (c) the bone breaking strength corrected for bone area (MPa) of each layer line. Boxplots with different letters are significantly different (P < 0.05). The black lines represent the model estimates. Numbers of hens that were included in the analysis are given under each boxplot. C: control hens (egg-laying), E: hens treated with oestradiol-17ß (egg-laying), S: hens treated with deslorelin acetate (non-egg-laying), SE: hens treated with deslorelin acetate and oestradiol-17ß (non-egg-laying); G11: low performing layer line, WLA: high performing layer line.
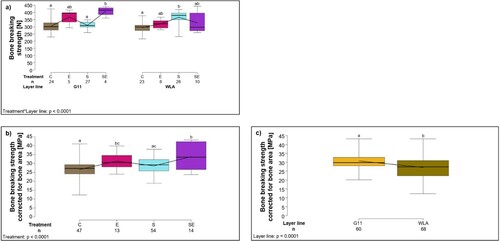
Table 3. Model results (numDF, F-value, P-value) for the fixed effects treatment group, layer line, and their two-way interaction of the mechanical parameters absolute bone breaking strength and bone breaking strength corrected per area.
When corrected for bone area, bone breaking strength was significantly influenced by treatment (F3,120 = 10.85, P < 0.0001; (b), ): post-hoc analysis revealed that breaking strength corrected for bone area was significantly lower in group C compared to groups E and SE (P < 0.05) and significantly lower in group S compared to group SE (P < 0.05). Furthermore, breaking strength corrected for bone area was significantly higher in layer line G11 compared to WLA (layer line: F1,120 = 16.53, P = 0.0001; (c), ).
Analysis of the chemical composition
Thermogravimetric analysis
Cortical bone
In cortical bone, the amount of minerals (carbonates + phosphates) was significantly higher in G11 compared to WLA (F1,121 = 37.18, P < 0.0001; (a), ) while there was no significant difference between the treatment groups (F3,121 = 1.87, P = 0.1389, ). The ratio between phosphates and organic matter, i.e. the degree of mineralization of the cortical bone, did not significantly differ between the layer lines (F1,122 = 0.008, P = 0.9298, ). Although this ratio was significantly influenced by treatment in the model (treatment: F3,122 = 3.04, P = 0.0318; (b), ) with group S showing the lowest and group SE the highest value, the post-hoc tests did not reveal any significant differences between specific treatment groups.
Figure 6. Thermogravimetric analysis of the cortical bone. Each boxplot represents the median, first and third quartile, and minimum and maximum of (a) the amount of minerals in cortical bone (%) of each layer line; (b) the ratio between phosphates and organic matter, i.e. the degree of mineralization of the cortical bone of each treatment group. Boxplots with different letters are significantly different (P < 0.05). The black lines represent the model estimates. Numbers of hens that were included in the analysis are given under each boxplot. C: control hens (egg-laying), E: hens treated with oestradiol-17ß (egg-laying), S: hens treated with deslorelin acetate (non-egg-laying), SE: hens treated with deslorelin acetate and oestradiol-17ß (non-egg-laying); G11: low performing layer line, WLA: high performing layer line.
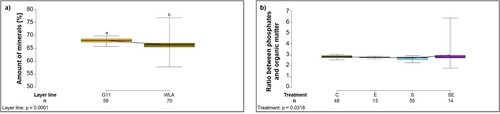
Table 4. Model results (numDF, F-value, P-value) for the fixed effects treatment group, layer line, and their two-way interaction of the thermogravimetrical parameters amount of minerals and degree of mineralization in cortical bone and medullary cavity, respectively.
Medullary cavity
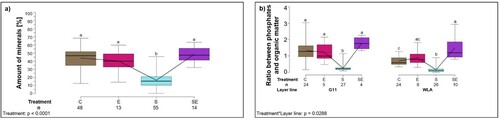
The amount of minerals (carbonates + phosphates) in the medullary cavity was significantly influenced by treatment (F3,122 = 78.21, P < 0.0001; (a), ), with a significantly lower amount in group S compared to all other treatment groups (P < 0.05 throughout) while there was no significant difference between the layer lines (F1,122 = 1.83, P = 0.1786, ). The ratio between phosphates and organic matter, i.e. the degree of mineralization, was significantly influenced by the two-way interaction between treatment and layer line (treatment*layer line: F3,120 = 3.12, P = 0.0288; (b), ): the ratio was significantly lower in group S compared to all other treatment groups within both layer lines (P < 0.05). Furthermore, within layer line WLA, the ratio was significantly higher in group SE compared to group C (P < 0.05). Within treatment group C, the ratio between phosphates and organic matter was significantly higher in layer line G11 compared to layer line WLA (P < 0.05).
Figure 7. Thermogravimetric analysis of the medullary cavity. Each boxplot represents the median, first and third quartile, and minimum and maximum of (a) the amount of minerals in the medullary cavity (%) of each treatment group; (b) the ratio between phosphates and organic matter, i.e. the degree of mineralization of the medullary cavity of each treatment group within each layer line. Boxplots with different letters are significantly different (P < 0.05). The black lines represent the model estimates. Numbers of hens that were included in the analysis are given under each boxplot. C: control hens (egg-laying), E: hens treated with oestradiol-17ß (egg-laying), S: hens treated with deslorelin acetate (non-egg-laying), SE: hens treated with deslorelin acetate and oestradiol-17ß (non-egg-laying); G11: low performing layer line, WLA: high performing layer line.
Infrared spectroscopy
Cortical bone
In cortical bone, the relative amount of mineral to organic matrix (PO4/Amide I), i.e. the degree of mineralization, was significantly higher in layer line G11 compared to WLA (F1,122 = 28.93, P < 0.0001; (a), ) while there were no significant differences between the treatment groups (F3,122 = 1.34, P = 0.2661, ). The amount of carbonate substituted in the mineral (CO3_870 / CO3_1415), which increases as the bone mineral matures (Rey et al., Citation1989; Donnelly et al., Citation2010), was significantly influenced by treatment (F3,122 = 4.65, P = 0.0041; (b), ): Group C showed a significantly higher value compared to group S (P < 0.05). In addition, the amount of carbonate substituted in the mineral was significantly higher in layer line G11 compared to WLA (layer line: F1,122 = 29.41, P < 0.0001; (c), ).
Figure 8. Infrared spectroscopy of the cortical bone. Each boxplot represents the median, first and third quartile, and minimum and maximum of (a) the relative amount of mineral to organic matrix (PO4/Amide I), i.e. the degree of mineralization of the cortical bone of each layer line; (b) the amount of carbonate substituted in the mineral of the cortical bone (CO3_870 / CO3_1415) within each treatment group; (c) the amount of carbonate substituted in the mineral of the cortical bone (CO3_870 / CO3_1415) within each layer line. This value increases as the bone mineral matures. Boxplots with different letters are significantly different (P < 0.05). The black lines represent the model estimates. Numbers of hens that were included in the analysis are given under each boxplot. C: control hens (egg-laying), E: hens treated with oestradiol-17ß (egg-laying), S: hens treated with deslorelin acetate (non-egg-laying), SE: hens treated with deslorelin acetate and oestradiol-17ß (non-egg-laying); G11: low performing layer line, WLA: high performing layer line.
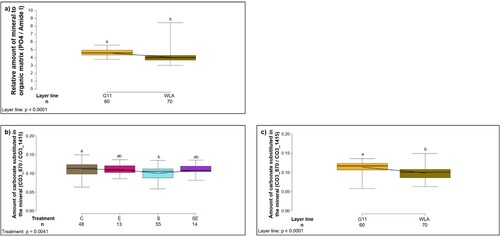
Table 5. Model results (numDF, F-value, P-value) for the fixed effects treatment group, layer line, and their two-way interaction of the parameters obtained using infrared spectroscopy, namely degree of mineralization (Mineral / Organic matrix) and carbonate substituted in the mineral in cortical bone and medullary cavity, respectively.
Medullary cavity
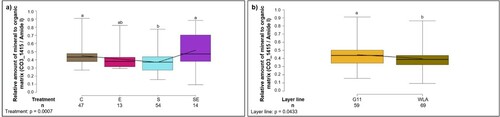
In the medullary cavity, the relative amount of mineral to organic matrix (CO3_1415/Amide I), i.e. the degree of mineralization, was significantly influenced by treatment (treatment: F3,120 = 6.02, P = 0.0007; (a), ): post-hoc analysis revealed that the degree of mineralization was significantly higher in treatment groups C and SE compared to group S (P < 0.05, respectively). In addition, the relative amount of mineral to organic matrix was significantly higher in G11 compared to WLA (layer line: F1,120 = 4.17, P = 0.0433; (b), ). The amount of carbonate substituted in the mineral (CO3_870 / CO3_1415), which increases as the bone mineral matures (Rey et al., Citation1989; Donnelly et al., Citation2010), did not significantly differ between treatment groups (F3,121 = 2.38, P = 0.0726, ) or layer lines (F1,121 = 0.002, P = 0.9606, ).
Figure 9. Infrared spectroscopy of the medullary cavity. Each boxplot represents the median, first and third quartile, and minimum and maximum of the relative amount of mineral to organic matrix (CO3_1415/Amide I), i.e. the degree of mineralization of the medullary cavity of (a) each treatment group; (b) each layer line. Boxplots with different letters are significantly different (P < 0.05). The black lines represent the model estimates. Numbers of hens that were included in the analysis are given under each boxplot. C: control hens (egg-laying), E: hens treated with oestradiol-17ß (egg-laying), S: hens treated with deslorelin acetate (non-egg-laying), SE: hens treated with deslorelin acetate and oestradiol-17ß (non-egg-laying); G11: low performing layer line, WLA: high performing layer line.
Two-dimensional X-ray diffraction
The degree of alignment of the c-axis of apatite crystals in the cortical bone (order parameter) was significantly higher in layer line WLA compared to G11 (F1,78 = 9.89, P = 0.0023; (a), ) but did not significantly differ between the treatment groups (F3,78 = 0.24, P = 0.8663, ). The relative amount of oriented crystals (oriented fraction) was significantly higher in layer line WLA compared to G11 (F1,78 = 6.81, P = 0.0109; (b), ) while there was no significant difference between the treatment groups (F3,78 = 0.49, P = 0.6892, ).
Figure 10. Two-dimensional X-ray diffraction of the cortical bone. Each boxplot represents the median, first and third quartile, and minimum and maximum of (a) the degree of alignment of the c-axis of apatite crystals in the cortical bone (order parameter) of the tibiotarsus of each layer line; (b) the relative amount of oriented crystals (oriented fraction) in the cortical bone of the tibiotarsus of each layer line. Boxplots with different letters are significantly different (P < 0.05). The black lines represent the model estimates. Numbers of hens that were included in the analysis are given under each boxplot. G11: low performing layer line, WLA: high performing layer line.
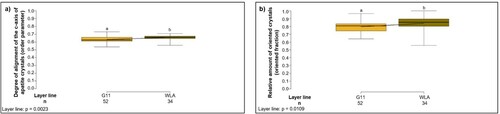
Table 6. Model results (numDF, F-value, P-value) for the fixed effects treatment group, layer line, and their two-way interaction of the parameters obtained using two-dimensional X-ray diffraction, namely order parameter and oriented fraction in cortical bone.
Discussion
Comparison between the treatment groups
The most notable differences between the treatment groups were found in bone histology. Non-egg-laying hens, i.e. hens of groups S and SE, showed a larger bone area compared to egg-laying hens, i.e. hens of groups C and E. In addition, the amount of cortical bone was higher in group SE and tended to be higher in group S compared to the egg-laying hens. Both findings may be caused by differences in the ratio between bone-forming osteoblasts and bone-degrading osteoclasts. According to Whitehead (Citation2004), there is a surge in osteoclastic resorption during the shell formation period in laying hens. It is probable that osteoclasts not only reabsorb medullary bone for calcium supply, but that cortical and trabecular bone are also reabsorbed (Whitehead, Citation2004). It has also been suggested that cortical bone is reabsorbed for refilling the medullary calcium reservoir in times when no eggshell is built (Dacke et al., Citation1993). In contrast to egg-laying hens, non-egg-laying hens do not require calcium for egg shell calcification and, thus, it is likely that osteoclastic activity is much lower in these hens. This may have led to the larger bone area and larger relative amount of cortical bone in non-egg-laying compared to egg-laying hens. However, neither the number nor the activity of osteoblasts and osteoclasts have been assessed in the current study. The finding on higher amount of cortical bone in non-egg-laying compared to egg-laying hens indicates that there is a steady decrease of cortical thickness in egg-laying hens. This assumption is in accordance with Whitehead (Citation2004) who states that structural bone content of hens declines with age. Our results clearly underline that this decrease in amount of cortical bone is driven by egg production and not by aging processes. In addition to bone area and relative amount of cortical bone, the relative amount of medullary bone also differed between the treatment groups. In contrast to the other treatment groups, hens of group S had almost no medullary bone while hens of group SE showed a relatively large amount of medullary bone. This can easily be explained by the fact that plasma concentration of oestradiol-17ß was very low in group S while hormone concentration in group SE was comparable to that of control hens (compare Eusemann et al., Citation2020). The formation of medullary bone has been shown to be dependent on oestrogens and androgens (Dacke et al., Citation1993). Thus, hens of group S did not build any medullary bone due to the lack of gonadal hormones. Hens of group SE formed medullary bone which, in contrast to medullary bone in groups C and E, was probably not reabsorbed for calcium supply as there was no formation of any eggshells.
Tibiotarsi of the different treatment groups differed in bone morphology. Within layer line WLA, length of the tibiotarsus was shortest in group E. This may possibly be explained by the high oestradiol-17ß plasma concentration in group E. In humans (Juul, Citation2001) and male rats (Vanderschueren et al., Citation2000), high concentrations of oestrogens have been found to accelerate the closure of the epiphyseal plate. However, length of the tibiotarsus did not differ between treatment groups within layer line G11. This difference between the layer lines, i.e. the presence of an effect of exogenous oestradiol-17ß in WLA but the lack of this effect in G11, may possibly be explained by the fact that hens of layer line G11 were 2 weeks older when being treated compared to hens of layer line WLA. The effect of exogenous oestradiol-17ß on bone length may be greater in young birds when there would, under physiological conditions, be more time left for growth before epiphyseal plate closure. However, no information about normal age for epiphyseal plate closure in chickens, and whether this depends on layer line, could be found in the literature. One aspect that may influence cessation of bone growth, i.e. the closure of the epiphyseal plate, in chickens is sexual maturity. Hester et al. (Citation2011) found significantly shorter bones (radius, ulna, humerus, and tibiotarsus) in hens that were subject to a rapid lighting programme and, thus, reached sexual maturity earlier compared to hens that were subject to a slow lighting programme. Thus, we had chosen the time-point of administration of the first implant accordingly: all hens had recently started laying eggs when being treated. As hens of layer line G11 reached onset of lay 2 weeks later compared to WLA, their treatment began later in life. Thus, it is not surprising that we did not find any significant difference in bone length between hens of groups S and SE on the one hand and hens of group C on the other hand, as all hens had already reached sexual maturity when being treated.
The higher relative bone weight in group S compared to group C within layer line G11 is in accordance with the larger bone diameter in this treatment group compared to control hens.
Findings about bone breaking strength were surprising. We had hypothesized that breaking strength of the tibiotarsus would be higher in non-egg-laying hens compared to egg-laying hens. However, differences between treatment groups in terms of absolute bone breaking strength depended on layer line. Within the high performing layer line WLA, hens of group S showed a higher absolute bone breaking strength compared to hens of group C, as hypothesized. However, this was not the case within layer line G11, in which group SE showed the highest absolute breaking strength while the other groups did not significantly differ from each other. In accordance, breaking strength corrected per area was higher in group SE compared to all other treatment groups within both layer lines. The high breaking strength in group SE may be explained by the high amount of cortical as well as medullary bone in this group. Fleming et al. (Citation1998) found a positive relationship between the amount of medullary bone in the humerus of laying hens and humeral breaking strength. The authors assumed that medullary bone contributed to the overall strength of the humerus by forming an interconnected latticework (Fleming et al., Citation1998). Furthermore, it is also possible that the presence of medullary bone on the endocortical surface protects the cortical bone from being reabsorbed and, thus, leads to a higher breaking strength (Fleming et al., Citation2006). In addition, hens of group SE, independent of layer line, showed the highest degree of mineralization in cortical bone as well as in medullary cavity which may also have led to a high breaking strength.
Hens of group E showed a higher breaking strength when corrected per area compared to control hens. This is in contrast to findings by other authors who found a lower breaking strength in chickens treated with exogenous oestrogen (Urist & Deutsch, Citation1960; Chen et al., Citation2014). Possibly, this discrepancy may be explained by the lower concentration of exogenous oestradiol-17ß in the present study compared to the cited studies.
Concerning chemical composition of the bones, infrared spectroscopy revealed that cortical bone of group S was less mature compared to group C. This could mean that there was more formation of new cortical bone in group S compared to group C which could also explain the larger bone area and the trend towards a higher amount of cortical bone in group S compared to group C. The medullary cavity showed a lower degree of mineralization in group S compared to the other groups. This can easily be explained by the fact that, in contrast to all other hens, hens of group S did not have medullary bone. In contrast, group SE, which showed a high amount of medullary bone, showed a higher degree of mineralization in the medullary cavity compared to group C within layer line WLA.
In general, differences between the treatment groups differed considerably between the two layer lines. Exogenous oestradiol-17ß seemed to have a higher impact on the tibiotarsus in hens of layer line WLA compared to hens of layer line G11. This could indicate a genetic dependency of physiologic mechanisms and the way they can be moderated by external stimuli.
As predicted, the moderately performing layer line G11 showed a significantly higher breaking strength of the tibiotarsus compared to the high performing layer line WLA when corrected for bone area. The higher breaking strength in G11 may be caused by structural differences as well as differences in chemical composition. G11 showed a higher amount of medullary bone compared to WLA. This may indicate that more medullary bone was reabsorbed in WLA, possibly due to the higher demand caused by the higher laying performance. It may also indicate that layer line G11 produced more medullary bone compared to WLA. In addition, medullary cavity showed a higher degree of mineralization in control hens of layer line G11 compared to control hens of WLA. Although intrinsic strength of medullary bone itself is considered to be low, the higher amount and higher degree of mineralization of the medullary bone in G11 may have contributed to the higher breaking strength as discussed by Fleming et al. (Citation1998) and Fleming et al. (Citation2006) and above for the treatment groups.
Interestingly, the amount of cortical bone did not differ between the layer lines. However, cortical bone of G11 showed a higher degree of mineralization compared to WLA. Again, this may possibly be explained by the higher demand of calcium in WLA. It is possible that the high performing layer line WLA reabsorbed more calcium compared to the moderately performing layer line G11, leading to a lower degree of mineralization in WLA. Taylor and Moore (Citation1954) found that when hens were fed on a low-calcium diet, the amount of cortical ash decreased dramatically while there was only a very slight decrease in the amount of medullary ash. This could indicate that the calcium supply was not adequate in hens of layer line WLA. Boskey and Mendelsohn (Citation2005) found that, in human patients with osteoporosis, mineral content in bone biopsies was decreased when compared to healthy persons. Thus, the lower degree of mineralization in WLA compared to G11 could be interpreted as a sign of osteoporosis in this layer line. Accordant to that, osteoporosis is seen as an underlying cause of bone fractures in laying hens (Whitehead & Fleming, Citation2000). No conclusion about differences in the maturity of cortical bone between the layer lines can be drawn because findings differed between the analysis methods (infrared spectroscopy and 2D-X-ray diffraction).
Prior to euthanasia, we had repeatedly radiographed all hens of the present study in order to find possible differences in the prevalence of keel bone damage between treatment groups and between layer lines (see Eusemann et al., Citation2020). We had found large differences between the treatment groups and also between the layer lines. Thus, with the present work, we aimed at assessing whether there were underlying differences in skeletal properties which may explain the differences in keel bone damage. Due to the higher degree of standardizability of assessment of long bones compared to keel bones, we used tibiotarsi for analysis of skeletal characteristics. This part of the discussion aims at comparing findings about keel bone fractures presented earlier (Eusemann et al., Citation2020) with findings about characteristics of the tibiotarsus presented here, in order to estimate whether the differences in structure and composition of the tibiotarsus between treatment groups and layer lines may be related to keel bone damage.
We had found a much lower risk of keel bone fracture in the non-egg-laying hens (80% decreased risk in group S and 94% decreased risk in group SE) compared to hens of group C (Eusemann et al., Citation2020). In fact, keel bone fractures were very rarely detected in non-egg-laying hens while prevalence was up to 76.92% in egg-laying hens (layer line WLA, group C, 61st week of age; for details, please see Eusemann et al., Citation2020). In addition, hens of group E had shown a slightly higher risk of keel bone fracture (increased by 17%) compared to hens of group C while hens of group SE had shown a slightly lower risk of keel bone fracture compared to group S (Eusemann et al., Citation2020). Thus, we had hypothesized that breaking strength of the tibiotarsus would be higher in groups S and SE compared to group C, in group C compared to group E, and in group SE compared to group S. However, findings were more complex (compare results section above): some of the findings presented here were in accordance with our expectations (e.g. higher absolute bone breaking strength in group S compared to group C within layer line WLA) while others were not (e.g. no difference between groups S and C within layer line G11) or were even contradictory to our expectations (lower breaking strength when corrected for bone area in group C compared to group E). There are several possible explanations for the partial discrepancy between risk of keel bone fracture and breaking strength of the tibiotarsus. First, it is possible that breaking strength of the keel bone and of the tibiotarsus are not directly linked. As location and imposed load markedly differ between these two bones, it is possible that their breaking strength is influenced by different factors. We had found a higher locomotor activity in the egg-laying compared to the non-egg-laying hens (Eusemann et al., Citation2020). This higher locomotor activity may have positively influenced breaking strength of the tibiotarsus and femur but may have had little impact on the keel bone. The higher locomotor activity may even have led to an increased risk of keel bone fracture due to a higher risk of collisions. However, as discussed in the previous work, differences in locomotor activity between the treatment groups were relatively small while differences in risk of keel bone fracture were very large (Eusemann et al., Citation2020). Thus, it seems rather unlikely that the higher locomotor activity in egg-laying hens played an important role in the aetiology of keel bone fractures. Second, keel bone fractures may not be linked to bone breaking strength. The aetiology of keel bone fractures is not yet fully understood. It is often assumed that they are a consequence of trauma and that bone weakness increases the risk. However, it is also possible that the keel bone fractures found in our hens were not of traumatic origin but rather pathologic fractures. According to that, in a recent study, no signs of trauma in broken keel bones were found when fractures were pathologically characterized (Thøfner et al., Citation2020). As the presence or absence of signs of trauma was not the subject of our study (Eusemann et al., Citation2020), we do not know whether these keel bone fractures were of traumatic origin. Lastly, the partial discrepancy between risk of keel bone fracture and breaking strength of the tibiotarsus with regard to the treatment groups may also be caused by the relatively small numbers of birds in some of the groups.
However, when comparing the layer lines, we did not find contrary results between susceptibility to keel bone fracture and breaking strength of the tibiotarsus. As predicted, the moderately performing layer line G11 showed a significantly higher breaking strength of the tibiotarsus compared to the high performing layer line WLA when corrected for bone area. This finding is in line with findings that hens of layer line G11 of the same study showed a lower risk of keel bone fracture compared to hens of layer line WLA (Eusemann et al., Citation2020).
In addition to keel bone fractures, we had also assessed keel bone deviations, the second form of keel bone damage, where the keel bone “contains section(s) that vary from a theoretically perfect 2-dimensional straight plane in either the transverse or sagittal planes” or an “indentation along the ventral surface” (Casey-Trott et al., Citation2015). Within layer line G11, we had found more severe deviations in treatment group S compared to the other treatment groups while deviations were more severe in groups C and SE compared to groups S and E within layer line WLA (Eusemann et al., Citation2020). A similar but not fully identical pattern was found for absolute breaking strength of the tibiotarsus in the present work: while group S showed a relatively high breaking strength within layer line WLA, the opposite was the case within layer line G11. However, this pattern has not been found in the other characteristics of the tibiotarsus and its relevance as well as its possible link to keel bone deviations remain unknown.
Lastly, we had assessed radiographic density of the keel bone in the previous work. This parameter was higher in non-egg-laying hens compared to egg-laying hens towards the end of the study (Eusemann et al., Citation2020). We had suggested that this difference may reflect differences in bone mass and the degree of mineralization. Our results in the present study – larger bone area and larger relative area of cortical bone in groups S and SE compared to group C – may support this suggestion. It is possible that bone area and cortical thickness of the keel bone differed in the same way as in tibiotarsi between the treatment groups, leading to a decreased radiographic density in groups C and E. This lower bone area and amount of cortical bone in the keel bone may, if present, have contributed to the high incidence of keel bone fractures in egg-laying hens. However, bone area and amount of cortical bone of the keel bone have not been assessed in the present or previous work. Radiographic density differed between both non-egg-laying groups, too: group SE showed a higher radiographic density of the keel bone compared to group S (Eusemann et al., Citation2020) which may be explained by the presence or absence of medullary bone, respectively, that we found in the present study. The presence of medullary bone in group SE may possibly explain the higher bone breaking strength of the tibiotarsus described here as well as the lower risk of keel bone fracture in group SE compared to group S described earlier (Eusemann et al., Citation2020).
Taken together, some of the characteristics of the tibiotarsus presented in this work may be linked to risk and severity of keel bone damage while others seem to be less representative. This is in accordance with a study by Gebhardt-Henrich et al. (Citation2017) who found associations between keel bone fractures and some bone traits while other traits did not seem to be correlated. In detail, calcium content of the keel bone, which was positively correlated with calcium content of the tibiotarsus, and shear strength of the tibiotarsus were higher in hens without keel bone fracture compared to hens with keel bone fracture (Gebhardt-Henrich et al., Citation2017). In contrast, density measurements, which had been obtained using computer tomography, did not differ between hens with and without keel bone fracture (Gebhardt-Henrich et al., Citation2017). It is important to note that in contrast to Gebhardt-Henrich et al. (Citation2017) who assessed both bones after euthanasia, we repeatedly took radiographs of the keel bone from the 13th to the 61st week of age while characteristics of the tibiotarsus were assessed after euthanasia in the 63rd week of age.
Conclusion
In conclusion, our findings reveal important differences in structure and composition of the tibiotarsus between egg-laying and non-egg-laying hens, hens treated with exogenous oestradiol-17ß and untreated hens as well as between different layer lines. Treatment groups markedly differed in bone structure. Relative amount of cortical bone was higher in non-egg-laying compared to egg-laying hens. Layer lines differed in bone structure as well as chemical composition of the bones. The moderately performing layer line showed a higher relative amount of medullary bone and a higher degree of mineralization of the cortical bone. These findings indicate a higher bone quality in non-egg-laying hens as well as in hens of a moderately performing layer line and may possibly explain the lower risk of keel bone fracture which has previously been found compared to egg-laying hens or hens of a high performing layer line, respectively. The influence of the gonadal steroid oestradiol-17ß remains unclear and seems to depend on reproductive state as well as layer line.
Supplemental Material
Download MS Excel (14.1 KB)Supplemental Material
Download MS Excel (39.4 KB)Acknowledgements
We thank the staff of the animal husbandry facility of the Friedrich-Loeffler-Institut in Celle, especially Klaus Gerling and Philipp Knorscheidt, for taking care of the hens. Furthermore, we thank Silke Werner, Gabriele Kirchhof, Franziska Suerborg, and Birthe Giewald for excellent technical assistance and Steffen Weigend as well as Lohmann Tierzucht GmbH (Cuxhaven, Germany) for providing the chickens. ARN thanks for financial support through grant CGL2015-64683-P (Spain) and to Santiago Gonzalez Lopez and Jose Romero for helping with analysis. We also thank the Poultry Bone Group from Roslin Institute, Edinburgh, especially Heather McCormack, for the protocols and invaluable help with the histological preparation of our bone samples.
Disclosure statement
No potential conflict of interest was reported by the authors.
Additional information
Funding
Related Research Data
References
- Boskey, A. & Mendelsohn, R. (2005). Infrared analysis of bone in health and disease. Journal of Biomedical Optics, 10, 031102.
- Candelotto, L., Stratmann, A., Gebhardt-Henrich, S.G., Rufener, C., van de Braak, T. & Toscano, M.J. (2017). Susceptibility to keel bone fractures in laying hens and the role of genetic variation. Poultry Science, 96, 3517–3528.
- Casey-Trott, T., Heerkens, J.L., Petrik, M., Regmi, P., Schrader, L., Toscano, M.J. & Widowski, T. (2015). Methods for assessment of keel bone damage in poultry. Poultry Science, 94, 2339–2350.
- Chen, S.Y., Li, T.Y., Tsai, C.H., Lo, D.Y. & Chen, K.L. (2014). Gender, caponization and exogenous estrogen effects on lipids, bone and blood characteristics in Taiwan country chickens. Animal Science Journal, 85, 305–312.
- Dacke, C., Arkle, S., Cook, D., Wormstone, I., Jones, S., Zaidi, M. & Bascal, Z. (1993). Medullary bone and avian calcium regulation. Journal of Experimental Biology, 184, 63–88.
- Donnelly, E., Boskey, A.L., Baker, S.P. & Van der Meulen, M.C. (2010). Effects of tissue age on bone tissue material composition and nanomechanical properties in the rat cortex. Journal of Biomedical Materials Research Part A: An Official Journal of The Society for Biomaterials, The Japanese Society for Biomaterials, and The Australian Society for Biomaterials and the Korean Society for Biomaterials, 92, 1048–1056.
- EFSA. (2005). Welfare aspects of various systems of keeping laying hens. EFSA Journal, 197, 123.
- Eusemann, B.K., Baulain, U., Schrader, L., Thöne-Reineke, C., Patt, A. & Petow, S. (2018). Radiographic examination of keel bone damage in living laying hens of different strains kept in two housing systems. PLoS One, 13, e0194974.
- Eusemann, B.K., Patt, A., Schrader, L., Weigend, S., Thöne-Reineke, C. & Petow, S. (2020). The role of egg production in the etiology of keel bone damage in laying hens. Frontiers in Veterinary Science, 7, 81.
- Eusemann, B.K., Sharifi, A.R., Patt, A., Reinhard, A.K., Schrader, L., Thöne-Reineke, C. & Petow, S. (2018). Influence of a sustained release deslorelin acetate implant on reproductive physiology and associated traits in laying hens. Frontiers in Physiology, 9, 1846.
- FAWC. (2010). Opinion on osteoporosis and bone fractures in laying hens. London: Farm Animal Welfare Committee.
- FAWC. (2013). An open letter to Great Britain governments: keel bone fractures in laying hens. London: Farm Animal Welfare Committee.
- Fleming, R.H., McCormack, H.A., McTeir, L. & Whitehead, C.C. (1998). Medullary bone and humeral breaking strength in laying hens. Research in Veterinary Science, 64, 63–67.
- Fleming, R.H., McCormack, H.A., McTeir, L. & Whitehead, C.C. (2004). Incidence, pathology and prevention of keel bone deformities in the laying hen. British Poultry Science, 45, 320–330.
- Fleming, R., McCormack, H., McTeir, L. & Whitehead, C. (2006, September). The relative density of bone types in laying hens. In Proceedings of the 12th European Poultry Conference (pp. 10–14).
- Forstmeier, W. & Schielzeth, H. (2011). Cryptic multiple hypotheses testing in linear models: overestimated effect sizes and the winner's curse. Behavioral Ecology and Sociobiology, 65, 47–55.
- Fratzl, P., Gupta, H.S., Paschalis, E.P. & Roschger, P. (2004). Structure and mechanical quality of the collagen–mineral nano-composite in bone. Journal of Materials Chemistry, 14, 2115–2123.
- Gebhardt-Henrich, S.G., Pfulg, A., Fröhlich, E.K., Käppeli, S., Guggisberg, D., Liesegang, A. & Stoffel, M.H. (2017). Limited associations between keel bone damage and bone properties measured with computer tomography, three-point bending test, and analysis of minerals in Swiss laying hens. Frontiers in Veterinary Science, 4, 128.
- Gupta, R., Grasruck, M., Suess, C., Bartling, S.H., Schmidt, B., Stierstorfer, K., Popescu, S., Brady, T. & Flohr, T. (2006). Ultra-high resolution flat-panel volume CT: fundamental principles, design architecture, and system characterization. European Radiology, 16, 1191–1205.
- Habig, C., Baulain, U., Henning, M., Scholz, A.M., Sharifi, A.R., Janisch, S., Simianer, H. & Weigend, S. (2017). How bone stability in laying hens is affected by phylogenetic background and performance level. European Poultry Science, 81, 200.
- Heerkens, J.L., Delezie, E., Ampe, B., Rodenburg, T.B. & Tuyttens, F.A. (2016). Ramps and hybrid effects on keel bone and foot pad disorders in modified aviaries for laying hens. Poultry Science, 95, 2479–2488.
- Hester, P.Y., Wilson, D.A., Settar, P., Arango, J.A. & O'sullivan, N.P. (2011). Effect of lighting programs during the pullet phase on skeletal integrity of egg-laying strains of chickens. Poultry Science, 90, 1645–1651.
- Hocking, P.M., Bain, M., Channing, C.E., Fleming, R. & Wilson, S. (2003). Genetic variation for egg production, egg quality and bone strength in selected and traditional breeds of laying fowl. British Poultry Science, 44, 365–373.
- Juul, A. (2001). The effects of oestrogens on linear bone growth. Apmis, 109, S124–S134.
- Käppeli, S., Gebhardt-Henrich, S., Fröhlich, E., Pfulg, A. & Stoffel, M. (2011). Prevalence of keel bone deformities in Swiss laying hens. British Poultry Science, 52, 531–536.
- Kittelsen, K.E., Jensen, P., Christensen, J.P., Toftaker, I., Moe, R.O. & Vasdal, G. (2020). Prevalence of keel bone damage in red jungle fowls (Gallus gallus) – a pilot study. Animals, 10, 1655.
- Lieboldt, M.A., Halle, I., Frahm, J., Schrader, L., Baulain, U., Henning, M., Preisinger, R., Dänicke, S. & Weigend, S. (2015). Phylogenic versus selection effects on growth development, egg-laying and egg quality in purebred laying hens. European Poultry Science, 79, 89.
- Miller, S.C. & Bowman, B.M. (1981). Medullary bone osteogenesis following estrogen administration to mature male Japanese quail. Developmental Biology, 87, 52–63.
- Nasr, M.A.F., Murrell, J. & Nicol, C.J. (2013). The effect of keel fractures on egg production, feed and water consumption in individual laying hens. British Poultry Science, 54, 165–170.
- Nasr, M.A.F., Nicol, C.J. & Murrell, J.C. (2012). Do laying hens with keel bone fractures experience pain? PLoS One, 7, e42420.
- Petrik, M.T., Guerin, M.T. & Widowski, T.M. (2015). On-farm comparison of keel fracture prevalence and other welfare indicators in conventional cage and floor-housed laying hens in Ontario, Canada. Poultry Science, 94, 579–585.
- Pinheiro, J., Bates, D., DebRoy, S., Sarkar, D. & R Core Team. (2018). nlme: linear and nonlinear mixed effects models (pp. 1–137). R package version 3.
- Rey, C., Collins, B., Goehl, T., Dickson, I.R. & Glimcher, M.J. (1989). The carbonate environment in bone mineral: a resolution-enhanced Fourier Transform infrared spectroscopy study. Calcified Tissue International, 45, 157–164.
- Richards, G., Wilkins, L., Knowles, T., Booth, F., Toscano, M., Nicol, C. & Brown, S.N. (2012). Pop hole use by hens with different keel fracture status monitored throughout the laying period. Veterinary Record, 170, 494.
- Rodenburg, T., Tuyttens, F., De Reu, K., Herman, L., Zoons, J. & Sonck, B. (2008). Welfare assessment of laying hens in furnished cages and non-cage systems: an on-farm comparison. Animal Welfare, 17, 363–373.
- Rodriguez-Navarro, A.B., McCormack, H.M., Fleming, R.H., Alvarez-Lloret, P., Romero-Pastor, J., Dominguez-Gasca, N., Prozorov, T. & Dunn, I.C. (2018). Influence of physical activity on tibial bone material properties in laying hens. Journal of Structural Biology, 201, 36–45.
- Taylor, T.G. & Moore, J.H. (1954). Skeletal depletion in hens laying on a low-calcium diet. British Journal of Nutrition, 8, 112–124.
- Thøfner, I., Hougen, H.P., Villa, C., Lynnerup, N. & Christensen, J.P. (2020). Pathological characterization of keel bone fractures in laying hens does not support external trauma as the underlying cause. PLoS One, 15, e0229735.
- Urist, M.R. & Deutsch, N.M. (1960). Osteoporosis in the laying hen. Endocrinology, 66, 377–391.
- Vanderschueren, D., Boonen, S., Ederveen, A.G.H., De Coster, R., Van Herck, E., Moermans, K., Vandenput, L., Verstuyf, A. & Bouillon, R. (2000). Skeletal effects of estrogen deficiency as induced by an aromatase inhibitor in an aged male rat model. Bone, 27, 611–617.
- Weiner, S. & Wagner, H.D. (1998). The material bone: structure-mechanical function relations. Annual Review of Materials Science, 28, 271–298.
- Whitehead, C.C. (2004). Overview of bone biology in the egg-laying hen. Poultry Science, 83, 193–199.
- Whitehead, C.C. & Fleming, R.H. (2000). Osteoporosis in cage layers. Poultry Science, 79, 1033–1041.
- Wilkins, L.J., McKinstry, J.L., Avery, N.C., Knowles, T.G., Brown, S.N., Tarlton, J. & Nicol, C.J. (2011). Influence of housing system and design on bone strength and keel bone fractures in laying hens. Veterinary Record, 169, 414.
- Zimmermann, E.A., Schaible, E., Bale, H., Barth, H.D., Tang, S.Y., Reichert, P., Busse, B., Alliston, T., Ager, J.W. & Ritchie, R.O. (2011). Age-related changes in the plasticity and toughness of human cortical bone at multiple length scales. Proceedings of the National Academy of Sciences, 108, 14416–14421.