
ABSTRACT
Coccidiosis caused by Eimeria spp. incurs significant morbidity and mortality in chickens, and is thus of great economic importance. Post-mortem intestinal lesion scoring remains one of the most common means of diagnosis; therefore alternative, non-invasive methods of diagnosis and monitoring would be highly desirable. Micro-RNAs (miRNAs) have been shown to be stable in faeces of human and animal species with expression altered in gastrointestinal disease. We hypothesized that miRNA is stable in caecal content of chickens, and that differential miRNA expression patterns would be seen in Eimeria-infected versus uninfected individuals. Initially, RNA was extracted from Eimeria tenella-infected (n = 3; 7 days post infection) and uninfected (n = 3) chicken caecal content to demonstrate miRNA stability. Subsequently, next-generation miRNA sequencing was performed on caecal content from E. tenella-infected chickens with high (lesion score (LS) 3–4; n = 3) or low (LS1; n = 3) levels of pathology, and uninfected controls (n = 3). Comparative analysis identified 19 miRNAs that exhibited significantly altered expression in the caecal content of E. tenella, infected chickens versus uninfected chickens (t-test, False Discovery Rate (FDR) < 0.05). Eight of these miRNAs showed significant up-regulation in infection (fold change of 9.8–105, FDR <0.05). Quantitative PCR was performed using separate biological replicates to confirm differential regulation in eight of these miRNA candidates in caecal and faecal content. This work has identified a panel of miRNA candidates which may be appropriate for use as non-invasive faecal markers of active caecal coccidiosis without the need for culling.
E. tenella induced differential miRNA expression in caecal content and faeces.
RESEARCH HIGHLIGHTS
Introduction
Coccidiosis is a serious intestinal disease in chickens (Gallus gallus domesticus) caused by protozoan parasites of the genus Eimeria, incurring significant morbidity, mortality, and economic losses (Blake et al., Citation2020; Chapman et al., Citation2013). Management and chemoprophylaxis remain the most important forms of anticoccidial control for broiler chickens, supplemented by a significant role for live vaccines in layer and breeding stock (Elwinger et al., Citation2016). Unfortunately, resistance develops rapidly for every anticoccidial drug currently available and has become widespread, compromising economic productivity and bird welfare (Chapman, Citation1999). Live wild-type (non-attenuated) and attenuated vaccines are highly effective and increasingly popular (Chapman & Jeffers, Citation2014), but difficult to scale up for mainstream application in broiler production. Eimeria tenella is among the most common species to induce coccidiosis, is highly pathogenic and colonizes the chicken caecum, causing haemorrhage, oedema, necrosis, and anaemia (Györke et al., Citation2013).
Diagnosis of coccidiosis in broiler chickens and identification of causative Eimeria species is commonly achieved by post-mortem examination of dead or culled chickens, and/or euthanasia of a representative group of sentinel chickens. Differentiation of different Eimeria species involvement is commonly difficult, time-consuming, and expensive (Carvalho et al., Citation2011). Other approaches to detect Eimeria infection include microscopic examination of faecal or litter samples to detect shed oocysts, although this is ineffective during the pre-patent period and shows poor correlation with control strategies (Jenkins et al., Citation2017). Qualitative and quantitative polymerase chain reaction (PCR) assays are available for parasite detection from faecal or litter samples (Peek et al., Citation2017), but offer similarly limited diagnostic value during the pre-patent period. An alternative and simpler molecular form of diagnosis to monitor the occurrence of infection (or disease) and inform prevention and control methods would therefore be highly desirable; for example, screening from faecal material. Previous studies have shown differential expression of micro-RNAs (miRNAs) in chicken intestinal tissue during infection with Campylobacter jejuni (Liu et al., Citation2016), as well as E. acervulina, E. maxima, and E. necatrix (Giles et al., Citation2020; Liu et al., Citation2020), requiring collection of diagnostic samples post-mortem. Here, we critically assess miRNA profiles in intestinal (caecal) content and faeces with a view to diagnostic test development appropriate for use with live chickens.
Complex biological molecules such as high molecular weight nucleic acids are often not recoverable from intestinal contents or faeces due to digestive processes and microbial degradation in the gastrointestinal tract. However, miRNAs are short non-coding genetic sequences that are highly stable in faeces and are produced by both hosts and their parasites (Link et al., Citation2012). We hypothesized that miRNAs are also stable in avian caecal and faecal content, that faecal miRNAs reflect caecal content miRNAs, and are produced by the host and influenced by E. tenella infection, potentially modifying local tissue defence mechanisms and the intestinal microbiome. We further hypothesized that miRNA signatures may also reflect caecal inflammation due to the presence or absence of E. tenella infection, and may be influenced by the severity of parasite-associated pathology (e.g. caecal lesion score). An ability to detect E. tenella infection and quantify the severity of disease offers value to routine flock surveillance, with specific applications in resource-intensive processes such as in vivo anticoccidial susceptibility testing (AST) (Peek & Landman, Citation2003).
MiRNA can be extracted from a wide range of tissues and bodily fluids, using a variety of commercially available kits. Different methods of extraction, including phenol-based, column-based, and combinations of these can be used (Lekchnov et al., Citation2016). Two such extraction kits are the “Norgen Stool RNA Purification Kit” and the “MirVana miRNA Isolation Kit”. This study aimed to test the hypotheses that the stability of miRNA will enable its extraction and amplification from chicken caecal content, and that variation in a subset of the miRNAs produced by the host associates with the presence/absence and/or severity of E. tenella infection.
Materials and methods
Animal ethics statement
The work described was conducted in accordance with UK Home Office regulations under the Animals (Scientific Procedures) Act 1986 (ASPA). Protocols were approved by the Royal Veterinary College Animal Welfare and Ethical Review Body (AWERB). Study birds were observed twice per day for signs of illness and/or welfare impairment and were sacrificed under Home Office licence by cervical dislocation. Throughout the study, all chickens had access to feed and water ad libitum.
Parasite propagation
Sporulated E. tenella parasites of the Houghton reference strain (Aunin et al., Citation2021) were propagated and maintained as described previously (Long et al., Citation1976) using specific pathogen-free (SPF) Lohmann Valo chickens accommodated in ammonia-fumigated facilities. Chickens were received when 21 days old, infected 7 days later by oral gavage and culled for parasite harvest when 35 days old.
Chicken studies
Caecal content samples for initial qPCR validation of miRNA recovery and quality
Lohmann Valo chickens (28 days of age) reared under SPF conditions were infected by oral inoculation of 4000 E. tenella oocysts or sham inoculated as part of a separate study. Caecal contents were collected 7 days after inoculation from infected (n = 6) and sham (n = 3) chickens during post-mortem examination, immediately after cervical dislocation. Samples were stored at −80°C.
Caecal content samples for miRNA sequencing
Samples were taken as part of a larger study where 2501-day-old, Cobb500 broiler chickens were housed in coccidia-free conditions (Macdonald et al., Citation2017). At 21 days of age, 25 chickens in group 1 (uninfected control group) received a single inoculum of 1 ml of DNase/RNase-free water. In parallel, 225 broilers in group 2 (infected group) were inoculated with 35,000 sporulated E. tenella oocysts in 1 ml of water. Four and a half days (108 h) post-infection all birds were culled (26 days old). Post-mortem, caecal tissue was assessed immediately for lesions and scored following an established method (Johnson & Reid, Citation1970). Lesions were scored from 0 to 4: 0 (no lesions), 1 (mild lesions), 2 (moderate lesions), 3 (high lesions), 4 (severe lesions). Caecal contents were collected and snap-frozen in liquid nitrogen. All samples were stored at −80°C until further processing. Caecal content samples were selected from female chickens that were uninfected controls (n = 3), infected lesion score 0 (n = 3) and infected lesion score 4 (n = 3).
Caecal content samples for qPCR of selected miRNA targets: validation of RNAseq data in biological replicates
The second set of samples was collected from a duplicate experiment run 20 months after the first, providing independent biological replication. Nine samples were chosen, including uninfected controls (n = 3), infected lesion score 0/1 (n = 3) and infected lesion score 4 (n = 3). All samples were stored at −80°C until further processing.
Faecal samples for qPCR of selected miRNA targets: validation of miRNAs differentially expressed in caecal content
Faecal material characteristic of caecal droppings (i.e. brown, sticky; differentiated from more solid small intestinal droppings that were rich in uric acid) was collected from five Lohmann Valo chickens 4.5 days after oral infection with 4000 E. tenella sporulated oocysts. All five chickens were euthanized for parasite harvest 7 days post-infection, presenting with high pathology (lesion score 3). Equivalent caecal droppings were also collected in parallel from four uninfected, age-matched chickens. All samples were stored at −80°C until further processing.
RNA extraction and preparation
RNA was extracted from caecal content samples using the Norgen Stool Total RNA Purification Kit (Cat. No. 49500, Biotek, Thorold, ON, Canada) as per the manufacturer’s instructions. Briefly, 200 mg of caecal content from each sample was homogenized using a Minibead Beater, (Biospec, Bartlesville, OK, USA) at 3.5 × 1000 oscillations per minute for 1 min, and a rapid spin column procedure was then used to extract and purify total RNA. An additional step of on-column DNA removal was conducted as per the manufacturer’s instructions. The extracted total RNA samples were analysed using a Nanodrop spectrophotometer (NanoDrop, ND-1000 Spectrophotometer, Wilmington, NC, USA). Data were analysed and plotted using GraphPad Prism 7 software, Python (Version 3.9.5), and plotnine (Version 0.8.0).
RNA extraction for method development was additionally performed using the Mirvana miRNA Isolation Kit (Mirvana, ThermoFisher Scientific, Waltham, MA, USA) following the kit protocol, with minor modifications. For each sample, 1 ml of Mirvana Lysis/Binding Solution was used. Then 500 µl of bead beaten caecal contents were transferred to an RNase-free microcentrifuge tube with 50 µl of miRNA Homogenate Additive. At the total RNA isolation stage, 500 µl of 100% (v/v) ethanol was added to the separated aqueous phase. Sample mixtures were added to the filter cartridge in two aliquots of 450 µl and centrifuged at 10,000 × g for 15 s between each addition. The filter cartridge and collection tube were centrifuged twice further, for 15 s both times. Samples were centrifuged for 10 s following the addition of both Wash Solution 1 and Wash Solution 2/3, and for 30 s following the Elution Solution. RNaseZAP (Merck, Gillingham, UK), an RNase decontamination solution, was used on equipment and work areas prior to experimentation with extracted RNAs to reduce RNase-dependent RNA degradation.
Bioanalyzer
An Agilent RNA 6000 Nano Kit was used with an Agilent 2100 Electrophoresis Bioanalyzer to analyse the RNA samples. All sample concentrations were diluted to the recommended range of 25–500 ng/µl. The chip priming station, gel-dye mix preparation and marker, ladder and sample loading were performed following manufacturer’s instructions.
Polyadenylation and reverse transcription
cDNA was prepared using a Mir-X miRNA First-Strand Synthesis Kit (Clontech, Saint-Germain-en-Laye, France). The RNA samples were diluted using bottled ultrapure diethylpyrocarbonate (DEPC)-treated water to a standard concentration of 0.28 µg/µl. Appropriate reagents from the kits were added following the protocol and the mixtures were incubated in a thermocycler (G Storm Thermal Cycler with GS0096 96 well block, GT 11584) for 1 h at 37°C, then for 5 min at 85°C. The product was made up to a final volume of 100 µl and used in qPCR.
Quantitative PCR (qPCR)
qPCR was performed using the SYBR Advantage qRT-PCR Kit (Clontech) following the given protocol. Each sample well contained 9 µl of RNase-free water, 12.5 µl SYBR Advantage Premix, 0.5 µl ROX dye, 0.5 µl miRNA-specific primer, 0.5 µl mRQ 3ʹ primer and finally 2 µl of cDNA, to give a total volume of 25 µl per well. Primers specific to mapped miRNA sequences were designed using miRbase (University of Manchester) and synthesized by Merck Life Science UK Limited, Gillingham, UK. The entire sequence of each miRNA was used as the miRNA-specific, 5ʹ primer (). For relative quantification, U6 snRNA supplied with the kit was used as a positive control with the universal primer U6 using the ΔΔCt method. A non-target negative control sequence (cel-miR-39) derived from Caenorhabditis elegans was included in the qPCR assay as a negative control. All samples, controls, and no template controls (NTC) were run in duplicate. Amplification was performed on a real-time qPCR instrument (CFX-96 new generation Real-Time PCR detection, C-1000 Thermal Cycler). Reactions were denatured for 10 s at 95°C, followed by 40 qPCR cycles consisting of 95°C for 5 s and 60°C for 20 s. Finally, a dissociation curve of 95°C for 60 s, 55°C for 5 s and 95°C for 5 s was performed. Statistical comparisons were made by ANOVA with Tukey’s post hoc analysis.
Table 1. Sequences of selected miRNAs identified in this study and used as primers for validation qPCR. Note, the reverse primer used in validation for all target miRNAs was the Universal mRQ 3ʹ primer supplied with the Mir-X™ miRNA First-Strand Synthesis and SYBR® qRT-PCR kit. cel-miR-39 represents a non-target sequence from C. Elegans used as a negative control.
Data analysis
qPCR data were analysed using the Delta-Delta Method (ΔΔCt) (Livak & Schmittgen, Citation2001) and GraphPad Prism 7 software.
miRNA sequencing, read processing, and quality control
RNA samples were processed by LC Sciences, Houston, TX, USA to generate a small RNA library using the Illumina Truseq™ Small RNA Preparation kit according to manufacturer protocols. Purified cDNA libraries were used for cluster generation on an Illumina Cluster Station and then sequenced on an Illumina HiSeq X Ten platform. Raw sequencing reads (50 nt) were obtained using Illumina’s Sequencing Control Studio software version 2.8 (SCS v2.8) following real-time sequencing image analysis and base-calling by Illumina’s Real-Time Analysis version 1.8.70 (RTA v1.8.70).
A proprietary pipeline script, ACGT101-miR v4.2 (LC Sciences), was used for sequencing data analysis. After the raw sequence reads, sequences were extracted from image data, and a series of digital filters were applied to exclude various un-mappable sequencing reads. During data combination and analysis, low read sequences were removed. The small RNA sequences generated were mapped against pre-miRNA (mir) and mature miRNA (miR) sequences listed in miRBase (ftp://mirbase.org/pub/mirbase/CURRENT/, version 21) based on the public releases for Gallus gallus and other listed avian species. Sequences were also mapped against the G. gallus genome (ftp://ftp.ncbi.nlm.nih.gov/genomes/Gallus gallus/, version 4). Normalization of sequence counts in each sample (or data set) was achieved by dividing the counts by a library size parameter from the corresponding sample. The library size parameter was a median value of the ratio between the counts of a specific sample and a pseudo-reference sample. A count number in the pseudo-reference sample was the count geometric mean across all samples. Raw reads have been deposited with the European Bioinformatics Institute (www.ebi.ac.uk) under study accession PRJEB48934.
Results
Extraction methods
To assess our ability to recover miRNAs from intestinal contents, we compared the concentration and quality of RNA extracted from chicken caecal contents after storage for approximately 16 months at −80°C using two commercially available RNA extraction kits (Norgen Stool Total RNA Extraction Kit and Mirvana miRNA Isolation Kit). The concentrations and optical densities of the extracted samples were analysed using spectrophotometry. Concentration analysis produced a mean of 131.62 ng/µl ± 51.74 (SD) using the Norgen kit and a mean of 264.04 ng/µl ± 147.69 (SD) with the Mirvana kit (). The Mirvana kit demonstrated a wider range of concentrations than the Norgen kit. Samples extracted by the Mirvana kit yielded a 44% mean increase in concentration compared to the Norgen kit.
Figure 1. Box-and-whisker plots of spectrophotometry and bioanalyser data to assess the quality and purity of RNA extracted from caecal content using Norgen or Mirvana kits. (A) RNA concentration in Norgen and Mirvana extraction kits. (B) RIN values for each extraction method in all samples. (C) RNA concentration in the uninfected population for each extraction kit. (D) RNA concentration in the infected population for each extraction kit. Whiskers represent minimum and maximum, box represents 25th and 75th centiles and line represents median.
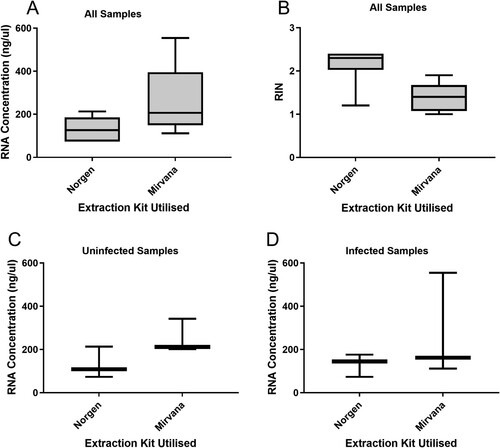
Comparing uninfected and infected samples for both kits gave ranges of 73.68–342.35 ng/µl (with a mean of 191.81 ng/µl) and 73.71–554.71 ng/µl (with a mean of 203.84 ng/µl), respectively (). When the Norgen uninfected and infected samples were compared, the uninfected samples gave a range of 73.68–213.08 ng/µl whilst the infected samples gave a range of 73.71–176.39 ng/µl. When the Mirvana uninfected and infected samples were compared, the uninfected samples gave a range of 201.78–342.35 ng/µl whilst the infected samples gave a range of 111.57–554.71 ng/µl ().
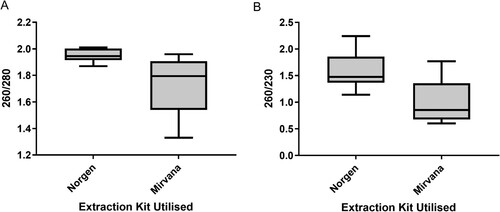
The Norgen kit gave a 260/280 absorbance ratio range of 1.87–2.01 and a mean of 1.95, whilst the Mirvana kit gave a range of 1.33–1.96 and a mean of 1.73 () suggesting that samples extracted using the Norgen kit resulted in lower levels of protein contamination overall (). The Norgen kit gave a 260/230 ratio range of 1.14–2.24 and mean of 1.58, whilst the Mirvana kit gave a range of 0.6–1.77 and a mean of 1.0, inferring that samples extracted using the Norgen kit also resulted in lower levels of organic contamination overall. Norgen samples produced higher RIN values with a range of 1.2–2.4 (mean 2.2) with the Mirvana samples giving a range of 1–1.9 (mean 1.4).
Figure 2. Box-and-whisker plots of spectrophotometry data to to assess the quality and purity of RNA extracted from caecal content using Norgen and Mirvana kits. (A) 260/280 ratio in Norgen and Mirvana extraction kits. (B) 260/230 ratio in Norgen and Mirvana extraction kits. Whiskers represent minimum and maximum, box represents 25th and 75th centiles and line represents median.
miRNA sequencing
Following validation of RNA extraction methods, we proceeded to sequence miRNA extracted from caecal content samples collected from 26-day-old Cobb500 broiler chickens, using the Norgen kit.
Sequencing generated 181,950,730 raw reads, of which 81,013,797 were mappable against pre- and/or mature miRNAs in miRbase following exclusion of adapter and contaminant reads, reads that were <15 or >32 bases in length after removal of the 3′ adapter (3ADT), or where the 3′ adapter was not present. Identified miRNAs represented by 82,755 reads could be mapped to known G. gallus mature miRNAs, with a further 1,395,452 reads mapped directly to the G. gallus genome when the associated pre-miRNA identified in miRbase was also mapped to an avian species other than G. gallus (, groups 1a and 2a+2b, respectively). A further 57,917 reads were mapped in miRbase to avian mature and/or pre-miRNAs, but did not map to G. gallus miRNAs or genome (, group 3a). From the remaining reads, 9,669,508 did not map to miRbase but could be mapped to the G. gallus genome (16.3%), while 43,867,841 reads had no hit in any of the databases (54.1%). All remaining reads mapped to mRNAs or other RNAs.
Table 2. Read numbers from sequencing of RNA extracted from chicken caecal contents separated by mapping to known chicken (Gallus gallus domesticus) or other avian miRNAs, the chicken genome, and the presence or absence of predicted hairpins. The numbers of known and predicted unique miRNAs are identified within each group.
Differentially expressed miRNAs
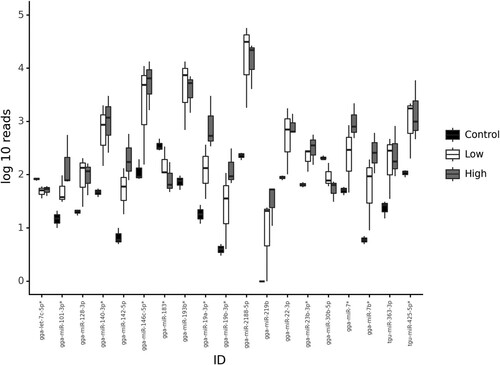
Comparison of sequence datasets identified 95 miRNAs that were differentially regulated between individual samples and groups (). Statistical analysis indicated that 19 miRNAs exhibit significantly altered expression in the caecal content of E. tenella-infected chickens, irrespective of lesion score, when compared to uninfected controls (16 upregulated, three down-regulated; ; t-test, False Discovery Rate (FDR) < 0.05). Eight miRNAs defined by significant up-regulation in infection were selected for further validation, including MiRNA gga-miR-7* (15-fold increase), gga-miR-2188-5p (105-fold increase), gga-miR-193b-3p* (78 fold increase), gga-miR-146c-5p* (51-fold increase), gga-miR-19a-3p* (39-fold increase), gga-miR-140-3p* (26-fold increase) and gga-miR-22-3p (10-fold increase) from group 2a, and MiRNA tgu-miR-425-5p* (18-fold increase) from group 3a.
Figure 3. Heatmap showing hierarchical clustering of miRNAs differentially expressed in caecal contents collected from chickens that were uninfected (control, X1-3), E. tenella-infected with no pathology (lesion score 0, X4-6) or E. tenella-infected with high pathology (lesion score 4, X7-9).
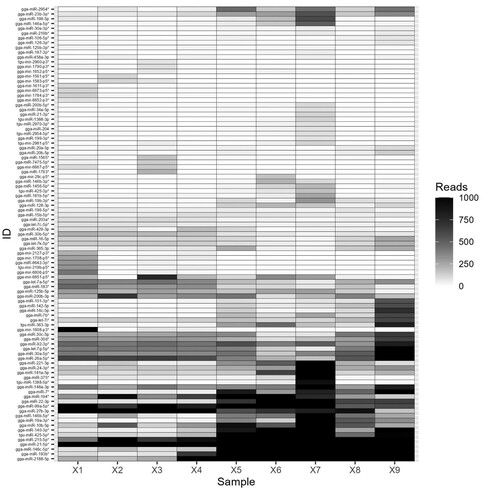
Figure 4. Box plot illustrating differential expression of miRNAs in caecal contents collected from chickens that were uninfected (control), E. tenella-infected with no pathology (low, lesion score 0) or E. tenella-infected with high pathology (high, lesion score 4). Whiskers represent minimum and maximum, box represents 25th and 75th centiles and line represents median.
Functional interpretation
Following identification of 19 miRNAs that were significantly differentially expressed in E. tenella-infected/uninfected chickens, we queried the miRNet (https://www.mirnet.ca), gene ontology resource (http://geneontology.org/) and Database for Annotation, Visualization and Integrated Discovery (DAVID) (https://david.ncifcrf.gov/) databases to identify predicted gene targets and subsequent downstream proteins, pathways, and biological processes which may be affected. Querying the gene ontology database, we found that predicted targets for these miRNAs included 384 genes. While the gene ontology database and DAVID did not identify statistically significantly altered pathways, hypergeometric testing of the KEGG database via miRNet (miRnada database) showed significant over-representation of the mucin type O-glycan biosynthesis pathway (adjusted P-value of 0.0016), showing six hits for gene targets GALNT16, GALNT6, GALNT12, GALNT14, GALNT5, and GCNT4. Of these differentially regulated genes, GALNT5 showed co-regulation by more than one miRNA (namely gga-miR-193b and gga-miR-128-3p).
qPCR validation of miRNA targets differentially expressed in the caecal contents of E. tenella-infected and uninfected chickens
In order to test the reproducibility of differentially expressed miRNAs in E. tenella infection, a second set of samples were collected from a duplicate experiment run 20 months after the first, providing independent biological replication. Samples used included caecal content from uninfected control chickens (n = 3), and E. tenella-infected chickens with no/low pathology (lesion scores 0 or 1, n = 3) or severe pathology (lesion score 4, n = 3).
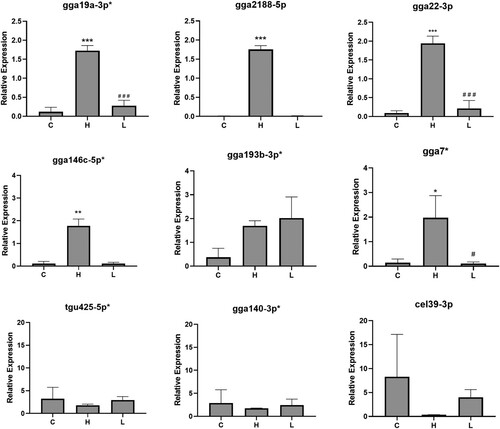
qPCR corroborated significant differential expression of five of the eight upregulated miRNAs identified from sequencing (). This demonstrated significant differential expression in caecal contents collected from infected chickens with high lesion scores (H) compared to infected birds with low lesion scores (L) and uninfected control birds (C). This included a 292-fold increase of gga2188-5p in the H group (P < 0.001, relative expression of 1.75+/−0.01 compared to 0.01+/−0.01 in controls, and 0.01+/−0.01 in the L group), a 16-fold increase of gga146c-5p_R-1 in the H group (relative expression of 1.77+/−0.31 compared to 0.11+/−0.01 in the C group, and 0.11+/−0.06 in the L group), 15-fold increase of gga19a-3p_1ss11TC in H group (relative expression of 1.72+/−0.14 compared to 0.12+/−0.12 in C group, and 0.28+/−0.14 in L group), 22-fold increase in gga22-3p in H group (relative expression of 1.94+/−0.19 compared to 0.09+/−0.06 in C group, and 0.21+/−0.21 in L group) and 14-fold increase in gga7 in H group (relative expression of 1.98+/−0.90 compared to 0.15+/−0.15 in C group, and 0.11+/−0.0.07 in L group).
Figure 5. qPCR validation of candidate differentially expressed miRNAs in caecal contents from chickens that were uninfected (control, C, n = 3), E. tenella-infected with high pathology (lesion score 4, H, n = 3), or E. tenella-infected with no/low pathology (lesion scores 0 or 1, L, n = 3). Error bars represent standard deviation of biological replicates. *** = P < 0.0001, ** = P < 0.01, and * = P < 0.05 compared to control. # = P < 0.05 and ### = P < 0.001 compared to high lesion score. Cel39-3p is a miRNA present in C. elegans and represents a negative control.
Validation in faecal samples
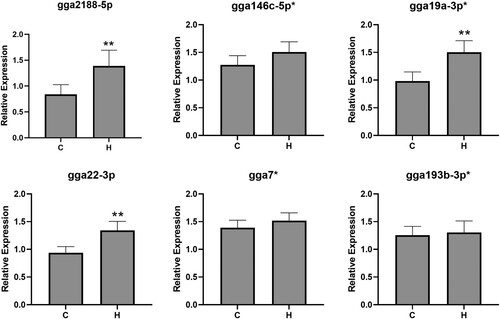
To demonstrate that miRNAs could also be extracted and amplified from faecal samples, and are reflective of differentially regulated miRNAs in caecal contents, we performed qPCR assays for six differentially regulated miRNAs using RNA extracted from caecal droppings (). This showed that three of the six miRNAs were also significantly upregulated in faecal material collected from infected high lesion score chickens compared to uninfected controls. These included gga2188-5p (1.6 fold increased expression, P < 0.01), gga19a-3p_1ss11TC (1.3 fold increased expression, P < 0.01), and gga22-3p (1.4 fold increased expression, P < 0.01).
Figure 6. qPCR of candidate differentially expressed miRNAs in faecal material from chickens that were uninfected (control, C, n = 4) or E. tenella-infected with high pathology (lesion score 3, H, n = 5). Error bars represent standard deviation of biological replicates. ** = P < 0.01 compared to control.
Discussion
Detection of Eimeria infection in poultry commonly relies on microscopy or post-mortem examination of dead or culled individuals. Recognition of infection prior to oocyst excretion is especially challenging, as is differentiation of severe from low-level disease. Timely awareness of Eimeria occurrence and the risk of clinical coccidiosis can improve productivity and welfare, informing on variables such as vaccine uptake and efficacy, as well as scheduling of anticoccidial drug use and rotation. Identification of robust biomarkers for Eimeria infection and/or increasing intestinal pathology can be used to develop new diagnostic tools to assist poultry husbandry. Faecal miRNAs have been proposed for use as non-invasive biomarkers of colonic and colorectal cancer (Yau et al., Citation2019) and may offer similar utility for detection of pathogens and host responses to infection, such as enteric inflammation. Here, we have demonstrated that it is possible to isolate and sequence miRNAs from chicken caecal and faecal content, demonstrating that faecal miRNAs could be used to non-invasively assess avian intestinal disease in a diagnostic capacity. Sequencing miRNAs in caecal contents collected from chickens with or without E. tenella infection revealed a panel of 95 differentially expressed miRNAs, 19 of which were significantly up- or down-regulated by infection regardless of severity (). Biological validation using qPCR to quantify expression levels for a subset of eight miRNAs revealed a significant association for five, with severity of disease (i.e. pathology, measured as intestinal lesion scores; ), with little or no difference between uninfected and apparently healthy infected chickens having little or no pathology. Finally, we quantified these eight miRNA candidates in the faeces of further biological replicates, demonstrating that three miRNAs were significantly upregulated in caecal faeces from infected chickens with high levels of pathology. These data suggest that the extraction techniques and qPCR methodology can successfully be applied to chicken faeces as a potential diagnostic for the onset of clinical coccidiosis, differentiating from uninfected individuals and those experiencing a low-level infection such as that resulting from vaccination using an attenuated vaccine.
One of the selected miRNA candidates (gga-miR-2188-5p) has previously been shown to be upregulated in the small intestinal tissue of chickens infected with E. necatrix (T.L. Liu et al., Citation2020). Identification of a panel of miRNAs that associate with pathology caused by infection with one or more Eimeria species offers opportunities for genus- and species-level diagnostics. These miRNAs showed large fold changes in the caecal content of infected birds, and may alone, or in combination with gga19a-3p or gga22-3p, form the basis of a non-invasive diagnostic faecal test for active E. tenella infection without the need for culling birds to perform post-mortem diagnosis.
In silico functional analysis of the miRNAs identified here revealed a significant over-representation of targets within the mucin type O-glycan biosynthesis pathway (adjusted P value of 0.0016), showing hits for six gene targets: GALNT16, GALNT6, GALNT12, GALNT14, GALNT5, GCNT4. Of these differentially regulated genes, GALNT5 showed co-regulation by more than one miRNA (namely gga-miR-193b and gga-miR-128-3p). Interestingly, the mucin type O-glycan biosynthesis pathway has been shown to be differentially regulated by miRNAs in the nasal mucosa of human patients with chronic rhinosinusitis (Xuan et al., Citation2019). It was speculated in this study that there was induction of goblet cell hyperplasia with chronicity which increased mucus layer production and exacerbated favourable growth conditions for pathogens. Intestinal mucus plays an important part in host–pathogen interactions. Intestinal mucus is also rich in mucin-type O-glycans and has been shown to form a critical protective layer between the intestinal lumen and the epithelial monolayer (Bergstrom & Xia, Citation2013). In the context of E. tenella infection, it has been shown that there is adherence of chicken intestinal mucins to the parasite which inhibits invasion in vitro (Tierney et al., Citation2007). This suggests that possible differential mucin synthesis would likely influence E. tenella infection. Further studies may be able to further elucidate the biological interactions of differentially regulated miRNAs identified herein, further refine their natural variation of expression in the faeces of uninfected and Eimeria-infected birds for diagnostic test development, and further define their sensitivity and specificity for different Eimeria species and the pathology induced by intestinal infections.
Acknowledgements
The authors gratefully acknowledge the Houghton Trust for awarding a Small Project research award which funded these studies, in addition to the Biotechnology and Biological Sciences Research Council (BBSRC) through grants BB/L004046/1 and BB/P021638/1 for the provision of experimental materials.
Disclosure statement
Authors JW and DB in conjunction with the Royal Veterinary College, have initiated a patent claim application relating to the use of faecal/caecal content miRNAs as a tool in the diagnosis of coccidiosis/intestinal inflammation in chickens.
Additional information
Funding
References
- Aunin, E., Böhme, U., Blake, D., Dove, A., Smith, M., Corton, C., Oliver, K., Betteridge, E., Quail, M.A., McCarthy, S.A., Wood, J., Tracey, A., Torrance, J., Sims, Y., Howe, K., Challis, R., Berriman, M. & Reid, A. (2021). The complete genome sequence of E. tenella (Tyzzer 1929), a common gut parasite of chickens. Wellcome Open Research, 6, 225.
- Bergstrom, K.S. & Xia, L. (2013). Mucin-type O-glycans and their roles in intestinal homeostasis. Glycobiology, 23, 1026–1037.
- Blake, D.P., Knox, J., Dehaeck, B., Huntington, B., Rathinam, T., Ravipati, V., Ayoade, S., Gilbert, W., Adebambo, A.O., Jatau, I.D., Raman, M., Parker, D., Rushton, J. & Tomley, F.M. (2020). Re-calculating the cost of coccidiosis in chickens. Veterinary Research, 51, 115.
- Carvalho, F.S., Wenceslau, A.A., Teixeira, M., Carneiro, J.A., Melo, A.D. & Albuquerque, G.R. (2011). Diagnosis of Eimeria species using traditional and molecular methods in field studies. Veterinary Parasitology, 176, 95–100.
- Chapman, H.D. (1999). Anticoccidial drugs and their effects upon the development of immunity to Eimeria infections in poultry. Avian Pathology, 28, 521–535.
- Chapman, H.D., Barta, J.R., Blake, D., Gruber, A., Jenkins, M., Smith, N.C., Suo, X. & Tomley, F.M. (2013). A selective review of advances in coccidiosis research. Advances in Parasitology, 83, 93–171.
- Chapman, H.D. & Jeffers, T.K. (2014). Vaccination of chickens against coccidiosis ameliorates drug resistance in commercial poultry production. International Journal for Parasitology: Drugs and Drug Resistance, 4, 214–217.
- Elwinger, K., Fisher, C., Jeroch, H., Sauveur, B., Tiller, H. & Whitehead, C.C. (2016). A brief history of poultry nutrition over the last hundred years. World’s Poultry Science Journal, 72, 701–720.
- Giles, T., Van Limbergen, T., Sakkas, P., Quinn, L., Belkhiri, A., Maes, D., Kyriazakis, I., Barrow, P. & Foster, N. (2020). Diagnosis of sub-clinical coccidiosis in fast growing broiler chickens by microRNA profiling. Genomics, 112, 3218–3225.
- Gyorke, A., Pop, L., & Cozma, V. (2013). Prevalence and distribution of Eimeria species in broiler chicken farms of different capacities. Parasite, 20, 50.
- Jenkins, M.C., Parker, C. & Ritter, D. (2017). Eimeria oocyst concentrations and species composition in litter from commercial broiler farms during anticoccidial drug or live Eimeria oocyst vaccine control programs. Avian Diseases, 61, 214–220.
- Johnson, J., & Reid, W. M. (1970). Anticoccidial drugs: lesion scoring techniques in battery and floor-pen experiments with chickens. Exp Parasitol, 28(1), 30-6.
- Lekchnov, E.A., Zaporozhchenko, I.A., Morozkin, E.S., Bryzgunova, O.E., Vlassov, V.V. & Laktionov, P.P. (2016). Protocol for miRNA isolation from biofluids. Analytical Biochemistry, 499, 78–84.
- Link, A., Becker, V., Goel, A., Wex, T. & Malfertheiner, P. (2012). Feasibility of fecal microRNAs as novel biomarkers for pancreatic cancer. PLoS One, 7, e42933.
- Liu, X., Liu, L., Zhang, M., Wang, H., Yang, N., & Li, X. (2016). Chicken cecal microRNAs in the response to Campylobacter jejuni inoculation by Solexa sequencing. Poult Sci, 95(12), 2819–2823.
- Liu, T. L., Fan, X.C., Wang, Y., Wang, Y.X., Wang, J.W., Song, J.K., & Zhao, G.H. (2020). Micro-RNA expression profile of chicken small intestines during Eimeria necatrix infection. Poult Sci, 99(5), 2444–2451.
- Long, P. L., Millard, B.J., Joyner, L.P., & Norton, C.C. (1976). A guide to laboratory techniques used in the study and diagnosis of avian coccidiosis. Folia Vet Lat, 6(3), 201–17.
- Livak, K. J., & Schmittgen, T. D. (2001). Analysis of relative gene expression data using real-time quantitative PCR and the 2(-Delta Delta C(T)) Method. Methods, 25(4), 402–8.
- Macdonald, S.E., Nolan, M.J., Harman, K., Boulton, K., Hume, D.A., Tomley, F.M., Stabler, R.A. & Blake, D.P. (2017). Effects of Eimeria tenella infection on chicken caecal microbiome diversity, exploring variation associated with severity of pathology. PLoS One, 12, e0184890.
- Peek, H.W. & Landman, W.J. (2003). Resistance to anticoccidial drugs of Dutch avian Eimeria spp. field isolates originating from 1996, 1999 and 2001. Avian Pathology, 32, 391–401.
- Peek, H.W., Ter Veen, C., Dijkman, R. & Landman, W.J. (2017). Validation of a quantitative Eimeria spp. PCR for fresh droppings of broiler chickens. Avian Pathology, 46, 615–622.
- Tierney, J.B., Matthews, E., Carrington, S.D. & Mulcahy, G. (2007). Interaction of Eimeria tenella with intestinal mucin in vitro. Journal of Parasitology, 93, 634–638.
- Xuan, L., Luan, G., Wang, Y., Lan, F., Zhang, X., Hao, Y., Zheng, M., Wang, X. & Zhang, L. (2019). MicroRNAs regulating mucin type O-glycan biosynthesis and transforming growth factor β signaling pathways in nasal mucosa of patients with chronic rhinosinusitis with nasal polyps in Northern China. International Forum of Allergy & Rhinology, 9, 106–113.
- Yau, T.O., Tang, C.M., Harriss, E.K., Dickins, B. & Polytarchou, C. (2019). Faecal microRNAs as a non-invasive tool in the diagnosis of colonic adenomas and colorectal cancer: a meta-analysis. Scientific Reports, 9, 9491.