
ABSTRACT
The accuracies of two molecular tests, PCR and loop-mediated isothermal amplification (LAMP) assay were compared with bacterial culture in detection of salmonella in poultry clinical samples. The icIR family transcriptional regulator gene was targeted and, out of 56 clinical specimens, 20 poultry field isolates were found positive for salmonella. Along with human isolates, reference strains of three different serovars, Salmonella Enteritidis (S. Enteritidis), S. Typhimurium and S. Infantis, were also tested. Eight different but genetically closely related bacterial genera (Klebsiella, Pseudomonas, Enterobacter, Campylobacter, Staphylococcus, Streptococcus, Escherichia and Pasteurella) were also used to evaluate the specificity of assay. The LAMP assay showed 80.8% sensitivity (95% CI, 0.66–0.95) and 100% specificity (95% CI, 0.71–1.00) when compared with microbiological culture and PCR, both with 100% sensitivity (95% CI, 0.87–1.00) and 100% specificity (95% CI, 0.71–1.00). High-resolution melt (HRM) curve analysis following PCR was able to differentiate between salmonella isolates based on their melting points, and all specimens were genotyped in three distinct HRM curve profiles. Each normalized melt curve profile represented one salmonella serotype and differences between the three melt profiles were correlated with nucleotide variations in the target gene sequences which demonstrated high discriminatory power of this technique. The colourimetric LAMP assay provided an alternative detection method capable of being used in the field, and showed analytical sensitivity for detection of 1 pg of salmonella DNA per reaction. The advantages and disadvantages of each test in detection of salmonella are discussed.
Introduction
Salmonella is an important enzootic pathogen and can also cause major foodborne illnesses in humans worldwide. Salmonella has more than 2500 serovars, and consumption of contaminated foods such as poultry and egg products could cause disease in humans. It is estimated that more than 90 million cases of diarrhoea-associated diseases in the world are caused by salmonella spp. annually (Majowicz et al., Citation2010). Salmonella Enteritidis (S. Enteritidis) and S. Typhimurium are the first and second most common salmonella serovars, respectively, that cause foodborne disease in humans globally. However, in Oceania and North America, S. Typhimurium is the most prevalent serovar, and S. Enteritidis is the second most commonly reported serovar (Hendriksen et al., Citation2011). Contaminated poultry meat and eggs are considered reservoirs for salmonella infections in humans (WHO, Citation2002). Routine monitoring of salmonella requires reliable and efficient detection methods. These methods usually rely on conventional microbiological culturing, serology or nucleic acid-based assays (Lee et al., Citation2015). The conventional microbiological culture-based methods require repeated subculturing sequentially in enrichment and selective media, followed by biochemical and serological tests (Schönenbrücher et al., Citation2008) which is consequently both labour intensive and time costly. Other antibody-based assays such as ELISA, can provide results in a shorter time-frame compared to culture-based methods (Park et al., Citation2014) but require time for antibody to be developed in the host. Molecular diagnostics, such as PCR and loop-mediated isothermal amplification (LAMP), have the potential to be rapid, sensitive and specific for detection of salmonella (Saeidabadi et al., Citation2017; Liu et al., Citation2019; Domesle et al., Citation2020; Vichaibun & Kanchanaphum, Citation2020; Ziros et al., Citation2020). Therefore, the aim of this study was to compare accuracy of PCR-high-resolution melt (PCR-HRM) curve analysis and colourimetric LAMP based diagnostics with bacterial culture in detection of salmonella serotypes in clinical specimens.
Materials and methods
Salmonella isolates
Three salmonella reference strains of known serovars (S. Infantis – IR1, S. Typhimurium – IR2 and S. Enteritidis – IR3) were sourced from the Veterinary Diagnostic Laboratory at Charles Sturt University. In addition, 56 poultry clinical samples submitted to the Microbiology Laboratory, School of Veterinary Medicine, Shiraz University (Iran) for testing, and another three archived salmonella isolates derived from human stool samples, were included in this study for use in PCR and LAMP assays. Isolation of salmonella using culture was adopted from previously published methods with slight modifications (Love & Rostagno, Citation2008; Donado-Godoy et al., Citation2012). One gram of a pool of five collected faecal samples, 10 g of minced meat from each sample or 10 ml chicken carcass rinse (Afshari et al., Citation2018) using sterile buffered peptone water (Thermo Fisher Scientific, Melbourne, Australia) was inoculated into 10 ml non-selective enrichment lactose broth (Thermo Fisher Scientific, Australia) and incubated at 37°C to 41°C for 24 h. One ml of pre-enrichment lactose broth was transferred into 10 ml of Rappaport-Vassiliadis broth (RV broth) (Thermo Fisher Scientific, Australia) and incubated at 37°C for 24 h. Then 100 μl of RV broth was streaked out on a selective xylose lysine deoxycholate agar plate (Thermo Fisher Scientific) and incubated 37°C for 24 h. The suspected black centred red colonies on xylose lysine deoxycholate agar plates were plated on nutrient agar (Thermo Fisher Scientific) and incubated at 37°C for 24 h. Two colonies per sample were selected, one colony was used to determine the serotype using White-Kauffman-Le Minor scheme (Grimont & Weill, Citation2007) and the other colony was used later for DNA isolation.
DNA isolation
The DNA extraction was performed on all samples using DNA isolation kit (MBST, Tehran, Iran) according to the manufacturer’s instructions. Briefly, 10 g of minced meat, 1 g of faecal sample or 1 ml of rinsed carcass buffered peptone water was lysed using lysis buffer and proteinase K at 55°C for 10 min. Binding buffer was added and samples were incubated at 70°C for 10 min. The total volume was transferred to a purification column, centrifuged, washed twice with washing buffer and DNA was eluted using distilled water. A colony from each salmonella reference strain was also used for DNA extraction using Wizard® Genomic DNA Purification Kit (Promega, Sydney, Australia). Extracted DNA samples were quantified using NanoDrop 2000 (Thermo Fisher Scientific), and subsequently diluted to 5 ng/μl for use in PCR and LAMP assay immediately, or for storage at −20°C for future use.
Primer design
The six LAMP primers including two outer primers (F3 and B3), two inner primers (FIP and BIP), and two loop primers (LF and LB) were designed using the Primer Explorer V5 software (Eiken Chemical Co., Tokyo, Japan). The LAMP primers were designed based on the Salmonella enterica subsp. enterica iclR family transcriptional regulator gene sequence (GenBank accession No. CP053865) (). Primers were ordered from Sigma Aldrich (Melbourne, Australia) and were HPLC-purified. All six primers were used in LAMP assay and primers B3 and F3 were used in PCR-HRM assay. The alignment of LAMP primers against the target DNA sequence is illustrated in .
Figure 1. Positions of PCR primers (F3 and B3) and LAMP primers in the iclR family transcriptional regulator gene of Salmonella enterica subsp. enterica serovar Enteritidis.
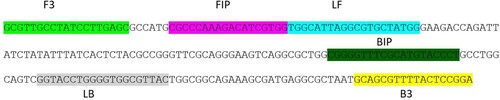
Table 1. Sequences of LAMP and PCR primers.
PCR and HRM curve analysis
The primers B3 and F3 targeted the icIR gene and were used for detection of salmonella strains/isolates in PCR and identification of serovars in HRM curve analysis. PCR amplifications were performed in 25 μl reaction volume on a Rotor-Gene™ 6000 thermal cycler (Qiagen, Melbourne, Australia). The reaction mixture contained 5 × GoTaq Green Flexi Reaction Buffer (Promega, Australia) and 1 U of Go Taq DNA Polymerase (Promega), 25 μM of each primer, 1.5 mM Mgcl2, 1250 μM of each dNTP, 5 μM SYTO 9 green fluorescent nucleic acid stain (Invitrogen, Melbourne, Australia), and 2 μl (10 ng) extracted genomic DNA. Thermocycling conditions for PCR included one cycle of 95°C for 3 min; 35 cycles of 95°C for 30 s, 55°C for 30 s and 72°C for 30 s; and a final cycle of 72°C for 2 min. PCR products from all specimens were first analysed by HRM and then subjected to agarose gel electrophoresis.
HRM curve acquisition and analysis
PCR was followed by HRM curve analysis in a Rotor-Gene 6000 thermal cycler (Qiagen). The PCR products were subjected to three different rampings of 0.1, 0.2 and 0.3°C s−1 between 72°C and 82°C to determine the optimal melting condition for differentiation of salmonella isolates. All specimens were tested in triplicates and their melting profiles analysed using the HRM algorithm included with the Rotor-Gene 1.7.27 software package. Normalization regions of 83.0–83.5°C and 90.5–91.0°C were used for analysis. Each salmonella reference strain was set as a “genotype”, and the average HRM genotype confidence percentage (GCP) (the value attributed to each isolate/strain compared with the genotype, with a value of 100% indicating an exact match) for the replicates was predicted by the software. The GCPs for known salmonella serovars were averaged and the standard deviations (SDs) calculated and used to establish the GCP range for salmonella serovar cut-off point. The cut-off point was applied in HRM analysis to evaluate the differentiation power of the test to discriminate the serovars.
Loop-mediated isothermal amplification
The LAMP reaction mixture consisted of WarmStart colourimetric 2X Master Mix (New England Biolabs, Melbourne, Australia), six primers including outer primers (F3 and B3) at 2 µM each, inner primers (FIP and BIP) at 16 µM each, loop primers (LF and LB) at 4 µM each and template DNA (10 ng) in a total volume of 20 μl. LAMP reactions were incubated for 60 min at 65°C in a heat block. Results were determined by visual observation of the LAMP reaction where a change in colour from red to yellow indicated successful amplification of salmonella DNA from the tested samples.
DNA sequencing and analysis of PCR amplicons
The PCR products were purified using the Wizard® SV Gel and PCR Clean-Up System (Promega) according to the manufacturer’s instructions. All PCR amplicons were sequenced in both directions using F3 and B3 primers by Australian Genome Research Facility Ltd (AGRF Ltd., Brisbane, Australia). Sequence data were analysed using multiple sequence alignments using ClustalW software (Thompson et al., Citation1994) and BioEdit Sequence Alignment Editor (version 6.0.9.0). GenBank accession numbers were assigned to the nucleotide sequences of the salmonella isolates and reference strains ().
Assay specificity and sensitivity analysis with limit of detection
The specificity of primers was confirmed via BlastN analysis to ensure no bacterial species sequences, except salmonella serotypes, matched with primer sequences with more than 80% identity. In order to evaluate specificity of the PCR and LAMP assay, DNA was also extracted from eight bacterial strains of genetically similar genera (Klebsiella pneumoniae subsp. Pneumoniae MGH78578 (ATCC 700721), Pseudomonas aeruginosa 109246 (ATCC BAA-1744), Enterobacter cloacae 1000654 (ATCC BAA-2468), Campylobacter coli CIP 7080 (ATCC 33559), Staphylococcus aureus HFH-29744 (ATCC BAA-1690), Streptococcus equi subsp. zooepidemicus HA-116 (ATCC 39920), Escherichia coli 1100101 (ATCC BAA-2471) and Pasteurella multocida subsp. multocida M-2283 (ATCC 21955)), and subsequently used as test samples in each assay. The analytical sensitivities of PCR and LAMP reactions to detect the minimum concentration of salmonella DNA were determined testing serial 10-fold dilutions of 1 ng/μl DNA extracted from salmonella specimens, up to a dilution of 10−8 ng/μl.
Comparison of clinical sensitivity and specificity of the evaluated detection methods
Microbiological culture of salmonella specimens was considered to be the gold standard test and accuracy, sensitivity and specificity of PCR and LAMP assays were compared against culture-based diagnosis using MEDCALC 2 × 2 contingency table (www.medcalc.org/calc/diagnostic_test.php).
Results
BlastN analysis of the target gene sequence against a Nucleotide collection (nr/nt) database provided by NCBI (https://blast.ncbi.nlm.nih.gov/Blast.cgi) with 500 entries of different serovars of salmonella, retrieved all with 100% sequence coverage and identity hits. In silico analysis via BlastN also confirmed the specificity of the designed primers, indicating that false positive or false negative results were unlikely to occur in the PCR or LAMP assays.
Detection and identification of salmonella isolates using PCR-HRM
PCR amplicons from all tested specimens, including reference strains and clinical specimens, were subjected to agarose gel electrophoresis, which identified a single DNA fragment of the expected size (about 220 bp) in positive samples (). Clinical samples that were negative in bacterial culture, along with PCR negative controls, all failed to produce an amplicon in PCR. Following PCR of samples containing three different serotypes, all amplicons were subjected to HRM curve analysis. Visual assessment of conventional and normalized curves at different ramp temperatures showed that 0.3°C s−1 produced three distinct conventional melt curves associated with PCR amplicons of the salmonella samples ((a)). All salmonella specimens produced two peaks in their conventional melt curves between 86.5°C–87.1°C and 89.7°C–90.3°C, respectively (). All S. Typhimurium serotypes produced two conventional curves at 86.6 ± 0.0°C and 89.5 ± 0.0°C. The S. Enteritidis serotypes produced two peaks at 86.6 ± 0.1°C and 89.8 ± 0.1°C and S. Infantis serotypes generated two peaks at 87.0 ± 0.1°C and 90.2 ± 0.0°C. All salmonella strains also produced three distinct normalized HRM curves ((b)). Replicates of each salmonella serotype were genotyped using reference genotypes in a normalized HRM graph with a GCP greater than cut-off point (). Slight variations in melting temperature of tested samples were observed in HRM curve analysis using templates from various DNA extractions and PCR runs on different days. However, there was no change to the conventional melt curve shapes and normalized graphs. The mean and SD of the melting point temperatures for the two peaks, and the mean GCP and SD generated from several runs of PCR and HRM curve analysis for all samples including reference strains are shown in .
Figure 2. (a) Conventional and (b) normalized melt curve analysis of PCR products of the iclR family transcriptional regulator gene of salmonella from three reference strains and 23 field isolates.
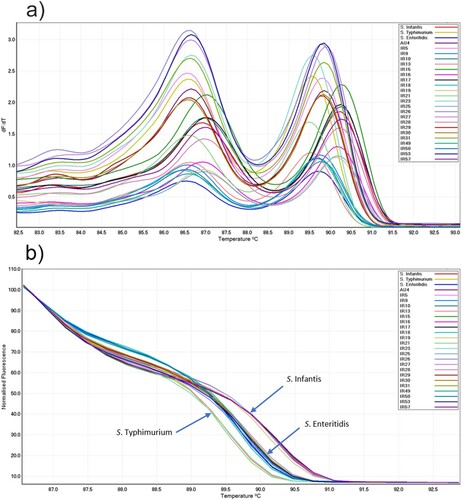
Table 2. Sample sources, PCR-HRM and LAMP assay results, including the mean ± SD of the melting points and GCP for each isolate/strain following PCR and HRM curve analysis.
Table 3. Genotyping of salmonella serovars using culture and HRM.
Objective differentiation of salmonella serovars using HRM curve analysis based on genotype confidence percentage values
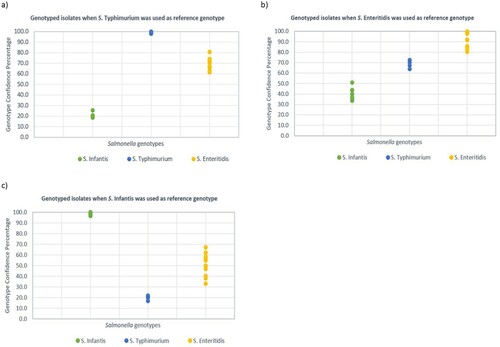
A mathematical model for differentiation of salmonella serovars was generated using GCP values of salmonella reference strains (S. Enteritidis, S. Typhimurium and S. Infantis). This model was used to evaluate the relationship of the field isolates without using visual interpretation of melt curves (subjective). The average 15 GCP values of S. Typhimurium and SD was 96 ± 5.3. A value of 3 × SD (15.9) was subtracted from the average GCP to calculate the cut-off point. Therefore, the GCP range for S. Typhimurium serovar and related field isolates was determined to be 80–100. A similar approach was used for the calculation of cut-off points for S. Enteritidis (83 ± 1.4, resulting GCP = 78.8) and S. Infantis (98.1 ± 1.1, resulting GCP = 94.8). When S. Typhimurium was used as reference genotype, and a cut-off point of 80 was applied, all amplicons from isolates related to S. Typhimurium had GCPs between 80 and 100 and were automatically genotyped as S. Typhimurium. All the other salmonella isolates unrelated to S. Typhimurium produced GCPs less than 80 and were automatically genotyped as “variation” by the software. Similarly, when S. Enteritidis and S. Infantis with calculated cut-off points (78.8 and 94.8, respectively) were used as reference genotypes, isolates with GCPs higher than the cut-off points were genotyped as reference strain serovar and all unrelated isolates produced a value less than cut-off points and therefore, were genotyped as variation (). The discrimination power of PCR-HRM in differentiation of salmonella serotypes was evaluated using different HRM settings when each reference strain (S. Infantis, S. Enteritidis and S. Typhimurium) was used as reference genotype individually, and the rest of samples were genotyped. Then the GCP values of each salmonella serotype were plotted in a dot plot diagram. The GCP gap between salmonella genotypes was greater (≥20) when S. Infantis or S. Typhimurium (≥30) were used as reference genotypes ().
Figure 3. The distribution of GCP values from salmonella isolates when different reference strains, (a) S. Typhimurium, (b) S. Enteritidis and (c) S. Infantis, were used as the reference genotype. The higher GCP gap between salmonella genotypes is correlated with higher discrimination power of HRM.
Detection of minor variations in the icIR gene nucleotide sequences by PCR-HRM curve analysis
In order to confirm whether differences between HRM curves associated with different salmonella reference strains used in this study were correlated with DNA sequence variation of their amplicons, DNA sequence of all amplicons from each distinct curve profile were compared using BioEdit alignment tool (). The S. Infantis isolates/strains showed five and six nucleotide variations in their amplicon sequence when compared with S. Enteritidis and S. Typhimurium, respectively. The S. Enteritidis isolates also showed six nucleotide differences when compared with S. Typhimurium isolates in the amplified DNA segment (). The sequence identities and diversities were also calculated (), and S. Infantis reference strain was found to have 95.9% and 97.7% sequence similarity with S. Typhimurium and S. Enteritidis, respectively.
Figure 4. Alignment and comparison of nucleotide sequences of the icIR gene amplicons of salmonella isolates/strains using CLUSTAL W. Identical nucleotides are shown by ‘.’
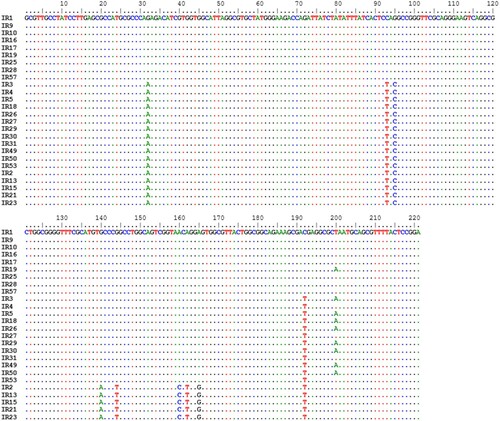
Table 4. Comparison of percentage sequence identity and diversity of salmonella isolates/strains in their iclR gene.
Detection of salmonella isolates using LAMP assay
The DNA isolated from positive controls (salmonella reference strains), and 18 out of 23 salmonella isolates was successfully amplified in the LAMP assay, inducing a change of colour of the reaction mix from red to yellow. All negative specimens in bacterial culture and five positive specimens (IR5, IR9, IR10, IR13 and IR18) did not show a change in reaction colour and remained red similar to negative controls.
Sensitivity and specificity of the PCR and LAMP
The sensitivities of PCR and LAMP assays were evaluated using 10-fold serial dilutions of 1 ng of extracted DNA from the reference strain S. Enteritidis serotype. Positive results were obtained up to a dilution of 10−4 ng in PCR, and up to a dilution of 10−3 ng in LAMP assay indicating that the sensitivity of PCR was 10 times higher than that of the LAMP assay. The specificity of PCR and LAMP assays was evaluated by testing eight unrelated bacterial strains of genetically similar genera (Klebsiella, Pseudomonas, Enterobacter, Campylobacter, Staphylococcus, Streptococcus, Escherichia and Pasteurella) in both assays. Using these bacterial strains, both PCR and LAMP assays returned negative results. The specificity of both assays was 100% as confirmed by DNA sequencing of salmonella serotypes tested in this study. The performance of PCR and LAMP assays in detecting salmonella in clinical samples was evaluated against bacterial culture-based diagnosis as the gold standard test via a 2 × 2 contingency table. The sensitivity (100%) and specificity (100%) of PCR were found to be similar to bacterial culture-based diagnosis. For the LAMP assay, while the specificity was found to be high (100%), the sensitivity was found to be relatively lower (80.77%) due to five false negative results. In terms of salmonella typing, HRM curve analysis had higher sensitivity (100%) in typing of salmonella serotypes compared to bacterial culture (88.46%) in our laboratory, and both methods were equally (i.e. 100%) specific. The LAMP assay, by itself, was not designed to be capable of salmonella typing.
Discussion
The majority of salmonellosis in humans is caused by the consumption of poultry products contaminated with salmonella (Gast, Citation2013; Ehuwa et al., Citation2021). In total, there are six salmonella subspecies, of which one subspecies (S. enterica subspecies enterica) has more than 2500 serotypes including S. enterica subspecies enterica serotype Enteritidis (S. Enteritidis) and S. enterica subspecies enterica serotype Typhimurium (S. Typhimurium), which are important in terms of food safety. In the poultry industry, Salmonellosis can cause significant economic losses, and therefore early diagnosis and effective control are crucial, both requiring significant investment of resources and effort. Selective enrichment and culturing of samples is considered to be the primary isolation method and gold standard test for the detection of salmonella in a variety of clinical samples including faeces (Eriksson & Aspan, Citation2007; Love & Rostagno, Citation2008; Donado-Godoy, et al., Citation2012; Rodríguez et al., Citation2018; Ohanu et al., Citation2019; Wang et al., Citation2020). While isolation of salmonella strains using enrichment and culture is considered to be very sensitive, results usually take up to 1 week to become available, making culture-based diagnostics relatively expensive in terms of both time costs and resources. Consequently, in the past few decades, increasing emphasis has been placed on molecular diagnostics based on amplification of DNA from target pathogens using techniques such as PCR and LAMP. These techniques have been used to develop various bacterial and viral detection assays for the management and control of infectious diseases. Such assays are now widely used because they offer high sensitivity, specificity, accuracy and rapid turn-around time to provide results. In this study, we compared bacterial culture with two molecular diagnostic methods (PCR-HRM and LAMP) in detection of salmonella in clinical samples. The developed LAMP assay produced relatively acceptable sensitivity (80.77%) and specificity (100%), with a turn-around time of a 120 min. Results from PCR, which was found to have an equal accuracy compared to the culture-based diagnosis, were available in 180 min. Therefore, LAMP assay was found to be superior in terms of the turn-around time for results. Genotyping of isolates using HRM curve analysis following PCR also was completed within 20 min. In addition, all DNA amplification and detection steps using PCR-HRM and LAMP assay were conducted in one closed-cap tube which reduced cross contamination risk. PCR-HRM curve analysis has potential as a sensitive and specific method to detect and discriminate between salmonella serotypes. At least 38 salmonella serotypes have been identified in poultry and poultry products, and it is believed that prevalence of salmonella serotypes in humans and animals varies in different countries or continents (Ferrari et al., Citation2019). In order to assess the distribution profile of salmonella serotypes, it is important for clinical samples from a large geographical region to be tested. In our study, only three serotypes were detected. A higher number of samples and/or samples from different geographical regions may provide a better distribution profile of serotypes. PCR-HRM curve analysis was found to not only accurately detect salmonella but was also capable of genotyping isolates. All three different serotypes of salmonella isolates (S. Enteritidis, S. Typhimurium and S. Infantis) were genotyped accurately using PCR-HRM, which was confirmed with sequencing of PCR amplicons. Although isolation and serotyping of samples are performed through culture-based methods in some laboratories, lengthy turnaround times and the need for expert interpretation of results are significant limitations associated with these methods, particularly when a large number of samples are to be tested. PCR-HRM curve analysis offers an alternative means to detect and serotype clinical samples in this regard, as it demonstrated high sensitivity in detection of salmonella, along with high discriminatory power for differentiation of salmonella genotypes. While all samples tested via PCR-HRM generated a single similarly sized amplicon (≈220 bp) on agarose gel electrophoresis, three different genotypes were identified by HRM curve analysis through three different melting curves. Variation in melt curves was a reflection of differences in their DNA sequences (). Sequencing the 221-nucleotide amplicons generated via PCR, there were six nucleotide differences between S. Infantis and S. Typhimurium DNA sequences that resulted in the differentiation of conventional and normalized melt curves. The difference in melt curves of S. Enteritidis and S. Typhimurium was also related to six nucleotide differences between sequences of these strains in the amplified segment of the icIR gene. Optimal HRM curves can be affected by poor DNA quality and quantity (Wong et al., Citation2019). Based on our experience in our laboratory, optimization of PCR in order to amplify a highly specific amplicon is a key element in increasing the reliability and discriminatory power of HRM curve analysis, and evaluation of HRM curve profiles could be improved when equal quantities of amplicons are used for comparison (Ghorashi et al., Citation2011). The cost of PCR-HRM curve analysis for each reaction was not very different from conventional PCR and interpretation of results was simplified using a mathematical model which enabled application of cut-off points for differentiation of each genotype. Objective interpretation of results based on generated GCPs by each sample was carried out without requiring extensive visual interpretation of melt curves. This will be helpful when a large number of samples are to be tested. The disadvantage of the PCR-HRM method was the requirement for a laboratory setting and using an expensive machine capable of HRM curve analysis. The LAMP assay is based on using auto-cycling strand displacement DNA synthesis using isothermal amplification of DNA which requires minimal laboratory instruments (Notomi et al., Citation2000). The LAMP assay is expected to be sensitive and specific through use of four specific primers annealing to six distinct segments of target gene, and will be completed in 60 min under isothermal conditions. The result is colourimetric and can be determined by visual observation with minimal technical expertise. Several previous studies have reported the use of LAMP in detection of salmonella (Okamura et al., Citation2008; Yang et al., Citation2014; Yang et al., Citation2016; Youn et al., Citation2017; Domesle et al., Citation2018; Waldman et al., Citation2020). The sensitivity of LAMP assays in these studies is reported to be either equal to or higher than PCR, which is likely attributable to the use of four to six primers to amplify target DNA, as opposed to only two used in traditional PCR assays (Notomi, et al., Citation2000). Furthermore, in our study LAMP assay showed lower laboratory (10−3 ng DNA) and clinical (80.77%) sensitivities compared to those of PCR (10−4 ng DNA and 100%, respectively). All three assays showed comparable laboratory and clinical sensitivity and specificity, showing equal specificity (100%) but lower sensitivity by LAMP assay (80.77%). The lower sensitivity of an assay could be due to the quality of samples before DNA extraction. A recent systemic review and meta-analysis of diagnostic test accuracies, which included 81 studies and 65 research articles, concluded that the quality of samples could potentially influence the sensitivity of LAMP assays (Subsoontorn et al., Citation2020). In addition, when the laboratory sensitivities of PCR and LAMP assay were evaluated via 10-fold serial dilutions of genomic DNA from S. Enteritidis, LAMP assay was found to be 10 times less sensitive than PCR. This indicated that for successful detection of salmonella in LAMP assay, at least 10−3 ng (1 pg) of bacterial DNA is required. However, the detection limit of LAMP assay in our study was found to be higher than what has been reported previously (Shen et al., Citation2020). The detection limit or sensitivity of LAMP assay using pure salmonella culture, among 100 reports, has been reported to be between 5 fg and 5.6 ng per reaction or between 1 and 106 CFU (Yang et al., Citation2018). In our study the LAMP detection limit was found to be 10−3 ng DNA which is equivalent to 178 CFU and lies among relatively sensitive LAMP assays. In contrast with some reports (Fang et al., Citation2018; Hu et al., Citation2018; Papadakis et al., Citation2018), we found that LAMP assay was less sensitive than PCR in detection of salmonella which could be due to the presence of inhibitors. However, the lower sensitivity of LAMP compared to PCR in detection of salmonella has previously been reported (Deguo et al., Citation2008). Up to 12% false-negative rate in LAMP assay has been reported (Pu et al., Citation2022). The specificities of LAMP assay, PCR and culture method were found to be 100%. There were no false-positive results in PCR and LAMP assay testing salmonella-negative samples or bacterial strains unrelated to salmonella. The lower sensitivity of LAMP compared to PCR-HRM is a limitation of colourimetric LAMP assay that requires careful consideration when LAMP is used as a diagnostic tool. In addition, PCR has the potential to be used as a quantitative assay while LAMP lacks this capability. While the LAMP assay was found to have a lower sensitivity relative to PCR-HRM, both assays have their own merits. The sensitivity of LAMP assay could be improved if LAMP primers were selected from a different gene. LAMP assays offer better turn-around times, and, given that it is a colourimetric assay where interpretation does not require substantive expertise, these tests can be deployed at the point-of-care without using sophisticated laboratory instruments. Furthermore, PCR-HRM curve analysis was found to be a robust test for the detection and genotyping of salmonella isolates in a laboratory setting. Both assays have the potential to be used for rapid detection of salmonella outbreaks in the poultry industry and can contribute to the improvement of disease control and management.
Ethical statement
The study was performed on opportunistic samples that were already submitted for diagnostic purposes to Veterinary Diagnostic Laboratory at CSU and were not collected for the specific purpose of this project, therefore, no permission from Animal Care and Ethics Committee was required.
Acknowledgements
The authors would like to thank Dr Mohammad Saeidabadi, Associate Professor Peter Groves and Veterinary Diagnostic Laboratory at CSU for providing salmonella DNA samples and cultures and scientific advice.
Disclosure statement
No potential conflict of interest was reported by the authors.
Additional information
Funding
References
- Afshari, A., Baratpour, A., Khanzade, S. & Jamshidi, A. (2018). Salmonella Enteritidis and Salmonella Typhimorium identification in poultry carcasses. Iranian Journal of Microbiology, 10, 45–50.
- Deguo, W., Guicheng, H., Fugui, W., Yonggang, L. & Daxi, R. (2008). Drawback of loop-mediated isothermal amplification. African Journal of Food Science, 1, 083–086.
- Domesle, K.J., Yang, Q., Hammack, T.S. & Ge, B. (2018). Validation of a Salmonella loop-mediated isothermal amplification assay in animal food. International Journal of Food Microbiology, 264, 63–76.
- Domesle, K.J., Young, S.R., Yang, Q. & Ge, B. (2020). Loop-mediated isothermal amplification for screening Salmonella in animal food and confirming Salmonella from culture isolation. Journal of Visualized Experiments, 159, e61239.
- Donado-Godoy, P., Gardner, I., Byrne, B.A., Leon, M., Perez-Gutierrez, E., Ovalle, M.V., Tafur, M.A. & Miller, W. (2012). Prevalence, risk factors, and antimicrobial resistance profiles of Salmonella from commercial broiler farms in two important poultry-producing regions of Colombia. Journal of Food Protection, 75, 874–883.
- Ehuwa, O., Jaiswal, A.K. & Jaiswal, S. (2021). Salmonella, food safety and food handling practices. Foods, 10, 907.
- Eriksson, E. & Aspan, A. (2007). Comparison of culture, ELISA and PCR techniques for salmonella detection in faecal samples for cattle, pig and poultry. BMC Veterinary Research, 3, 21.
- Fang, J., Wu, Y., Qu, D., Ma, B., Yu, X., Zhang, M. & Han, J. (2018). Propidium monoazide real-time loop-mediated isothermal amplification for specific visualization of viable Salmonella in food. Letters in Applied Microbiology, 67, 79–88.
- Ferrari, R.G., Rosario, D.K.A., Cunha-Neto, A., Mano, S.B., Figueiredo, E.E.S. & Conte-Junior, C.A. (2019). Worldwide epidemiology of Salmonella serovars in animal-based foods: a meta-analysis. Applied and Environmental Microbiology, 85, e00591–e00519.
- Gast, R.K. (2013). Salmonella infections. In D.E. Swayne, J.R. Glisson, L.R. McDougald, L.K. Nolan, D.L. Suarez & V.L. Nair (Eds.), Diseases of Poultry 13 ed. (pp. 677–706). Aims, IA: Wiley-Blackwell.
- Ghorashi, S.A., O’Rourke, D., Ignjatovic, J. & Noormohammadi, A.H. (2011). Differentiation of infectious bursal disease virus strains using real-time RT-PCR and high resolution melt curve analysis. Journal of Virological Methods, 171, 264–271.
- Grimont, P.A.D. & Weill, F. (2007). Antigenic formulae of the Salmonella serovars. WHO collaborating centre for reference and research on Salmonella 9th edn., from https://www.pasteur.fr/ip/portal/action/WebdriveActionEvent/oid/01s-000036-089.
- Hendriksen, R.S., Vieira, A.R., Karlsmose, S., Lo Fo Wong, D.M., Jensen, A.B., Wegener, H.C. & Aarestrup, F.M. (2011). Global monitoring of Salmonella serovar distribution from the World Health Organization Global Foodborne Infections Network Country Data Bank: results of quality assured laboratories from 2001 to 2007. Foodborne Pathogens and Disease, 8, 887–900.
- Hu, L., Ma, L.M., Zheng, S., He, X., Hammack, T.S., Brown, E.W. & Zhang, G. (2018). Development of a novel loop-mediated isothermal amplification (LAMP) assay for the detection of Salmonella ser. Enteritidis from egg products. Food Control, 88, 190–197.
- Lee, K.-M., Runyon, M., Herrman, T.J., Phillips, R. & Hsieh, J. (2015). Review of Salmonella detection and identification methods: aspects of rapid emergency response and food safety. Food Control, 47, 264–276.
- Liu, Z., Zhang, Q., Yang, N.N., Xu, M.G., Xu, J.F., Jing, M.L., Wu, W.X., Lu, Y.D., Shi, F. & Chen, C.F. (2019). Rapid and sensitive detection of Salmonella in chickens using loop-mediated isothermal amplification combined with a lateral flow dipstick. Journal of Microbiology and Biotechnology, 29, 454–464.
- Love, B.C. & Rostagno, M.H. (2008). Comparison of five culture methods for Salmonella isolation from swine fecal samples of known infection status. Journal of Veterinary Diagnostic Investigation, 20, 620–624.
- Majowicz, S.E., Musto, J., Scallan, E., Angulo, F.J., Kirk, M., O’Brien, S.J., Jones, T.F., Fazil, A., Hoekstra, R.M. & International Collaboration on Enteric Disease 'Burden of Illness' Studies. (2010). The global burden of nontyphoidal Salmonella gastroenteritis. Clinical Infectious Diseases, 50, 882–889.
- Notomi, T., Okayama, H., Masubuchi, H., Yonekawa, T., Watanabe, K., Amino, N. & Hase, T. (2000). Loop-mediated isothermal amplification of DNA. Nucleic Acids Research, 28, E63.
- Ohanu, M.E., Iroezindu, M.O., Maduakor, U., Onodugo, O.D. & Gugnani, H.C. (2019). Typhoid fever among febrile Nigerian patients: prevalence, diagnostic performance of the Widal test and antibiotic multi-drug resistance. Malawi Medical Journal: The Journal of Medical Association of Malawi, 31, 184–192.
- Okamura, M., Ohba, Y., Kikuchi, S., Suzuki, A., Tachizaki, H., Takehara, K., Ikedo, M., Kojima, T. & Nakamura, M. (2008). Loop-mediated isothermal amplification for the rapid, sensitive, and specific detection of the O9 group of Salmonella in chickens. Veterinary Microbiology, 132, 197–204.
- Papadakis, G., Murasova, P., Hamiot, A., Tsougeni, K., Kaprou, G., Eck, M., Rabus, D., Bilkova, Z., Dupuy, B. & Jobst, G. (2018). Micro-nano-bio acoustic system for the detection of foodborne pathogens in real samples. Biosensors and Bioelectronics, 111, 52–58.
- Park, S.H., Aydin, M., Khatiwara, A., Dolan, M.C., Gilmore, D.F., Bouldin, J.L., Ahn, S. & Ricke, S.C. (2014). Current and emerging technologies for rapid detection and characterization of Salmonella in poultry and poultry products. Food Microbiology, 38, 250–262.
- Pu, R., Liu, S., Ren, X., Shi, D., Ba, Y., Huo, Y., Zhang, W., Ma, L., Liu, Y., Yang, Y. & Cheng, N. (2022). The screening value of RT-LAMP and RT-PCR in the diagnosis of COVID-19: systematic review and meta-analysis. Journal of Virological Methods, 300, 114392.
- Rodríguez, F.I., Procura, F. & Bueno, D.J. (2018). Comparison of 7 culture methods for Salmonella serovar Enteritidis and Salmonella serovar Typhimurium isolation in poultry feces. Poultry Science, 97, 3826–3836.
- Saeidabadi, M.S., Nili, H., Dadras, H., Sharifiyazdi, H., Connolly, J., Valcanis, M., Raidal, S. & Ghorashi, S.A. (2017). Evaluation of PCR and high-resolution melt curve analysis for differentiation of Salmonella isolates. Avian Pathology, 46, 319–331.
- Schönenbrücher, V., Mallinson, E.T. & Bülte, M. (2008). A comparison of standard cultural methods for the detection of foodborne Salmonella species including three new chromogenic plating media. International Journal of Food Microbiology, 123, 61–66.
- Shen, H., Wen, J., Liao, X., Lin, Q., Zhang, J., Chen, K., Wang, S. & Zhang, J. (2020). A sensitive, highly specific novel isothermal amplification method based on single-nucleotide polymorphism for the rapid detection of Salmonella pullorum. Frontiers in Microbiology, 11, 1–9.
- Subsoontorn, P., Lohitnavy, M. & Kongkaew, C. (2020). The diagnostic accuracy of isothermal nucleic acid point-of-care tests for human coronaviruses: a systematic review and meta-analysis. Scientific Reports, 10, 22349.
- Thompson, J.D., Higgins, D.G. & Gibson, T.J. (1994). CLUSTAL w: improving the sensitivity of progressive multiple sequence alignment through sequence weighting, position-specific gap penalties and weight matrix choice. Nucleic Acids Research, 22, 4673–4680.
- Vichaibun, V. & Kanchanaphum, P. (2020). Quantitative LAMP and PCR detection of Salmonella in chicken samples collected from local markets around Pathum Thani Province. Thailand. International Journal of Food Science, 2020, 8833173.
- Waldman, J., Souza, M.N., Fonseca, A.S.K., Ikuta, N. & Lunge, V.R. (2020). Direct detection of Salmonella from poultry samples by DNA isothermal amplification. British Poultry Science, 61, 653–659.
- Wang, L., Xue, L., Guo, R., Zheng, L., Wang, S., Yao, L., Huo, X., Liu, N., Liao, M., Li, Y. & Lin, J. (2020). Combining impedance biosensor with immunomagnetic separation for rapid screening of Salmonella in poultry supply chains. Poultry Science, 99, 1606–1614.
- WHO. (2002). Risk assessments of Salmonella in eggs and broiler chickens. In: Microbiological risk assessment series 2. World Health Organization/Food and Agriculture Organization of the United Nations., from http://www.fao.org/docrep/fao/005/y4392e/y4392e00.pdf.
- Wong, S.A., Woodgate, R.G., Pant, S.D. & Ghorashi, S.A. (2019). Rapid detection of Bovicola ovis using colourimetric loop-mediated isothermal amplification (LAMP): a potential tool for the detection of sheep lice infestation on farm. Parasitology Research, 119, 395–401.
- Yang, Q., Domesle, K.J. & Ge, B.i. (2018). Loop-mediated isothermal amplification for Salmonella detection in food and feed: current applications and future directions. Foodborne Pathogens and Disease, 15, 309–331.
- Yang, Q., Domesle, K.J., Wang, F. & Ge, B. (2016). Rapid detection of Salmonella in food and feed by coupling loop-mediated isothermal amplification with bioluminescent assay in real-time. BMC Microbiology, 16, 112.
- Yang, Q., Wang, F., Prinyawiwatkul, W. & Ge, B. (2014). Robustness of Salmonella loop-mediated isothermal amplification assays for food applications. Journal of Applied Microbiology, 116, 81–88.
- Youn, S.Y., Jeong, O.M., Choi, B.K., Jung, S.C. & Kang, M.S. (2017). Application of loop-mediated isothermal amplification with propidium monoazide treatment to detect live Salmonella in chicken carcasses. Poultry Science, 96, 458–464.
- Ziros, P.G., Kokkinos, P.A., Papanotas, K. & Vantarakis, A. (2020). Loop-mediated isothermal amplification (LAMP) for the detection of Salmonella spp. isolated from different food types. Journal of Microbiology, Biotechnology and Food Sciences, 9, 152–161.