
ABSTRACT
Worldwide outbreaks make infections with pathogenic strains of Enterococcus cecorum (EC) one of the most important diseases in the broiler industry. Although research has increased knowledge about the pathogen, the transmission is not fully understood. Samples from different locations were collected from two broiler farms in Germany over a total of six production cycles. Samples were collected at days 1, 5, 10, 15, 21, 27, 34, 41 post-hatch and after cleaning and disinfection (C&D). A total of 1017 samples were collected from 25 different locations on the farms. Samples were analysed in the laboratory for EC by quantitative real-time PCR. Overall, 7.5% of the samples were positive. The probabilities for positive and negative samples did not differ between the farms. The number of findings differed significantly between the cycles. Compared to other samples, the chances of detecting EC in faecal samples were significantly higher. Most positive samples were found in the last week of the production periods, indicating an accumulation of EC in the barn environment. After C&D, positive PCR results were obtained in four out of 14 locations. A re-introduction from contaminated environment seemed possible. However, one pooled faecal sample was positive 1 day post-hatch. The locations that showed positive results after C&D and the positive faecal sample 1 day post-hatch indicated the persistence of EC in broiler houses of clinically healthy flocks that could lead to potential horizontal transmission routes. The present study detected potential EC sources and may help to improve hygienic measures to avoid transmissions.
RESEARCH HIGHLIGHTS
Methodology is suitable to detect EC during production and after C&D.
Locations were detected that may serve as a reservoir for EC.
Cycles with fewer positive samples were observed.
Cleaning and disinfection had a major impact on the detection of EC.
Introduction
Enterococcus cecorum (EC) was initially described in 1983 as Streptococcus cecorum and was considered a benign resident of the normal gut microbiota in chickens (Devriese et al., Citation1983, Citation1991). The first outbreaks of pathogenic strains were observed in the Netherlands and Scotland in 2002 (Devriese et al., Citation2002; Wood et al., Citation2002). Over the past two decades, outbreaks have been repeatedly documented in different parts of the world, thus making EC one of the most important pathogens in broiler chickens (Stalker et al., Citation2010; Robbins et al., Citation2012; Aitchison et al., Citation2014; Jung & Rautenschlein, Citation2014; Talebi et al., Citation2016).
Affected broiler and broiler breeder flocks become conspicuous due to increased mortality as well as increased condemnation rates at the slaughterhouse (Stalker et al., Citation2010; Makrai et al., Citation2011; Jung & Rautenschlein, Citation2014). Mortality rates of up to 15%, morbidity of up to 35% and condemnation rates of up to 10.6% have been documented (Borst et al., Citation2012; Schreier et al., Citation2021). During the first 3 weeks of an EC infection, birds do not show typical clinical signs, but a slight increase in mortality can be observed, with pericarditis and hepatitis being striking pathological observations (Robbins et al., Citation2012; Jung & Rautenschlein, Citation2014). The subsequent phase is characterized by increasing mortality, lameness and typical paralysis. Paralysed birds rest on their hocks with both legs extended cranially due to an inflammatory mass in the 6th thoracic vertebra compressing the overlying thoracolumbar spinal cord (Makrai et al., Citation2011; Robbins et al., Citation2012; Borst et al., Citation2017). Borst et al. (Citation2017) showed that intestinal colonization of control birds with EC started at the third week of life, whereas EC in case birds was detected in the intestine and spleen in the first week.
It has been suggested that an oral infection during the first day post-hatch can lead to an infection and is the most likely transmission route of EC (Martin et al., Citation2011; Borst et al., Citation2017; Schreier et al., Citation2021). Although vertical transmission cannot be excluded, no evidence of this has been published to date (Kense & Landman, Citation2011; Robbins et al., Citation2012). There are reports of outbreaks being carried over into the subsequent cycle, so it can be assumed that EC can persist in the farm environment (De Herdt et al., Citation2009; Borst et al., Citation2017). For instance, dust from animal houses originates from feed, litter, skin, dried faeces and feathers (Harry, Citation1978). Microorganisms can be carried over by dust particles from remaining dust in the barn or from contaminated dust in the environment. It has been shown that most bacterial microorganisms isolated from dust are Gram-positive cocci and that dust can serve as a reservoir and carrier for multi-drug resistant Enterococcus spp. (Hartung & Saleh, Citation2007; Liu et al., Citation2018).
In poultry houses, cleaning and disinfecting the building after each cycle, including the anteroom, changing shoes and overalls at the entrance, as well as vermin control, are mandatory to prevent horizontal transmission and foodborne zoonoses (van de Giessen et al., Citation1998). Paul et al. (Citation2019) compared farms according to EC risk level. Farms with lower risk levels achieved better cleanliness scores than those with higher risk levels. Another risk factor that has been described is the influence of temperature. It is known that EC outbreaks occur more frequently during the summer months and that heat stress has a positive effect on the development of various diseases (Quinteiro-Filho et al., Citation2012; Tsiouris et al., Citation2018; Li et al., Citation2021; Schreier et al., Citation2022; Dunnam et al., Citation2023).
However, selective cultivation of EC is very difficult and attempts to detect EC in the environment using cultivation methods have mostly failed (Robbins et al., Citation2012; Borst et al., Citation2017; Grund et al., Citation2022). Therefore, Jung et al. (Citation2017) developed a quantitative real-time PCR assay that appears to be highly specific and more sensitive than the classical cultivation method.
Despite the increasing importance of EC as a multi-drug resistant pathogen, knowledge about transmission routes and alternative treatment options is still limited (Nielsen et al., Citation2022). The aim of this study was to test and establish a sampling scheme to detect EC in the poultry farm environment and to identify contaminated locations that can be used for surveillance and targeted for cleaning and disinfection (C&D).
Materials and methods
Ethical statement
Sampling procedures were in accordance with the German Animal Welfare Act and the regulations on the welfare of animals used for experiments or for other scientific purposes. The experiments did not include any invasive procedure involving the animals. The study design was reviewed and received approval from the Animal Welfare Officer of the University of Veterinary Medicine Hannover, Foundation, Hannover, Germany (TVO-2022-V-76).
Sampling scheme
For EC detection, environmental samples were collected from two forced ventilated broiler farms in Germany, housing 37,500 (farm A) and 45,000 (farm B) birds (Ross 308, Aviagen, Huntsville, AL, USA), respectively. Both farms showed no clinical signs of EC-related diseases during the present study and mortality rates at the end of each cycle on farm A (1.74%, 1.57% and 1.69%, respectively) and farm B (1.69%, 1.93% and 2.12%, respectively) were not increased. Farm B had an outbreak of EC approximately 6 months prior to the study and was selected to investigate whether EC strains were still circulating on the farm and to identify differences to farm A that had no pathogenic EC history. Sets of samples were collected over the course of three production cycles from both farms (each lasting approximately 42 days). On days 1, 5, 10, 15, 21, 27, 34, 41 and after C&D, dust and faecal samples were collected from different locations according to a defined sampling scheme ( and ). The first sampling was conducted after placement of birds at day 1 post-hatch. For each location, either two wipes (AlphaWipe® TX1004 Dry Cleanroom Wipers, Non-Sterile, Texwipe, Kernersville, NC, USA), two boot swabs (A04148, Sterisox tryp 2 pairs, SODIBOX, Nevez, France) or two polyester knit swabs (Alpha® Sampling Swab TX 715, Texwipe) were pooled and stored for transport.
Table 1. Total number of samples collected at different locations during the production period.
Table 2. Total number of samples collected at different locations after C&D.
During the production periods, 13 different locations or materials were sampled using either polyester swabs or wipes. Furthermore, two pooled faecal samples were collected (faeces container 30 ml with red screw cap and spatula, VWR, Leuven, Belgium) on each sampling day during the production period. For each pooled faecal sample, six droppings were collected. Within the first production period, an outbreak of avian influenza was detected in the vicinity of farm B and it was therefore not possible to take samples at the last sampling day on that farm. Furthermore, it was not possible to collect eggshell samples at the first day of the first production period in both farms as these had been completely removed from the broiler house. C&D on both farms was carried out by external companies and included wet cleaning and disinfection with peracetic acids (farm A) or aldehydes (farm B). After C&D and prior to housing new broiler chicks in the barns, air exhausts, air supplies, anterooms, barn gates, boot profiles, breather tubes, doors connecting the anteroom with the barn, heaters, inside of feeding and drinking lines, insulation hoses, surface of the main feeding line, power sockets, wastewater pipes and winches were sampled. Additionally, boot swabs were used to sample the ground of the barn. The numbers of samples collected from each location at each sampling day during the production period are shown in . Samples that were collected after C&D are displayed in . In total, 1017 samples were taken and analysed.
Preparation
Prior to each sampling, 20 wipes were moistened with 40 ml PBS buffer and 14 polyester swabs were moistened with 10 ml PBS buffer in autoclavable containers and autoclaved. The sampling material was stored at 4°C until the day of sampling.
Wipe samples
On the door that connected the anteroom to the barn, sampling was performed on the surface of the door frame and handles using a total of two wipes. Tools coming into direct contact with the barn (shovel, euthanasia pliers, fishing net) were sampled by wiping the entire surface thereof with two wipes. Sampling was performed at four air inlets from each side of the barn using two wipes for each side. The window sills, the silicone strip (which kept the flap closed) and the upper half of the outer area of the flaps were sampled. The air exhaust was either located at the rear of the barn or under the roof. One wipe was rotated once in the inner wall of each of the two sampled wind tunnels at the two main exhaust fans. Two wipes were tied separately to the end of a threaded rod with a piece of wire for sampling four vertical feeding lines which led into the feed hoppers. The threaded rod was 1 m long and bent at the 60 cm mark. The wipes were inserted 60 cm into the pipes and removed while the threaded rod was being rotated. There were four feed hoppers installed at the front of each barn. A total of four wipes were used for sampling the feed hoppers, these being rotated once on the inner surface of the feed hoppers. Feed was delivered to the pan feeders via four feeding lines. Two feeding lines were sampled in the middle of the barn. Two wipes were used to take samples from the surface of these feeding lines. To collect the dust from these, samples were taken at the distance between two pan feeders which were also sampled. One wipe was used for the entire surface of three pan feeders from one feeding line. A total of two wipes were used for the pan feeders.
After C&D, the surface of the anteroom, the barn gate and the main pipe that distributed the feed to the four vertical feed lines were sampled. Two wipes were used for each location and each sample was applied over an area of approximately 30 cm × 20 cm, with a focus on dusty areas. Additionally, the entire surface of four winches was sampled using a total of two wipes. For wastewater, the plugs were opened at four locations in the barn. Two wipes were rotated once around the inside of each wastewater pipe. Door, tool, air supply and air exhaust sampling were carried out after C&D, the same as in the production period. After sampling, pairs of wipes from each location were pooled and stored in sterile stomacher bags (Whirl-Pak® Standard Bags – 710 ml, Fisher Scientific SAS, Illkirch, France).
Swab samples
Each polyester swab was used for the surface and cups of three drinking nipples within a drinking line. The sampling procedure was repeated for four drinking lines on each sampling day during the production period. Four heaters and four boots were sampled in each barn. A total of four polyester swabs were used for each location to take samples from an area covering ca. 10 cm × 10 cm. Direct surface swabbing was used for two carcass buckets by rotating two polyester swabs once along the inner side of the buckets at the junction of the bottom and the side. In two cycles on each farm, the entire surface of two eggshells was sampled on the first day post-hatch using a total of two polyester swabs.
After C&D, the inside of two drinking and feeding lines and four breather tubes were sampled by inserting four polyester swabs for each location 10 cm into the tubes and removing them with a circular motion. For drinking and feeding lines, sampling was performed at the beginning and end of each respective line. The same process was performed for two insulation hoses, except that only two polyester swabs were used. In addition, the entire surface of two power sockets was sampled with two polyester swabs. Heaters and boots were sampled in the same way as during the production period, except that only one pooled sample was collected for each location. After sampling, pairs of polyester swabs from each location were pooled and stored in sterile tubes (Tube 50 ml, 114 × 28 mm, PP Sarstedt AG & Co. KG, Nümbrecht, Germany).
Faecal samples
Two pooled faecal samples were collected at each sampling day during the production period. Each faecal sample contained six droppings from three different locations on one side of the barn. Samples were collected using sterile tubes with sampling spoons (faeces container 30 ml with red screw cap and spatula, VWR, Leuven, Belgium). After sampling, the pooled faecal samples were mixed with one cotton swab (cotton swabs 15 cm sterile, metal, 2 mm head, WDT, Garbsen, Germany) each for 1 min. After mixing, the tips of these swabs were cut off with sterile scissors and stored in two separate 1.5 ml sterile Eppendorf tubes (Eppendorf AG, Hamburg, Germany).
Boot swabs
After C&D, two pairs of boot swabs were pulled over a new pair of overboots (PE overboots 38 × 47 cm, WIROS Wilfried Rosbach GmbH, Willich, Germany). The ground of both diagonals of each barn was sampled with one boot swab pair each. After sampling, both pairs were pooled and stored in a sterile stomacher bag.
Transport and storage
Four cold packs, chilled to −20°C, were placed in a rigid and waterproof cooler prior to departure. After sampling, all samples were stored in the cooler and transported to the laboratory within 3 h.
At the laboratory
Twenty ml of PBS buffer were added to each stomacher bag containing wipes. A total of 100 ml PBS buffer was added to the pooled boot swab samples. Each stomacher bag was homogenized for 2 min at 240 rpm. The liquid from each bag was transferred to a centrifuge tube.
A total of 5 ml of PBS buffer was added to each of the pooled polyester swab samples that were stored in sterile tubes. The tubes were vortexed for 1 min at 4500 rpm. From each tube, 1 ml of liquid was transferred to a 1.5 ml Eppendorf tube and centrifuged for 5 min at 20,000× g. The supernatant was discarded and the pellet was stored at 4°C for further processing. The Eppendorf tubes containing cotton swabs from faecal samples were directly stored at 4°C.
DNA isolation and PCR
DNA was isolated from the pellets of the polyester swab samples, boot swabs, wipes and cotton swabs of the faecal samples. A commercial isolation kit (InnuPrep DNA Mini Kit 2.0, Analytik Jena AG, Jena, Germany) was used in accordance with the manufacturer's instructions. The extracted DNA was stored at 4°C. Quantitative real-time PCR (qPCR) was performed for each sample in duplicate on 96-well plates (Applied Bio-systems™, Fisher Scientific GmbH, Schwerte, Germany) using the QuantStudio 3 Real-Time-PCR-System (Thermo Fisher Scientific Inc., Waltham, MA, USA). PCR analysis was performed as previously described by Jung et al. (Citation2017) with half the volumes of the reagents and with 40 instead of 45 cycles. Each well contained the following mixture of reagents: 0.25 μl EGFP-1-F, 0.25 μl EGFP-10-R, 0.25 μl EGFP-Hex (internal control, Qiagen GmbH, Hilden, Germany), 0.5 μl qEcec_for, 0.5 μl qEcec_rev, 0.25 μl qEcec_probe (EC-specific primers and probe), 5 μl PerfeCTa ToughMix (Quantabio LLC, Beverly, MA, USA), 0.25 μl internal control Intype IC-DNA (Qiagen GmbH, Hilden, Germany) and 1 μl template in a total volume of 10 μl. The cycler procedure started with an initial denaturation at 95°C for 10 min, followed by 40 cycles of 95°C for 15 s and 60°C for 60 s. A cycle threshold value of 36 was used as a cut-off, such that all results below this value were considered positive.
Statistical analyses
Results were statistically analysed with SAS 9.4 software (SAS Institute Inc., Cary, NC, USA). A logistic regression model was used to evaluate statistically significant differences between, farms, cycles, and farm*cycle interaction. A second logistic regression model calculated the probabilities of positive results from locations at different sampling days during the production period. For this purpose, samples that did not show any positive results or were collected after C&D were excluded. Differences were considered statistically significant at P ≤ 0.05. Furthermore, odds ratios were calculated to estimate significant differences between the results at different sampling locations. For calculation of odds ratios, locations that did not show any positive results or were exclusively collected after C&D were excluded. Such locations included anterooms, barn gates, breather tubes, eggshells, feed hoppers, inside drinking and feeding lines, insulation hoses, main feeding lines, power sockets, the ground, vertical feeding lines, wastewater pipes and winches.
Results
Farms and cycles
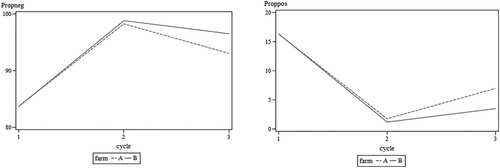
Out of a total of 1017 collected samples from both farms within three production periods and three C&D periods each, 76 were found to be positive for EC via qPCR. On farm A, 43 (12.0%) positive samples were collected, while on farm B, 33 (15.1%) positive samples were collected. When comparing both farms, no statistically significant differences were found in terms of EC occurrence (). The logistic regression model showed statistically significant differences concerning probabilities of positive results between all three cycles within each farm, but no statistically significant effect was found for farm*cycle interaction.
Figure 1. Probability of negative (left) and positive (right) samples during all cycles on both farms. The logistic regression model showed statistically significant differences between results during cycles on each farm. No statistically significant differences were found when comparing farms and no farm*cycle interaction was shown.
Sampling days
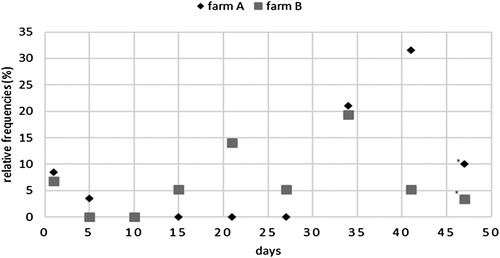
Regarding sampling days, the number of positive results tended to increase towards the end of the production period (). Samples from air exhausts, boot profiles, carcass buckets, drinking nipples, faeces and tools showed significant increasing probabilities for positive results as the production period progressed. Interestingly, positive results were already detected at day 1 (9/118) and day 5 (2/114). For instance, one faecal sample was positive 1 day post-hatch, and one boot profile showed a positive result at day 5. At day 10, no positive samples were collected. Between the second and third week, positive results were again detected. The peak with the most positive results was found at day 34 (23/114 (20%)) and day 41 (20/95 (21%)). After C&D, four previously positive locations became negative. One location remained positive and three locations, which were sampled solely after C&D, showed positive findings. In total, eight out of 120 (7%) samples were tested positive (7%) after C&D.
Figure 2. Relative frequency of positive samples on each sampling day to total positive samples for each farm. *Sampling day after C&D.
Locations
Results are summarized in and . Eleven out of 25 locations did not show any positive results. From these 11 locations that consistently showed negative results during all cycles on each farm, eight were exclusively sampled during the cleaning period. Most positive samples were found for air exhausts (6/53), boot profiles (12/100), carcass buckets (7/47) and faecal samples (16/94). The odds for positive results from air supplies (0.29), doors (0.19) and heaters (0.26) were significantly lower than those for faecal samples (Table 3, Supplemented Material). The anterooms, insulation hoses and winches also showed positive findings but were exclusively sampled after C&D. One location (air supplies) remained positive after C&D. Three other locations (anterooms, insulation hoses, winches) tested only in the C&D period also remained positive after C&D.
Discussion
The aim of this study was to investigate the occurrence of EC in different farm locations. The results obtained by qPCR analysis provided valuable insights into the dynamics of EC in the barn and how C&D influences its presence. The overall detection rate of EC was found to be 7.5% (76 out of 1017 samples) on the two farms. The high sensitivity of the qPCR assay used in this study was mainly due to its ability to detect parts of the genome of EC, whereas cultivation detects living bacteria that proliferate (Jung et al., Citation2017). Nevertheless, qPCR results should be interpreted with caution, as not only viable bacteria are detected. Positive results may occur even though no infectious bacteria are present. However, cultivation of EC can be challenging and they might be overgrown by other microorganisms (Avberšek et al., Citation2021). Therefore, qPCR seemed to be a useful method to detect potential transmission sources in broiler barns. Since commensal and pathogenic strains both show positive qPCR results, a differentiation between commensals and pathogenic was not possible.
EC-related diseases have already occurred on farm B in the past but no clinical signs of EC-related diseases were observed during the study. Additionally, three cycles of birds without clinical signs were placed between the first outbreak and the first sampling day. Thus, a persistence of pathogenic EC appears to be very unlikely. It is conceivable that pathogenic strains did not persist on farm B. This would explain the fact that the two farms showed no differences in the probabilities of detecting EC. Furthermore, the two farms showed statistically significant differences between probabilities of positive results when comparing subsequent cycles. This might be a result of different colonization dynamics within production cycles. For instance, the lowest number of positive locations was found during the second cycle on both farms (5/346). Infected and colonized birds shed high levels of EC by faeces and can therefore spread the pathogen throughout the broiler house via contaminated particles (Harry, Citation1978; Hartung & Saleh, Citation2007; Jung & Rautenschlein, Citation2014; Borst et al., Citation2017; Liu et al., Citation2018). Only one faecal sample on each farm showed positive results during the second cycle, whereas four faecal samples on farm A and six faecal samples on farm B showed positive results during the first cycle. It can be assumed that fewer birds were colonized during this production cycle and consequently the environment and sampling locations showed fewer positive results. Due to the spread of faecal particles through the dust, the frequent occurrence of positive samples at different locations, especially at the beginning of the production period, could be an indication of an outbreak.
There was a small number of positive results at day 1 (9/118) and day 5 (2/114) including a positive faecal sample. These early detections might be a result of transmitted EC from prior production cycles because, even after C&D, EC could have been detected on both farms at different locations. The positive faecal sample might be a result of an early colonization and it cannot be excluded that this happened in the hatchery or during transport. Further studies should be conducted to investigate transmission routes from outside into the barn. Interestingly, EC was not detected at any location at day 10 although it had been detected previously in the barns. This might be a random result; however, between the second and the third week, positive samples increased and peaked at days 34 (23/114) and 41 (20/95). This indicates a progressive colonization and is consistent with the later intestinal colonization mentioned in the introduction. The lower detection rate on farm B at day 41 could be explained by the fact that, in the first cycle, in which most samples were positive, no sampling was carried out at day 41. In contrast, early colonization with pathogenic EC would lead to lameness and increased mortality rates (Jung & Rautenschlein, Citation2014). Jung et al. (Citation2017) found significant differences between broiler cycles with and without EC-associated diseases. For example, the detection rates using cloacal swabs were already significantly higher on the day the birds arrived on the farm and remained positive until the end of the cycle.
It has been documented that EC was detected in subsequent production periods, thus indicating the survival of the pathogen in the barn environment (De Herdt et al., Citation2009; Borst et al., Citation2017). In the present study, all positive locations at day 41 showed negative results after C&D which indicates a successful reduction after implementing these measures. However, positive locations were found even after C&D, which may have been a result of transmissions from previous production periods. Pathogenic strains are known to be even more persistent on different surfaces than commensal strains and can therefore outlast the cleaning period and re-enter the barn (Grund et al., Citation2021). Thus, the barn environment could be a reservoir after insufficient C&D. This underlines the importance of efficient C&D measures to break potential infection chains.
The efficiency of detection was probably influenced by the sampling methods as well as the bacterial burden and DNA amount. When interpreting the results, it should be considered that these factors could have affected the results. For instance, it can be assumed that faecal samples are a major source because colonized birds shed high amounts of EC and DNA from EC. The concentration of faecal particles in dust in laying hen barns is approximately less than 10% (Müller & Wieser, Citation1987). Therefore, the number of EC and EC nucleic acids is relatively reduced in dust. This would explain the significantly higher probability of finding EC in faecal samples than in dust from heaters, for instance. However, locations with less positive findings may play a more important role concerning re-introduction into the barn. Faeces are removed with the litter in the C&D period and surfaces are commonly wet cleaned and disinfected. Other locations in which EC was found are either difficult to clean or are rarely cleaned and disinfected. These included air exhausts, tools, drinking nipples, pan feeders, heaters, doors and air supplies. A similar observation was made in a study by Luyckx et al. (Citation2015), where drinking cups, drain holes and floor cracks were identified as critical locations in broiler houses concerning C&D measures. In contrast to Grund et al. (Citation2022), in the present study no EC DNA was detected inside the drinking systems and fewer samples were positive from drinking nipples compared to other locations. However, positive nipples may be a direct source for oral uptake of EC and the results support that accurate C&D of drinking lines is recommended in broiler barns.
A factor that might have influenced the detection was intensified C&D on both farms after the first production period. On farm A, the farmer was dissatisfied with the procedure of the external cleaning company, and on farm B there was an outbreak of avian influenza in a barn close to the farm and an outbreak of salmonellosis in one of the neighbouring barns. Subsequently, on farm A, a second C&D was carried out by the farmer after the first production period. On farm B, for the following two production cycles, only disposable overalls were used, different workers were assigned to the barns, no vehicles were allowed near the barn and C&D were intensified. The third production period on farm B showed fewer positive results (6/173), which could be due to the intensified C&D as well as implemented management methods. It is known that thorough C&D procedures in poultry houses are essential to prevent transmissions between the cycles (van de Giessen et al., Citation1998).
This study provides valuable insights into the detection and distribution of E. cecorum in different locations at farms, facilitating better understanding of potential transmission sources and control of the pathogen. At that stage, C&D should become mandatory to prevent EC infections and transmission as C&D has a major impact on the detection of EC in the barn environment. Paul et al. (Citation2019) showed that higher cleanliness scores lower the risk of an EC outbreak. It is suggested that qPCR is a useful method to control C&D measures. If EC commensals, as an indicator, are reduced or eradicated successfully by C&D measures, there is no reason that pathogenic strains would not be. Finally, future comparative studies with qPCR and cultivation of EC from the barn environment may confirm this hypothesis. The first promising research using cultivation of EC on X-Gluc containing selective media has recently been published (Tessin et al., Citation2023).
Supplemental Material
Download MS Word (17.9 KB)Acknowledgements
We wish to thank the farmers who delivered necessary information about the flocks and allowed us to publish this information. Furthermore, we would like to thank Mrs. Butenholz for her laboratory support.
Disclosure statement
No potential conflict of interest was reported by the authors.
Additional information
Funding
References
- Aitchison, H., Poolman, P., Coetzer, M., Griffiths, C., Jacobs, J., Meyer, M. & Bisschop, S. (2014). Enterococcal-related vertebral osteoarthritis in South African broiler breeders: a case report. Journal of the South African Veterinary Association, 85, 1077.
- Avberšek, J., Mićunović, J., Šemrov, N. & Ocepek, M. (2021). Surveillance of the source of poultry infections with Enterococcus hirae and Enterococcus cecorum in Slovenia and E. hirae antibiotic resistance patterns. New Microbiologica, 44, 210–216.
- Borst, L.B., Suyemoto, M.M., Robbins, K.M., Lyman, R.L., Martin, M.P. & Barnes, H.J. (2012). Molecular epidemiology of Enterococcus cecorum isolates recovered from enterococcal spondylitis outbreaks in the southeastern United States. Avian Pathology, 41, 479–485.
- Borst, L.B., Suyemoto, M.M., Sarsour, A.H., Harris, M.C., Martin, M.P., Strickland, J.D., Oviedo, E.O. & Barnes, H.J. (2017). Pathogenesis of enterococcal spondylitis caused by Enterococcus cecorum in broiler chickens. Veterinary Pathology, 54, 61–73.
- De Herdt, P., Defoort, P., Van Steelant, J., Swam, H., Tanghe, L., Van Goethem, S. & Vanrobaeys, M. (2009). Enterococcus cecorum osteomyelitis and arthritis in broiler chickens. Vlaams Diergeneeskundig Tijdschrift, 78, 44–48.
- Devriese, L.A., Cauwerts, K., Hermans, K. & Wood, A.M. (2002). Enterococcus cecorum septicemia as a cause of bone and joint lesions resulting in lameness in broiler chickens. Vlaams Diergeneeskundig Tijdschrift, 71, 219–221.
- Devriese, L.A., Dutta, G.N., Farrow, J.A.E., van de Kerckhove, A. & Phillips, B.A. (1983). Streptococcus cecorum, a new species isolated from chickens. International Journal of Systematic and Evolutionary Microbiology, 33, 772–776.
- Devriese, L.A., Hommez, J., Wijfels, R. & Haesebrouck, F. (1991). Composition of the enterococcal and streptococcal intestinal flora of poultry. Journal of Applied Microbiology, 71, 46–50.
- Dunnam, G., Thornton, J.K. & Pulido-Landinez, M. (2023). Characterization of an emerging Enterococcus cecorum outbreak causing severe systemic disease with concurrent leg problems in a broiler integrator in the southern United States. Avian Diseases, 67, 137–144.
- Grund, A., Rautenschlein, S. & Jung, A. (2021). Tenacity of Enterococcus cecorum at different environmental conditions. Journal of Applied Microbiology, 130, 1494–1507.
- Grund, A., Rautenschlein, S. & Jung, A. (2022). Detection of Enterococcus cecorum in the drinking system of broiler chickens and examination of its potential to form biofilms. European Poultry Science, 86, 1–15.
- Harry, E.G. (1978). Air pollution in farm buildings and methods of control: a review. Avian Pathology, 7, 441–454.
- Hartung, J. & Saleh, M. (2007). Composition of dust and effects on animals. Landbauforschung Völkenrode, 308, 111–116.
- Jung, A. & Rautenschlein, S. (2014). Comprehensive report of an Enterococcus cecorum infection in a broiler flock in Northern Germany. BMC Veterinary Research, 10, 311.
- Jung, A., Petersen, H., Teske, L. & Rautenschlein, S. (2017). Colonization patterns of Enterococcus cecorum in two different broiler production cycles detected with a newly developed quantitative real-time PCR. BMC Microbiology, 17, 106.
- Kense, M.J. & Landman, W.J.M. (2011). Enterococcus cecorum infections in broiler breeders and their offspring: molecular epidemiology. Avian Pathology, 40, 603–612.
- Li, W.H., Liu, Y.L., Lun, J.C., He, Y.M. & Tang, L.P. (2021). Heat stress inhibits TLR4-NF-kappaB and TLR4-TBK1 signaling pathways in broilers infected with Salmonella Typhimurium. International Journal of Biometeorology, 65, 1895–1903.
- Liu, M., Kemper, N., Volkmann, N. & Schulz, J. (2018). Resistance of Enterococcus spp. in dust from farm animal houses: a retrospective study. Frontiers in Microbiology, 9, 3074.
- Luyckx, K.Y., Van Weyenberg, S., Dewulf, J., Herman, L., Zoons, J., Vervaet, E., Heyndrickx, M. & De Reu, K. (2015). On-farm comparisons of different cleaning protocols in broiler houses. Poultry Science, 94, 1986–1993.
- Makrai, L., Nemes, C., Simon, A., Ivanics, E., Dudas, Z., Fodor, L. & Glavits, R. (2011). Association of Enterococcus cecorum with vertebral osteomyelitis and spondylolisthesis in broiler parent chicks. Acta Veterinaria Hungarica, 59, 11–21.
- Martin, L.T., Martin, M.P. & Barnes, H.J. (2011). Experimental reproduction of enterococcal spondylitis in male broiler breeder chickens. Avian Diseases, 55, 273–278.
- Müller, W. & Wieser, P. (1987). Dust and microbial emissions from animal production. In D. Strauch (Ed.), Animal production and environmental health (pp. 47–89). Amsterdam: Elsevier.
- Nielsen, S.S., Bicout, D.J., Calistri, P., Canali, E., Drewe, J.A., Garin-Bastuji, B., Gonzales Rojas, J.L., Gortazar, C., Herskin, M., Michel, V., Miranda Chueca, M.A., Padalino, B., Pasquali, P., Roberts, H.C., Spoolder, H., Stahl, K., Velarde, A., Viltrop, A., Winckler, C., Baldinelli, F., Broglia, A., Kohnle, L. & Alvarez, J. (2022). Assessment of listing and categorisation of animal diseases within the framework of the Animal Health Law (Regulation (EU) No 2016/429): antimicrobial-resistant Enterococcus cecorum in poultry. EFSA Journal, 20, e07126.
- Paul, R., Glenn, P., Eric, C., & Denis, C. (2019). Enterococcus cecorum in broilers: a survey in farm to identify risky zootechnical practices. Paper presented at the Journées de la recherche Avicole et Palmipèdes à Foie Gras (pp. 116–120). Paris, France.
- Quinteiro-Filho, W.M., Gomes, A.V.S., Pinheiro, M.L., Ribeiro, A., Ferraz-de-Paula, V., Astolfi-Ferreira, C.S., Ferreira, A.J. & Palermo-Neto, J. (2012). Heat stress impairs performance and induces intestinal inflammation in broiler chickens infected with Salmonella Enteritidis. Avian Pathology, 41, 421–427.
- Robbins, K.M., Suyemoto, M.M., Lyman, R.L., Martin, M.P., Barnes, H.J. & Borst, L.B. (2012). An outbreak and source investigation of enterococcal spondylitis in broilers caused by Enterococcus cecorum. Avian Diseases, 56, 768–773.
- Schreier, J., Rautenschlein, S. & Jung, A. (2021). Different virulence levels of Enterococcus cecorum strains in experimentally infected meat-type chickens. PLoS One, 16, e0259904.
- Schreier, J., Rychlik, I., Karasova, D., Crhanova, M., Breves, G., Rautenschlein, S. & Jung, A. (2022). Influence of heat stress on intestinal integrity and the caecal microbiota during Enterococcus cecorum infection in broilers. Veterinary Research, 53, 110–118.
- Stalker, M.J., Brash, M.L., Weisz, A., Ouckama, R.M. & Slavic, D. (2010). Arthritis and osteomyelitis associated with Enterococcus cecorum infection in broiler and broiler breeder chickens in Ontario, Canada. Journal of Veterinary Diagnostic Investigation, 22, 643–645.
- Talebi, A., Taifebagherlu, J., Sharifi, A. & Delkhosh-Kasmaie, F. (2016). Spondylitis in broiler breeder farms in West-Azerbaijan province, Iran: clinical report. Veterinary Research Forum, 7, 353–355.
- Tessin, J., Rohde, J., Jung, A., Kemper, N. & Schulz, J. (2023). Research note: preliminary results, first detection of Enterococcus cecorum from environmental samples by streaking on X-Gluc containing selective media. Poultry Science, 103, 103253.
- Tsiouris, V., Georgopoulou, I., Batzios, C., Pappaioannou, N., Ducatelle, R. & Fortomaris, P. (2018). Heat stress as a predisposing factor for necrotic enteritis in broiler chicks. Avian Pathology, 47, 616–624.
- van de Giessen, A.W., Tilburg, J.J.H.C., Ritmeester, W.S. & van der Plas, J. (1998). Reduction of campylobacter infections in broiler flocks by application of hygiene measures. Epidemiology and Infection, 121, 57–66.
- Wood, A.M., MacKenzie, G., McGillveray, N.C., Brown, L., Devriese, L.A. & Baele, M. (2002). Isolation of Enterococcus cecorum from bone lesions in broiler chickens. Veterinary Record, 150, 27.