
ABSTRACT
Reducing traffic volumes and CO2-emissions from freight transport has proven difficult in many countries. Although the increasing suburbanization of warehouses is seen as a relevant land use trend, comprehensive analyses of their impact remain scarce. This study uses real data in modeling transport, costs, environmental and modal effects from warehouse relocations around Oslo and Trondheim (Norway). Results indicate that for Oslo, traffic performance (ton-km), CO2-emissions, and transport costs increase following warehouse suburbanization. For Trondheim, transport performance and CO2-emissions increase less, while transport costs decrease marginally. We conclude that specific case characteristics (geography and trade patterns) are important in determining the strength and direction of effects, and expect that common concomitant developments (warehouse centralization and consolidation) would lead to more pronounced results. Our findings confirm some, but challenge other, findings from the relatively scarcely literature available. Finally, the study's more general insights and observations can help advance similar analyses beyond Norway.
1. Introduction
Large-scale societal transformations are necessary if Norwegian climate objectives are to be achieved. This has proven difficult within the transport sector, where traffic volumes and greenhouse gas (GHG) emissions are steadily rising. Current planning and land use theory claim that replacing centrally located warehouses with urban development (housing, workplaces, shopping) will contribute to reduced transport volumes and GHG-emissions in total. This understanding is often referred to as the Dutch ABC-principle (Verroen et al. Citation1990). Despite a general agreement on this hypothesis, comprehensive empirical studies remain scarce.
This study aims to bridge this gap by empirically investigating several important mechanisms that affect GHG-emissions from transport, when centrally located warehouses are relocated. Three of these mechanisms, after relocation to fringe-locations, are: (1) increased transport distances for city distribution, (2) changed transport distances for long-haul transport, and (3) modal changes, depending on geographical locations of rail terminals and ports, and the relative cost of intermodal transport given old and new warehouse locations. In addition, relocations may also give rise to an indirect mechanism in the longer term: relocations may open-up urban development on the site, which may counteract urban sprawl tendencies and hence contribute to minimize passenger road traffic. This indirect mechanism, however, lies beyond the scope of this current paper.
The way and extent to which these mechanisms act, and whether they affect GHG-emissions, depends on the context. Using data from a commodity flow survey and foreign trade statistics, we define and investigate two cases of hypothetical warehouse relocations from central locations to relevant locations on the outskirts of cities (Oslo and Trondheim). For both cases, we define two scenarios. In scenario (i) warehouses are located at central locations (similar to previous locations of the types of firm in question), while in scenario (ii) warehouses are located on the outskirts. Using both the Norwegian National Freight Model and a City Distribution Model, we compare transport performance (ton-km), modal shares, and transport-related GHG-emissions for the scenarios and discuss differences in results between both models used. We then analyze and discuss which contextual factors contribute to explain the effects and differences found, and compare results with existing literature.
The current study contributes to the literature by investigating and documenting the effects of land use and transport-system development on traffic volumes and GHG-emissions with respect to the relocation of warehouses (for freight transport) within the urban region. This issue is highly relevant because, as a part of on-going large-scale urban development trends, it can strongly affect traffic volumes and GHG-emissions, it is hotly debated, and our knowledge of it is not well documented. While this study's analysis is based on Norwegian data, several observations are made that apply more generally and will help advance similar analyses for cases in other countries.
The remainder of this paper is organized as follows: Section 2 discusses the background and context for reducing GHG-emissions from transport in Norway, followed by a review of the literature. Section 3 describes the methodology and assumptions used in our analysis, while our results are presented in Section 4. Section 5 provides a discussion and identifies avenues for further research, after which Section 6 concludes.
2. Background and literature
2.1. Objectives
Stopping traffic growth and reducing GHG-emissions from traffic are clear and stated objectives in the Norwegian Parliament's climate agreement, the Norwegian National Transport Plan, and in many county- and municipal plans. A main strategic objective is to steer developments of land use and transport-systems in directions that contribute to reducing transport demand, to changing the modal split towards less car use, and to reduce emissions from goods distribution (cf. European Commission Citation2011; Transport Departments (Transportetatene) Citation2016).
Empirical studies during recent decades present overwhelming evidence that most activities (e.g. housing, workplaces, shopping) generate less traffic the more centrally they are located (cf. Næss Citation2012). Hence, in order to minimize car-use and traffic volumes, activities attracting the most people (employees, visitors) per square meter should be located in the most central parts of a city. For such reasons, it is understood that area-intensive activities (such as warehouses) should not be located in the more central parts of cities.
Based on such insights, there seems to be a relatively widespread agreement regarding how land use and transport-systems ought to be developed in order to reduce urban road traffic volumes: (i) land use developments as central, urban densification rather than sprawl; (ii) physical and fiscal restrictions on road traffic; and (iii) improved public transport services and improved conditions for walking and cycling (cf. Downs Citation1962; Strømmen Citation2001; Banister Citation2011; Næss Citation2006, Citation2012).
2.2. Failing practice
Despite this widespread agreement, a long history of such planning efforts and initiatives intended to take developments in traffic-reducing directions, traffic volumes have in practice only kept rising (EEA Citation2006; Furu Citation2010). GHG-emissions from road traffic in Norway increased by 32% from 1990 to 2014, and road traffic accounted for 19% of Norwegian GHG-emissions in 2014 (Statistics Norway Citation2016).
An implementation gap thus seems to exist in practical policy. With respect to factors explaining this gap, Tennøy (Citation2012) found that weaknesses in the knowledge on how some combinations of land use and transport-systems developments affect traffic volumes, and lack of relevant knowledge among professionals, are important. Scientific knowledge can consequently be excluded or ousted from planning processes (cf. Krizek, Forsyth, and Slotterback Citation2009). This problem is aggravated by the fact that several cause–effect relationships are counter-intuitive, and that different mechanisms may be active simultaneously. The latter means that even if strategies actually contributing to reducing traffic volumes are implemented (such as improving public transport services), traffic volumes may still increase due to other developments that contribute to traffic increases (e.g. urban sprawl or increased road capacity). This can be highly confusing for non-specialists. It may contribute to doubts, unfounded beliefs, and myths concerning how land use and transport-systems developments affect traffic volumes, and may hamper transitions towards more climate-friendly cities. These challenges particularly apply to complex issues that are hard to investigate empirically and are not sufficiently well documented, such as the relocation of centrally located warehouses.
2.3. Literature
When it comes to the location of warehouses, the academic literature predominantly takes a logistics or supply chain perspective, by identifying locations and route plans that minimize costs. This literature goes back to Weber (Citation1909), who studied the minimization of total travel distances between a set of customers and a facility. Askin, Baffo, and Mingjun (Citation2014) refer to this problem as the Facility Location Problem (FLP), and provide an overview of 29 FLP-studies with varying dimensions and solution approaches. They then design a Genetic Algorithm for optimizing the entire supply chain system and minimizing total costs, including fixed location costs, inventory costs, and transport costs.
Related to the FLP is the Location-Routing Problem (LRP). Prodhon and Prins (Citation2014) analyzed 72 articles on LRP between 2007 and 2013, and discuss how the LRP is a core decision in designing distribution systems. The location choice (e.g. for a warehouse) is a strategic decision, while vehicle routing to serve customers consists of tactical and operational decisions.
Despite established bodies of literature on both location and routing choices, only a few studies to date provide comprehensive analyses and evaluations of the environmental and traffic effects of location choices (cf. Nuzzolo and Comi Citation2015). One such example is Koç et al. (Citation2015), who approach the LRP by examining the impact of warehouse locations, truck fleet composition, and vehicle routing on emissions from urban freight distribution. The authors run a range of scenarios with regards to, for example, warehouse costs and urban distribution of customers. In most scenarios, they find that it is the most cost- and environmentally efficient to minimize the number of warehouses and to locate them outside the city center, often in the outer zones or suburbs. Although various authors claim that relocating warehouses to suburbs results in higher emissions, Koç et al. (Citation2015) find that, for a range of assumptions, this does not have to be the case.
Nuzzolo, Comi, and Papa (Citation2014a) present a modeling framework for jointly simulating urban logistics for shopping flows (consumers) and delivery flows (freight transporters and retailers). They then test how land management can be used to improve the efficiency of urban logistics systems, and run model simulations of shopping and delivery flows for the midsize metropolitan area of Padua in northern Italy. The authors tested three scenarios:
-
A large share of retailers is relocated from the city center and first ring, to the second ring (larger outlets).
-
A large share of warehouses is relocated from the city center and second ring, to the first ring.
-
A large share of retailers and warehouses from the city center and second ring, relocate to the first ring.
In Nuzzolo, Comi, and Rosati (Citation2014b), a similar simulation framework is discussed, again for the city of Padua. While demographic and economic developments towards 2025 were assumed to be identical, scenarios differed in other respects: in the first two scenarios, e-shopping increases moderately and dramatically, respectively. In the third scenario, e-shopping also increases dramatically, but in addition, a large share of warehouse activity is relocated from both the city center and second ring to the first ring, while a large share of retail activity is relocated from the second to the first ring.
In this third scenario, the isolated effects of warehouse and retail relocation are a reduction in vehicle-km of 3.5%, 5.2% and 8.6% from light, medium, and heavy goods vehicles, respectively. No change was observed in the number of vehicle-km for private cars. However, again it is unclear whether these results are driven by more or less centralization.
A different study was carried out by Allen, Browne, and Cherrett (Citation2012), who investigated how geographical, spatial, and land-use factors correlate with key variables for land transport for 14 urban areas in the UK. The authors analyzed their data in light of several trends in commercial land use and warehousing in urban areas: de-industrialization, spatial centralization of stockholding and the ‘square root law of inventory’ (McKinnon Citation2009), rising land prices and increasing traffic congestion, and the suburbanization of warehousing (cf. Cidell (Citation2010) for the USA). As such, they found that commercial and industrial land use patterns affect the characteristics of freight transport, for example, that larger urban areas have larger proportions of internal road freight trips than smaller ones, and that warehouses have become larger and increasingly suburbanized. The authors also found that trips within urban areas are less efficient (fewer tons per trip) than trips to and from urban areas, and that trips from urban areas are less efficient than trips to urban areas. Finally, the authors found that transport intensity (kilometers per ton lifted) is lower within urban areas than to and from urban areas.
2.4. Trends
The study by Allen, Browne, and Cherrett (Citation2012) points out that the suburbanization of warehouses is part of a trend, and that relocated warehouses are often larger than the original warehouses they replace. This is largely due to lower land prices and opportunities for spatial centralization, for example, by replacing multiple regional warehouses by one larger, central warehouse, when the cost savings of doing this compensate for potentially higher transport costs.
Dablanc and Rakotonarivo (Citation2010) also observed this suburbanization trend, in studying how parcel and express terminals have gradually moved from central locations in Paris to the outer suburbs from the 1970s. The authors call this suburbanization ‘logistics sprawl’. For the 17 largest parcel and express transport companies, the standard distance from terminals to the center of Paris increased from 5 km to 16 km between 1974 and 2008. On average, this logistics sprawl led to an increase of 400 vehicle-km per terminal per day, resulting in about 15,000 tons of additional CO2 per year for deliveries in Paris. While not negligible, this effect seems marginal compared to the 6.45 million tons of CO2 emitted from freight transport in Paris annually (Mairie de Paris Citation2007).
Sakai, Kawamura, and Hyodo (Citation2015) followed studies like Dablanc and Rakotonarivo (Citation2010), Dablanc and Ross (Citation2012), and Dablanc, Ogilvie, and Goodchild (Citation2014), and found that, for Tokyo, the average distance between logistics facilities and the city center increased by 2.4 km between 1980 and 2003 (4.1 km excluding the coastal area). The authors not only found an increase in the average distance for ‘last-mile-delivery’, but also an increase in the average distance for the entire shipment. Based on the Tokyo Metropolitan Freight Surveys, they calculated the optimal location for logistics facilities that minimizes the distance from shipments’ origins to their destinations. It turns out that the difference between the optimal locations of facilities and their actual locations increases as their distance from the city center increases. However, several exceptions also suggest that many facilities were located close to their optimal location, even if this was far from the city center.
3. Methodology and assumptions
The above discussion identified gaps in the understanding of the effects on traffic volumes and GHG-emissions with respect to the relocation of warehouses (for freight transport) within the urban region. As this study aims to bridge some of these gaps, this section will first provide background on the data used in our analysis. We then discuss and illustrate the selection of relevant cases and scenarios. This is followed by a description of our method of analysis. Finally, we discuss the models, characteristics, and assumptions used in our analysis.
3.1. Data
The foundation of this paper is formed by raw data from the most recent Norwegian Commodity Flow Survey (CFS), which was carried out by Statistics Norway in 2015, and maps domestic commodity flows (measured in tons, value, and number of shipments) originating from a sample of firms in the manufacturing and wholesale trade industries in 2014. In addition to this sample, Statistics Norway collected data on all deliveries for the 20 largest freight forwarders in Norway. This addition yields data on deliveries for many more firms (and industries) than the ones mentioned above. In total, the CFS contains data on approximately 12,000 delivering firms or 49 million shipments. Commodity flows are mapped at post zone level for both the originating and receiving firm. Since the survey is based on a stratified sample, Statistics Norway imputed freight flows for missing firms, based on information about domestic turnover and delivery patterns from neighboring firms within the same industry. However, since we consider data for selected cases (more below), we use real data at the firm level. Because the CFS only maps outgoing freight flows, it is necessary to include both firms in the study areas, and externally located firms, from which deliveries to the study areas originate, to capture the full effects of any changes.
3.2. Case selection
In order to analyze the mechanisms described earlier, we are particularly interested in somewhat larger distribution firms in the urban regions of Oslo and Trondheim, for which relocations to fringe locations could be a relevant issue. By this, we mean that they have a history of ‘recently’ moving (2008–2014) to a fringe location, or have been newly established at such a location.
We therefore used Statistics Norway's firm registry (bedrifts-og foretaksregister) - which includes data on, amongst others, firm names, industry classification (NACE), location, number of employees, registration number, and year of establishment - to identify combinations of relevant manufacturing and wholesale trade industries (NACE-classifications 10–39; 46) and relevant fringe locations, for which local municipalities have helped identify the presence of firms from these industries [these include: Akershus county and the municipalities of Enebakk, Frogn, Gjerdrum, Lørenskog, Nes, Nittedal, Oppegård, Rælingen, Skedsmo, Ski, Sørum, Ullensaker, Vestby and Ås for the Oslo case; and the Heimdal district for the Trondheim case].
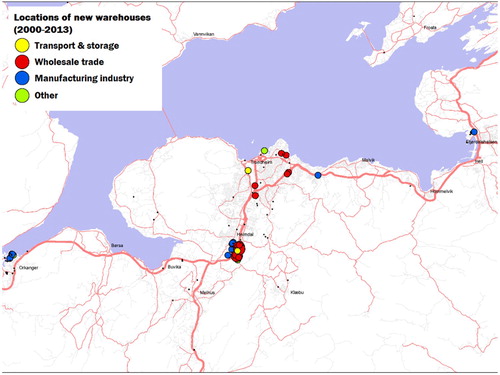
and illustrate locations of ‘newly’ established warehouses in the Oslo and Trondheim regions between 2000 and 2013. These figures indicate that newer developments have taken place mostly towards the outskirts of the urban regions (and often with easy access to the E6-highway), while the current stock of warehouses is predominantly located centrally in the urban areas (not shown here).
Figure 1. Locations of ‘newly’ established warehouses in the Oslo region.
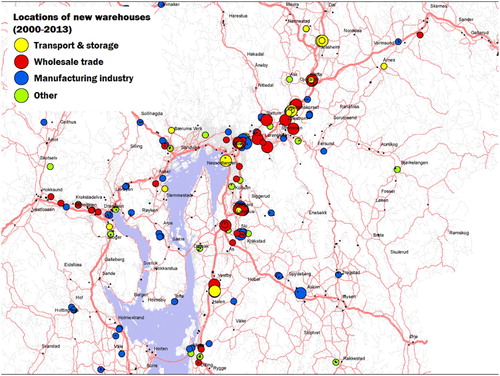
Figure 2. Locations of ‘newly’ established warehouses in the Trondheim region.
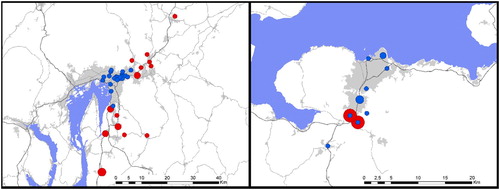
After identifying relevant current locations, we used the firm registry to also identify relevant previous, more central locations. Due to confidentiality reasons, we could not directly match commodity flows and firms, and therefore limited our CFS-dataset to commodity flows to/from localizations of relevant industries. This data-subset was then used for the analyses in this study. The relocations included in this study are illustrated in .
Figure 3. Relocations analyzed in the Oslo region (left) and the Trondheim region (right).
Note: Blue points indicate locations before moving, red points indicate locations after moving, dimensioned by number of firms.
3.3. Scenarios
As mentioned before, we defined two cases for both scenarios. In scenario (i) warehouses are assumed to remain at central locations (likely to be previous locations of the types of firm in question), while in scenario (ii) these same warehouses have been moved out to locations on the outskirts (their current locations).
3.4. Analysis
In our analysis, we distinguish between effects on long-haul transport, city distribution, and modal split. In doing so, we employ two models. Both models use the same set of commodity flows (PC-matrices) as input, but at different levels of aggregation.
3.5. Long-haul transport: national freight model
Long-haul transport and modal split are most suitably analyzed using a national freight model (NFM) developed for Norway (de Jong et al. Citation2013; Grønland Citation2015; Hovi, Caspersen, and Grue Citation2015; Madslien, Steinsland, and Grønland Citation2015). This model allows for assessing how changes in locations (the scenarios) affect transport costs, modal choices, and transport performance (ton-km and vehicle km) both domestically, and for imports and exports. The model examines aggregate annual commodity flows, based on which optimal delivery frequencies, shipment sizes, and transport chains are calculated that minimize annual logistics costs. An extension to the model additionally allows for estimating effects on CO2-emissions, based on modal splits and the CO2-intensities per ton-km for the different modes of transport.
The national freight model geographically divides Oslo and Trondheim into 12 and 8 zones respectively. While this is sufficient for analyzing long-haul effects and modal splits, it is too broad to properly capture changes in distribution transport to/from warehouses in the urban area.
3.6. City distribution: detailed geographic level
Primarily to analyze the effects on city distribution, we, therefore, developed an Excel-based City Distribution Model (CDM), based on the CFS. Compared to the NFM, this model employs a geographically more detailed zone system, and divides Oslo and Trondheim in 60 and 24 zones, respectively, while also covering the suburbs and the rest of the country. Because the same system is used in the Norwegian National Passenger Model (Steinsland and Fridstrøm Citation2014), appropriate distance matrices for road transport are easily accessible. Another difference with the NFM is that the CDM utilizes data for individual shipments, rather than aggregating them.
In the CDM, we distinguish between outgoing and incoming deliveries and between locations before and after relocation. The vehicle-independent number of ton-km is calculated by multiplying the distance of a shipment with its weight. CFS-data on goods category and volume are used to derive the most likely vehicle for a delivery, and consequent calculations then make use of the characteristics of this assigned vehicle (capacity given goods type, distance, time, (un)loading costs, fuel consumption and consequently, CO2-emissions).
Forwarding costs are calculated by multiplying distance- and time-specific vehicle costs, while taking into account that vehicle capacity is not always fully utilized. Where relevant, we also took ferry costs into account. (Un)loading costs were calculated similarly, based on vehicle-specific cost factors.
Vehicle-km were calculated by dividing the number of ton-km of a delivery by the vehicle's capacity, taking into account the goods type transported, again under the assumption that vehicles are not always filled to capacity.
Finally, CO2-emissions were calculated by multiplying vehicle-km by the vehicle specific fuel use, the number of vehicles per delivery, and a constant of 2.62 kg CO2 per liter of diesel (which takes into account the mandatory blending of biodiesel in Norway (Pinchasik and Hovi Citation2016)).
While the CDM was primarily developed to analyze effects at the level of the urban region, its extended design allows for comparisons with the NFM at the national level.
3.7. Foreign trade
Besides effects from warehouse relocations through domestic deliveries (captured using the Norwegian CFS), relocations also affect transport for foreign trade. This was analyzed by identifying firms in relevant origin/destination postcodes and relating this information to data from the Norwegian Foreign Trade Statistics on shipment-level. These data could only be analyzed using the NFM, and results are limited to effects on transport performance, mode choice, and CO2-emissions. For transport costs, the NFM did not allow for a distinction between costs accruing within and outside Norway.
4. Results
4.1. Introduction
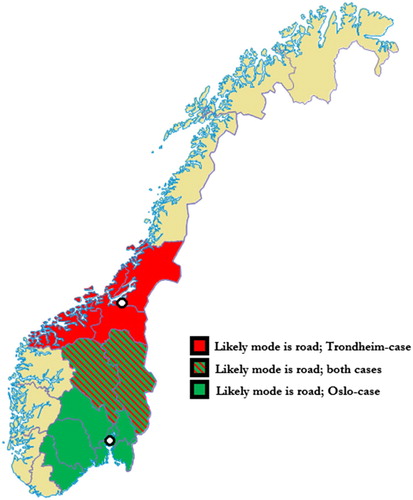
The main focus of this study is the effect of warehouse relocations on transport performance and CO2-emissions as a result of the three main mechanisms described. In discussing our results, we distinguish between the cases for Oslo and Trondheim. We further distinguish between deliveries covering relatively short distances for which modal choices other than road are unlikely (given the industries and goods categories analyzed), and long-haul deliveries. This distinction is illustrated in . [For the Oslo case, shorter distance/likely road transport is considered to include the counties of Østfold, Akershus, Oslo, Hedmark, Oppland, Buskerud, Vestfold, Telemark and Aust-Agder; and for the Trondheim case the counties of Hedmark, Oppland, Møre og Romsdal, Sør-Trøndelag and Nord-Trøndelag.] Where possible, we show results from both the NFM and the CDM. As effects through foreign trade could only be calculated using the NFM, these results are only presented for the NFM. Consequently, totals combining effects from domestic trade and foreign trade are necessarily only available from the NFM.
Figure 4. Norway divided by counties.
Note: For counties in green, transport to/from Oslo is predominantly by road; for counties in red, transport to/from Trondheim is predominantly by road. Striped coloring indicates an overlap: transport to/from both Oslo and Trondheim is most likely by road.
4.2. Transport performance (ton-km)
4.2.1. Oslo
In both the NFM and the CDM, transport performance is calculated by multiplying the distance and weight of shipments. For the Oslo case, presents results before and after warehouse relocations, for both models, and also includes effects through foreign trade.
Table 1. Comparison of transport performance before and after warehouse relocation (Oslo), divided by model used and county subsets (in 1000 ton-km per year).
Several points can be noted from these results. First, both models show that the relocation of warehouses leads to an increase in the transport performance from domestic trade of several percentage points. Secondly, this increase is observed for both shorter distance transport (2.25–4.75%), and for long-haul transport (1.55–1.79%), although relative increases are somewhat larger for shorter distances. Thirdly, estimates on transport performance tend to be slightly higher in the NFM than in the CDM, due to the fact that the CDM uses more geographically detailed distances and weighs these distances more accurately than the NFM.
For the foreign trade part, however, transport performance decreases by over 3%. Combining effects through domestic and foreign trade, the relocation of warehouses, therefore, results in a transport performance increase of just under 1% in the Oslo case. Causes for the decrease in transport performance through foreign trade are discussed in more detail in the upcoming section on modal shares.
4.2.2. Trondheim
For the Trondheim case, results are presented in .
Table 2. Comparison of transport performance before and after warehouse relocation (Trondheim), divided by model used and county subsets (in 1,000 ton-km per year).
Compared to Oslo, the relocation of warehouses in the Trondheim region results in smaller effects, and minor reductions in traffic performance through domestic trade. With reductions of 0.40–0.94%, relative effects are somewhat larger for short distance shipments than for long-haul ones.
Several explanations can be provided for these results being less pronounced than for Oslo. As is seen from and above, relocations in the Oslo region have taken place mostly to locations east of the city. For many deliveries with origin or final destinations in the city of Oslo, relocations, therefore, introduce extra distances or diversions to existing delivery routes. Compared to Trondheim, the relocation distance is also generally somewhat larger, which also implies somewhat larger effects. In addition, for Trondheim, the lion's share of deliveries comes from or goes to places south of Trondheim. Firms moving from more central locations in Trondheim to Heimdal essentially move along an existing transport route, thus not adding much extra distance.
For the foreign trade part, however, transport performance in the Trondheim case increases somewhat (0.93%). As foreign trade constitutes a non-negligible part of total trade, the total effect, therefore, amounts to a marginal increase in transport performance (0.31%).
4.3. Modal shares
After presenting changes in transport performance, this section discusses underlying causes and modal shares. Shares across different modes can only be derived from the NFM as the EM only allows for road transport.
4.3.1. Oslo
For Oslo, the NFM indicates that virtually all shorter distance transport is done by road. Long-haul transport is also predominantly done by road (±90%), and the relocation of warehouses only causes very marginal increases (decreases) in the share of road and sea transport (rail transport).
Changes in modal shares are much more pronounced for the foreign trade part: while the share of rail transport increases only marginally, the share of road transport increases from 24.9% to 30.6%, largely at the expense of maritime transport. This is also where explanations for the decrease in transport performance through foreign trade have to be sought: firstly, the relocation of some warehouses means that shipments can arrive through different ports (e.g. Moss), for which shipping distances are shorter; secondly, for firms relocating in a northern direction, the distribution distance from intermodal terminals increases; thirdly, relocations further away from ports may lead to goods flows shifting from ship to road; and fourthly, relocations in the direction of Sweden imply shorter domestic distances for some import and export traffic, and therefore a decrease in transport performance.
Focusing on road transport, we find that the NFM has a tendency to assign shipments to larger vehicles, relative to the CDM, on shorter distance shipments. This tendency is even more pronounced after relocation and is one reason for the NFM arriving at lower transport costs than the CDM. With the transport performance of short distance deliveries making up ca. 17% of total transport performance in the Oslo case, this difference is non-negligible. For long-haul shipments, the NFM and CDM assign virtually all road transport to equivalent large vehicles, and warehouse relocations only cause marginal changes.
4.3.2. Trondheim
For Trondheim, short distance transport is predominantly done by road (±90%). Compared to the Oslo case, maritime transport now makes up a share of almost 10%, while short distance transport by rail is virtually non-existent. For long-haul shipments, in turn, road transport makes up roughly two-thirds of domestic transport performance, with maritime and rail transport having shares of 16–17%. As in the Oslo case, the relocation of warehouses only leads to marginal changes in modal shares for domestic trade.
Unlike Oslo, where modal changes for the foreign trade part were quite dramatic, such changes are not found for Trondheim. The shares of road transport (ca. 6.5%) and rail transport (ca. 8%) increase only marginally, and the share of maritime transport also only changes marginally. This also explains why changes in transport performance through foreign trade in the previous sections were relatively minor.
When only examining road transport in the Trondheim case, the NFM tends to assign short distance shipments to larger vehicles than the CDM. Again, this will be one of the reasons for the NFM showing higher transport costs than the CDM (the other main reason being Trondheim's geographical characteristics). However, for Trondheim, shorter distance deliveries make up less than 7% of total transport performance, so that effects will be smaller. For Trondheim, vehicle assignment on long-haul shipments is close to identical in the NFM and CDM and, as for Oslo, warehouse relocations only cause very marginal changes.
4.4. CO2-emissions
4.4.1. Oslo
When it comes to CO2-emissions, calculation approaches between the models differ. By basing CO2-estimates on the number of ton-km, the NFM assumes fixed average capacity utilization rates for different modes. As described before, the underlying capacity utilization in the CDM can vary for different shipments, as the model uses data on shipment-level, rather than calculating optimal shipment sizes and frequency per year (like the NFM). Despite these differences, both models indicate that total CO2-emissions from domestic shipments increase when relevant warehouses are relocated ().
Table 3. Comparison of CO2-emissions before and after warehouse relocation (Oslo), divided by model used and county subsets (in ton CO2 per year).
Although absolute numbers differ somewhat between the models, this effect persists both for shorter distance and long-haul deliveries. Again, relative increases are highest for shorter distance deliveries (2.58–6.36% vs. 1.79–2.29%). The relatively higher increase in CO2-emissions for shorter distance shipments in the CDM can be explained by the CDM assigning a larger share of deliveries to smaller vehicles than in the NFM (see the previous section).
For the foreign trade part, CO2-emissions increase as well, despite the reduction in transport performance. The total effect from the relocation of warehouses, therefore, amounts to an increase of CO2-emissions of just under 2.7%. The cause for this increase lies with the changes in modal shares discussed above: as the share of road transport increases at the expense of maritime transport, average CO2-emissions per ton-km increase.
4.4.2. Trondheim
In the Trondheim case, the effect of warehouse relocations on CO2-emissions is relatively small ().
Table 4. Comparison of CO2-emissions before and after warehouse relocation (Trondheim), divided by model used and county subsets (in ton CO2 per year).
While the NFM shows an increase in emissions of 0.26% for the country as a whole, the CDM indicates a minor decrease of 0.13%. For the shorter distance deliveries, CO2-emissions are estimated to decrease, but by no more than 0.84%, while for long-haul transport, estimated effects are also very small (−0.14%–0.36%).
For the foreign trade part, however, which is predominantly done by sea, CO2 increases by just under 2 percent. The effect of combining domestic and foreign trade amounts to an emissions increase of 0.49%.
4.5. Transport costs
Estimating transport costs is often challenging because of imbalances in freight flows in different directions. Consequently, transport modes are on average not filled to capacity. In the NGM, this challenge is addressed through adjustments to capacity utilization rates and by adding a mobilization distance for some specialized modes, while the CDM addresses this challenge by capping capacity utilization rates at 70%.
4.5.1. Oslo
Results for transport cost estimates differ significantly between the two models, as both employ their own cost functions and cost elements. In addition, the assignment of deliveries to different modes plays a material role in the freight model, with transport costs constituting an important factor. Together with the NFM's tendency to assign deliveries to larger vehicles, and to optimize the number and size of deliveries, this leads to transport costs in absolute terms being significantly lower in the NFM than in the CDM, which only allows for transport by road. Another point worth mentioning is that for cost effects through foreign trade, the NFM does not distinguish between costs accruing in Norway and costs accruing abroad. Results are therefore limited to domestic trade.
Nevertheless, both models show that transport costs in the Oslo case increase as a result of warehouse relocation. This increase is moderate in the NFM (0.32% and 1.35% for shorter distances and long-haul transport respectively, for a combined increase of 0.97%). In the CDM, the increase in transport costs is more significant (4.58% in total).
4.5.2. Trondheim
For Trondheim, results also differ significantly between the two models, for the reasons described above. For Trondheim, however, both models show that transport costs decrease as a result of warehouse relocation.
The NFM indicates a decrease of 0.50% on short distance shipments, and a decrease of 1.36% for long-haul transport, for a combined decrease of 1.22%. The CDM, in turn, indicates almost no change in transport costs, with decreases not exceeding 0.1%.
5. Discussion
Using modeling tools, rather than for example surveys asking firms about perceived transport and CO2-effects of relocating, allows for a bottom-up approach to calculating driving distances, fuel consumption, and CO2-emissions. The models used in this study also make it possible to calculate isolated effects of warehouse relocations on transport performance, costs, and CO2-emissions, and in doing so, take into account full delivery patterns for the available sample.
To a certain extent, the NFM and CDM complement each other in doing so. An important strength of the NFM is that it allows for modal shifts following relocation, and includes maritime and rail transport, in addition to road transport. This might also make its estimation of transport costs more realistic than in the CDM, where road transport is the only mode considered, even when this is considerably more expensive between certain origins and destinations.
A weakness of the NFM in the realms of this study, however, is its aggregated geographical level. This particularly is a disadvantage when analyzing more local effects. To that end, the CDM introduces a considerably higher level of geographical detail, which particularly contributes to the analysis of effects in urban regions.
As for the estimation of CO2-effects, the starting point in both models is transport performance, for which data are expected to be rather certain. While the NFM then employs average CO2 emission factors per ton-km, the CDM takes into account estimates of the capacity utilization of single shipments. In addition to the higher level of geographical detail, this is expected to yield more precise estimates on CO2-emissions, and thus also more precise comparisons of impacts from different warehouse locations.
In addition to both models having their own characteristics, relevant differences also exist at the case level. Firstly, the sample of deliveries in the Oslo case is much larger, and is less likely to be influenced by a number of dominant firms potentially accounting for a large share of the observations. Secondly, we saw that the geographical location of Oslo and Trondheim and the locations of new warehouses is less likely to yield large effects in the Trondheim case than in the Oslo case. Conclusions for the one case, therefore, do not necessarily also apply to the other.
An important limitation of our study is the implicit ceteris paribus assumption: except for warehouse location, everything else remains the same. In reality, however, the relocation of warehouses will often allow for larger warehouses, due to lower land prices, and the centralization of warehouses, for example by replacing several regional warehouses by one, larger warehouse for the entire country, when cost savings from centralization are higher than cost increases from longer transport distances. This aspect will therefore likely lead to more pronounced effects than the ones found in our analysis.
The relocation of warehouses also opens up opportunities for other urban developments, such as housing, workplaces, or shopping. Avenues for further research could, therefore, include analyses of traffic effects from different urban developments, to include total effects of changed land uses.
6. Conclusions
In order to achieve the wide-spread Norwegian objectives of stopping traffic growth and reducing GHG-emissions, large societal transformations are required. Empirical studies during the last decades overwhelmingly conclude that more centrally located activities generate less traffic. For such reasons, it is understood that area-intensive activities, such as warehouses, should not be located in the more central parts of cities.
While locating people-intensive activities (such as housing or workplaces) in the central part of cities has received much attention in the literature, the (re)location of warehouses has so far predominantly focused on logistics or supply chain effects, rather than on environmental or traffic effects.
This study contributes to the literature by investigating and documenting the effects of land use and transport-system development on traffic volumes and GHG-emissions with respect to the relocation of warehouses (for freight transport) within the urban region. This was accomplished by considering three mechanisms: (1) increased transport distances for city distribution as warehouses relocate to fringe-locations; (2) changed transport distances for long-haul transports; and (3) modal changes, depending on geographical locations of rail terminals and ports, and the relative cost of intermodal transports given old and new warehouse locations and the delivery patterns of firms.
After identifying relevant cases and scenarios, we used data from Statistics Norway's Commodity Flow Survey and Foreign Trade Statistics as inputs in both the Norwegian National Freight Model, and our own-developed Excel-based City Distribution Model with somewhat different characteristics.
Results from running these models indicate that, for the case of Oslo, transport performance through domestic trade increases as a result of warehouse relocations. Although a decrease in transport performance from foreign trade somewhat compensates for this effect, transport performance in total is still indicated to rise. At the same time, modal changes for domestic trade are marginal, and for the foreign trade part indicate some shifts from sea to road and increased distribution distances from intermodal terminals. All in all, warehouse relocations also cause CO2-emissions to increase. The fact that a large part of this increase materializes in the urban region suggests that urban areas could see relevant increases in local emissions (e.g. NOx). Finally, for the Oslo case, also transport costs are indicated to increase. Logistics costs in total may nevertheless go down due to, for example, lower land prices outside the central areas or the centralization of stockholding.
For Trondheim, effects on transport performance are smaller (minor decreases for domestic trade, a small increase through foreign trade, for a combined effect of 0.31%). Also, modal shares and CO2-emissions (+0.49% in total) change less than in the Oslo case, while transport costs are indicated to decrease by 0.09–1.22% in total. An important reason for these less pronounced effects could be that the relocated warehouses are often placed close to existing main transport routes. This is an important observation to bear in mind when extending or extrapolating results to other cases.
Overall, our results stand in some contrast to findings by Koç et al. (Citation2015), who concluded that in most scenarios it is the most cost- and environmentally efficient to minimize the number of warehouses and to locate them at the outskirts. Although they considered total logistics costs, our study shows that for Oslo, at least the transport part of costs in fact increases, while for Trondheim, transport costs decrease only marginally. Moreover, and contrary to Koç et al., we find that environmental emissions increase, rather than decrease, for both Oslo and Trondheim.
Compared with Nuzzolo, Comi, and Papa (Citation2014a and Citation2014b), our study has focused on the isolated effects from sprawl, rather than sprawl and centralization combined. While this makes direct comparisons with those authors impossible, our approach is in line with the ‘logistics sprawl’ trend observed in both the literature (cf. Allen, Browne, and Cherrett Citation2012; Dablanc, Ogilvie, and Goodchild Citation2014) and in this study also.
Disclosure statement
No potential conflict of interest was reported by the authors.
ORCID
Inger Beate Hovi http://orcid.org/0000-0002-5015-2315
Aud Tennøy http://orcid.org/0000-0001-7732-1185
Additional information
Funding
References
- Allen, J. , M. Browne , and T. Cherrett . 2012. “Investigating Relationships Between Road Freight Transport, Facility Location, Logistics Management and Urban Form.” Journal of Transport Geography 24: 45–57. doi: 10.1016/j.jtrangeo.2012.06.010
- Askin, R. G. , I. Baffo , and X. Mingjun . 2014. “Multi-Commodity Warehouse Location and Distribution Planning with Inventory Consideration.” International Journal of Production Research 52 (7): 1897–1910. doi: 10.1080/00207543.2013.787171
- Banister, D. 2011. “Cities, Mobility, and Climate Change.” Journal of Transport Geography 19: 1538–1546. doi: 10.1016/j.jtrangeo.2011.03.009
- Cidell, J. 2010. “Concentration and Decentralization: The New Geography of Freight Distribution in US Metropolitan Areas.” Journal of Transport Geography 18 (3): 363–371. doi: 10.1016/j.jtrangeo.2009.06.017
- Dablanc, L. , S. Ogilvie , and A. Goodchild . 2014. “Logistics Sprawl: Differential Warehousing Development Patterns in Los Angeles and Seattle.” Transportation Research Record: Journal of the Transportation Research Board 2410: 105–112. doi: 10.3141/2410-12
- Dablanc, L. , and D. Rakotonarivo . 2010. “The Impacts of Logistics Sprawl: How Does the Location of Parcel Transport Terminals Affect the Energy Efficiency of Goods’ Movements in Paris and What Can We Do About it?” The 6th International Conference on City Logistics. Procedia Social and Behavioral Sciences 2 (3): 6087–6096. doi: 10.1016/j.sbspro.2010.04.021
- Dablanc, L. , and C. Ross . 2012. “Atlanta: A Mega Logistics Center in the Piedmont Atlantic Megaregion (PAM).” Journal of Transport Geography 24: 432–442. doi: 10.1016/j.jtrangeo.2012.05.001
- Downs, A. 1962. “The law of Peak-Hour Expressway Congestion.” Traffic Quarterly 16: 393–409.
- European Commission . 2011. “Roadmap to a Single European Transport Area – Towards a competitive and resource efficient transport system.” EC White Paper. Accessed 16 October, 2018. http://eur-lex.europa.eu/legal-content/EN/ALL/?uri = CELEX%3A52011DC0144 .
- European Environment Agency . 2006. “Urban Sprawl in Europe. The Ignored Challenge.” EEA-report No. 10/2006, Brussels.
- Furu, L. E. 2010. “Hvor kom veksten i Akershus 2000–2010?” Asplan Viak for Akershus County, Oslo, Norway. Accessed 16 October, 2018 (in Norwegian). http://www.bussanbud.no/Filer/Planer/HvorkomveksteniAkershus_2000-2010_D.pdf .
- Grønland, S. E. 2015. “Kostnadsmodeller for transport og logistikk – basisår 2012.” TØI-report 1435/2015. Accessed 16 October 2018 (in Norwegian). https://www.toi.no/publikasjoner/kostnadsmodeller-for-transport-og-logistikk-basisar-2012-article33392-8.html .
- Hovi, I. B. , E. Caspersen , and B. Grue . 2015. “Varestrømsmatriser med basisår 2012/2013.” TØI-report 1399/2015. Accessed 16 October, 2018 (in Norwegian). https://www.toi.no/publikasjoner/varestromsmatriser-med-basisar-2012-2013-article33112-8.html .
- Jong, G. de , M. Ben-Akiva , J. Baak , and S. E. Grønland . 2013. “Method Report – Logistics Model in the Norwegian National Freight Model System (Version 3).” Significance & SITMA Report, Project 12028. Accessed 16 October, 2018. http://www.ntp.dep.no/Transportanalyser/Transportanalyse + godstransport/_attachment/526626/binary/847833?_ts = 14135402fc8 .
- Koç, C. , T. Bektas , O. Jabali , and G. Laporte . 2015. “The impact of Location, Fleet Composition and Routing on Emissions in Urban Freight Distribution.” CIRRELT Report 2015-33, Interuniversity Research Centre on Enterprise Networks, Logistics and Transportation, University of Montreal, Montreal.
- Krizek, K. , A. Forsyth , and C. S. Slotterback . 2009. “Is There a Role for Evidence-Based Practice in Urban Planning and Policy?” Planning Theory & Practice 10 (4): 459–478. doi: 10.1080/14649350903417241
- Madslien, A. , C. Steinsland , and S. E. Grønland . 2015. “Nasjonal godstransportmodell. En innføring i bruk av modellen.” TØI-report 1429/2015. Accessed 16 October, 2018 (in Norwegian). https://www.toi.no/publikasjoner/nasjonal-godstransportmodell-en-innforing-i-bruk-av-modellen-article33855-8.html .
- Mairie de Paris . 2007. ‘Le bilan carbone de Paris’, Hôtel de Ville, Paris (in French).
- McKinnon, A. 2009. “The Present and Future Land Requirements of Logistical Activities.” Land Use Policy 26: S293–S301. doi: 10.1016/j.landusepol.2009.08.014
- Næss, P. 2006. Urban Structure Matters. Residential Location, Car Dependence and Travel Behaviour . London : Routledge.
- Næss, P. 2012. “Urban Form and Travel Behavior: Experience From a Nordic Context.” Journal of Transport and Land use 5: 21–45.
- Nuzzolo, A. , and A. Comi . 2015. “Urban Freight Transport Policies in Rome: Lessons Learned and the Road Ahead.” Journal of Urbanism 8 (2): 133–147.
- Nuzzolo, A. , A. Comi , and E. Papa . 2014a. “Simulating the Effects of Shopping Attitudes on Urban Goods Distribution.” Procedia - Social and Behavioral Sciences 111: 370–379. doi: 10.1016/j.sbspro.2014.01.070
- Nuzzolo, A. , A. Comi , and L. Rosati . 2014b. “City Logistics Long-Term Planning: Simulation of Shopping Mobility and Goods Restocking and Related Support Systems.” International Journal of Urban Sciences 18 (2): 201–217. doi: 10.1080/12265934.2014.928601
- Pinchasik, D. R. , and I. B. Hovi . 2016. “A CO2-Fund for the Transport Industry: The Case of Norway.” Transport Policy (53): 186–195.
- Prodhon, C. , and C. Prins . 2014. “A Survey of Recent Research on Location-Routing Problems.” European Journal of Operational Research 238: 1–17. doi: 10.1016/j.ejor.2014.01.005
- Sakai, T. , K. Kawamura , and T. Hyodo . 2015. “Locational Dynamics of Logistics Facilities: Evidence From Tokyo.” Journal of Transport Geography 46: 10–19. doi: 10.1016/j.jtrangeo.2015.05.003
- Statistics Norway . 2016. “Utslipp av klimagasser.” Accessed 16 October, 2018 (in Norwegian). https://www.ssb.no/statistikkbanken/selecttable/hovedtabellHjem.asp?KortNavnWeb=klimagassn&CMSSubjectArea=natur-og-miljo&checked=true .
- Steinsland, C. , and L. Fridstrøm . 2014. “Transportmodeller på randen. En utforskning av NTM5-modellens anvendelsesområde.” TØI-report 1309/2014. Accessed 16 October, 2018 (in Norwegian). https://www.toi.no/publikasjoner/transport modeller-pa-randen-en-utforskning-av-ntm5-modellens-anvendelsesomrade-article32570-8.html.
- Strømmen, K. 2001. “The Right Businesses in the Right Locations – About Businesses’ Transport Generating Properties.” unpublished PhD thesis 2001:14. Institute for Urban and Regional Planning. Norwegian University of Science and Technology NTNU.
- Tennøy, A. 2012. “How and why Planners Make Plans Which, if Implemented, Cause Growth in Traffic Volumes. Explanations Related to the Expert Knowledge, the Planners and the Plan-Making Processes.” unpublished PhD thesis 2012:01. Norwegian University of Life Sciences.
- Transport Departments (Transportetatene) . 2016. ‘Grunnlagsdokument Nasjonal Transportplan 2018–2029’, National Transport Plan. Accessed 16 October, 2018 (in Norwegian). http://www.ntp.dep.no/Nasjonale+transportplaner/2018-2029/Plangrunnlag/_attachment/1215451/binary/1108802?_ts=154a51c1a38 .
- Verroen, E. J. , M. A. Jong , W. Korver , and B. Jansen . 1990. “Mobility Profiles of Businesses and Other Bodies.” INRO-VVG-report 1990-03, Delft: Institute of Spatial Organisation TNO.
- Weber, A. 1909. Theory of the Location of Industries . Chicago : The University of Chicago Press.