
 ?Mathematical formulae have been encoded as MathML and are displayed in this HTML version using MathJax in order to improve their display. Uncheck the box to turn MathJax off. This feature requires Javascript. Click on a formula to zoom.
ABSTRACT
This study aims to identify the non-value-adding activities during vehicle stowage operations in automobile terminals and propose a connected automated vehicle (CAV) loading system, a self-driving-car-loading system. Furthermore, the productivity of the CAV loading system is compared with the current loading system. A simulation model of an actual loading system was developed using the software FlexSim. The simulation results showed that the walking time of workers, operation time of shuttle vans, and waiting time occupied a large part of the cycle time in the current operation system. The proposed CAV loading system has eliminated these inefficiencies, and increased productivity by 26.78%. This is the first study to (1) present a self-driving-car-loading system in a simulated automobile terminal of a real-world size, and (2) propose a CAV loading system. Results provide useful insights for the integration of self-driving technology into future automobile port operations.
1. Introduction
Port operations are a central entity in competitive supply chain management for efficient maritime transport (Lu, Shang, and Lin Citation2016). Ports are the main access gates to trade and commerce for many countries, including some of the world's most developed economies (Santos et al. Citation2018). Hence, port terminals are designated and customized for specific cargo, and facilities and functions have been developed to improve port competitiveness (Ducruet Citation2022).
In the past few years, automobile terminals where finished vehicles flow have played an essential role in automotive supply chains as the number of automobile vessels and voyage intensity have increased worldwide (Howard Citation2022). According to Clarkson (Citation2022), car carrier fleet growth reached 0.5% in 2022 and is predicted to expand by 1.3% in 2023, and global seaborne vehicle trade grew by 8% to 20.3 million cars in 2022. In addition, global car production is projected to grow by 5% in 2023 (Clarkson Citation2022; Esteve-Pérez, Gutiérrez-Romero, and Mascaraque-Ramírez Citation2021). Consequently, the seaborne car trade has become a significant global market, and automobile terminals are becoming an essential element of a country's competitiveness.
Ports and terminals are considered competitive if their key indicators are well managed, including vessel arrival rate, waiting time, turnaround time, berth occupancy, and cargo dwell time (Ha and Yang Citation2017; Ha, Yang, and Lam Citation2019; Nayak et al. Citation2022). Therefore, automation systems should be integrated into terminal operations for quickly and safely loading and unloading vessel cargo (Bai, Jia, and Xu Citation2022).
However, automobile terminals heavily rely on workers; drivers have to move the vehicles one by one (Park et al. Citation2021; Citation2022). As the handled cargo is running vehicles, workers are exposed to the danger of accidents (Hou, Chen, and Chen Citation2019). In addition, workers do inevitable non-value-adding activities during vehicle stowage operations (Kaptan Citation2022). Therefore, we propose an automated loading system for self-driving cars in this study.
Industrial transformation is accelerating rapidly due to the Fourth Industrial Revolution (Bianco et al. Citation2023; Frank, Dalenogare, and Ayala Citation2019). The structural transformation of operating system in industry sites such as factories, ports, warehouses and transportations is inevitable with the emergence of self-driving cars (Çetin Er and Ozcan Citation2022; Sharma and Mishra Citation2022). Specifically, self-driving cars will enter automobile terminals within a few years, which is expected to yield many benefits; improving traffic system, safety, and productivity (Li et al. Citation2021; Xiao and Goulias Citation2022). Moreover, self-driving technology enables vehicles to communicate with each other and connect with traffic signals, signs, and infrastructure (Rahman, Abdel-Aty, and Wu Citation2021). Therefore, all self-driving vehicles in a port can become connected automated vehicles (CAV) that use different technologies to communicate with objects and form a platoon for the implementation of a CAV loading system (Xiong, Jiang, and Li Citation2022).
The introduction of a CAV loading system can bring many changes to current loading systems (Park et al. Citation2022). These include replacing workers with self-driving technology. With a CAV loading system, most non-value-adding activities of workers will be eliminated. Consequently, terminal productivity will improve, leading to enormous benefits (Medal-Bartual, Molinos-Senante, and Sala-Garrido Citation2016).
In this study, we identify the non-value-adding activities in current loading systems and develop a CAV loading system to eliminate these activities. The vehicle loading system of an actual automobile terminal is tested through 3D simulation using the software FlexSim. Then, the non-value-adding activities of workers in the current loading system are identified. Lastly, we develop the CAV loading system to demonstrate the elimination of the non-value-adding activities in the current loading system.
The contributions of this paper can be summarized as follows. First, this is the first paper to present a car loading system of automobile terminal in a port. Second, prior studies mainly adopted Arena simulation approach to demonstrate the specific activities in port operations. However, this paper employed FlexSim simulation to additionally analyze workers’ motions that create non-value-adding activities. Third, this study compared the operational productivity between a current car loading system and a self-driving-car-loading system, the connected automated vehicle loading system. In addition, to reduce error rates in the simulation that mirrors the actual loading system, this paper employed the actual data of the terminal. Lastly, to overcome the research gaps, this study integrates the loading system of the case-studied ship in Park et al. (Citation2021) and the loading system of ports in Park et al. (Citation2022) to deal with the entire loading system in a port.
The remainder of this paper is structured as follows. Section 2 reviews works on self-driving cars in ports and previous studies on automobile terminals. We investigate port performance using a series of simulations in Section 3. Section 4 presents the simulation results and a cost model analysis for the overall benefits. Section 5 summarizes this study ().
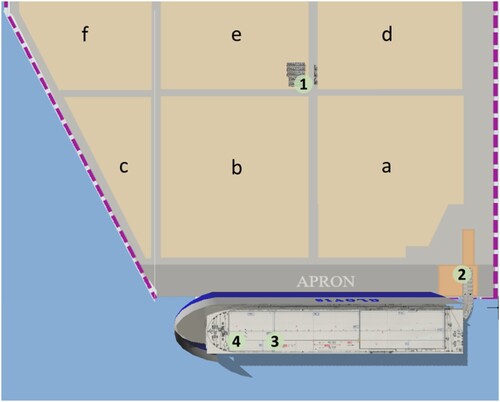
Figure 1. Pyeongtaek Port 3D layout.
2. Literature background
2.1. Automobile terminal operation
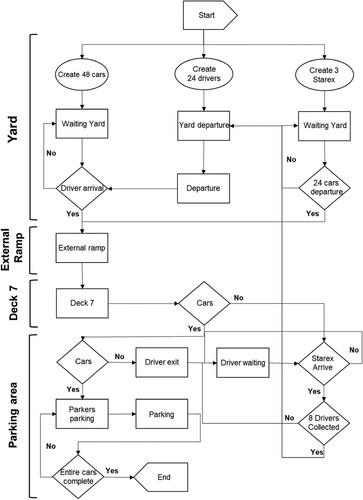
Pure car carriers (PCCs) and pure car and truck carriers (PCTCs) are typical automobile ships (Todorrov Citation2016). PCTCs are widely used (Schramm Citation2020; Sun et al. Citation2022). In the context of automobile ships and car transportation, the term ‘R/T’ is commonly used to describe the capacity of ships, indicating the maximum number of standard-sized vehicles they can transport. This unit of measurement originated from the 1966 Toyota Corolla (RT43). Horizontal loading systems are used for PCTCs at automobile terminals (Abourraja, Kringos, and Meijer Citation2022; Becker et al. Citation2016; Özkan, Nas, and Güler Citation2016). Vehicles are loaded at designated places in a ship by crossing an external ramp (Jia et al. Citation2022). The stevedores of an automobile terminal constitute a so-called gang (Fischer and Gehring Citation2005). The composition of a gang depends on the terminal type, cargo volume, and cargo type (Dias, Calado, and Mendonça Citation2010). Normally, an automobile ship in the 7000 R/T class requires a gang of 16 stevedores, including eight drivers, three parking attendants, two shuttle van drivers, and one guide person (Chen et al. Citation2021; Seo et al. Citation2017). As shown in , the loading process begins with a driver boarding a vehicle at the yard and driving it to the ship. After all vehicles leave the yard, a shuttle van driver drives a shuttle van after the vehicles. The signal person guides the vehicles on the main road to prevent the overlapping of traffic lines. The driver drives the car according to the guidance of the signalman, passes through the external and internal ramps and reaches the parking deck. Drivers leave the cars in the parking area, and the parking attendants park them at their designated slots. After leaving the cars, the drivers wait for the shuttle van. Finally, all the drivers in one gang (eight to ten people) gather and return to the yard.
Figure 2. Simulation flowchart of current loading system.
2.2. Safety and (non-)value-adding activities in automobile terminals
The total service time of a terminal is an essential quality indicator in evaluating port productivity (Brooks Citation2006; Cullinane, Song, and Gray Citation2002; Nayak et al. Citation2022). Therefore, drivers’ work speed during loading operations can determine port competitiveness (Brooks and Schellinck Citation2013; Ha and Yang Citation2017; Marlow and Paixão Casaca Citation2003; Woo, Pettit, and Beresford Citation2011). Nevertheless, improving workers’ productivity at automobile terminals entails several risks (Kaptan Citation2022). As explained in Subsection 2.1, automobile terminals highly depend on workers. However, since the handled cargo is running vehicles, the higher the work speed, the greater the risk of accidents (Halawa et al. Citation2020). Factors like extreme conditions, noise, and lack of resources compromise worker health and productivity (Fan et al. Citation2022). In addition, in the Toyota Production System, several non-value-adding activities are performed by workers during vehicle stowage. Value-adding activities refer to tasks or processes that directly contribute to the creation or enhancement of value for a product, service, or organization. Klein et al. (Citation2021) identified eight types of non-value-adding activities: overproduction, waiting, transportation, processing, inventory, motion, defect, and person. From this perspective, any direct engagement with moving and loading a vehicle during the loading process is deemed a value-adding activity. All other activities are non-value-adding activities, such as walking and returning to the yard, which fall under the carrying, motion, waiting, and people categories. Therefore, eliminating non-value-adding activities of these types can directly increase productivity (de Jesus Pacheco, Møller Clausen, and Bumann Citation2023; Mor et al. Citation2019; Ray and John Citation2011; Yadav and Desai Citation2016).
2.3. CAV loading system
The Society of Automotive Engineers (SAE Citation2021) categorizes autonomous vehicles into six distinct levels, starting from Level 0 up to Level 5. In Level 0, all driving tasks are managed by the human driver, while Level 5 represents complete automation, where the vehicle can operate in all conditions without human intervention. As vehicles evolve towards greater automation, they promise to greatly enhance port operations, in terms of economic benefits, environmental impact, operational efficiency. Yao et al. (Citation2024) studied the influence of the heterogeneity and platoon size of connected vehicles on the capacity of mixed traffic flow. The findings reveal that road capacity increases with the maximum platoon size and the penetration rate of connected vehicles. Notably, the penetration rate of connected and automated vehicles has a more significant impact on road capacity compared to connected human-driven vehicles. The study suggests that connected and automated vehicles could be a big help in improving traffic and planning future roads. Park, Yun, and Kim (Citation2023) examined the benefits of implementing a Connected Automated Vehicle (CAV)-loading system in automobile terminals. Using simulation models, the study assessed the performance and economic advantages of the CAV loading system over traditional human-operated systems. The results revealed a dramatic 90% reduction in operating costs and a 12% decrease in CO2 emissions. The findings suggest that the adoption of autonomous vehicles in port terminals can significantly enhance operational efficiency, reduce environmental impact, and transform an industry traditionally reliant on human labor. Given the transformative potential of autonomous vehicles in enhancing road capacity and port operations, these technologies can streamline even the labor-intensive tasks.
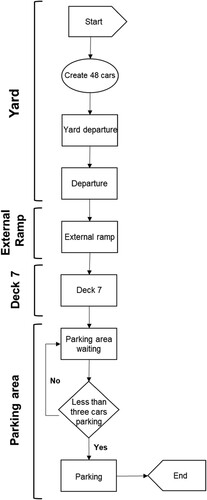
Reducing the non-value-adding activities of workers who work rapidly and improve productivity in current shipping systems is challenging. With a CAV loading system, most non-value-adding activities in current loading systems caused by carrying, motion, and people can be eliminated. As self-driving technology replaces most workers in current loading systems, many aspects of the process will be simplified. shows the flow of the proposed CAV loading system. First, the driver's boarding of the vehicle and driving it to the ship are removed. The lidar sensor of the self-driving car can perform the signal person’s task (Hou and Ai Citation2020; Zhao et al. Citation2019). Cars can park in the parking area without the support of a parking attendant (Shin and Jun Citation2014; Zhao, Liang, and Chen Citation2018). Moreover, since the work does not involve drivers, shuttle vans are not needed. In addition, CAVs can platoon by communicating with other vehicles using various communication technologies (Yao et al. Citation2023). Consequently, most non-value-adding activities in current loading systems can be removed.
Figure 3. Simulation flowchart of CAV loading system.
2.4. Originality
Few papers have studied the productivity of automobile terminals using mathematical models or surveys (Ahn et al. Citation2021). Papers about the loading systems of automobile terminals are lacking. Park et al. (Citation2021) and Park et al. (Citation2022) suggested the use of automated guided vehicles (AGVs) in automobile terminals. A series of simulation models was developed using the software Arena. The results showed that a system with several AGVs could match or exceed the productivity of current loading systems. However, an AGV loading system that matches the productivity of current loading systems requires a large amount of capital (for the use of AGVs) and a wide area. Moreover, the vehicle arrival times of each section in automobile terminal; yard, external ramp, internal ramp, and parking slots were calculated and summed to estimate the total loading time based on a triangular distribution. However, the walking time of workers, which depended on the area, greatly affected productivity (Hashemi-Petroodi et al. Citation2023). Therefore, simulation studies involving walking workers, vehicle speed by section, acceleration, deceleration, and other factors are important (Khattak et al. Citation2022). Furthermore, unlike AGVs, CAVs operate as a mode of transportation themselves; hence, no initial investment is required for transport vehicles.
This study proposes a CAV loading system. To overcome the research gaps, this study has integrated the backgrounds of Park et al. (Citation2021) and Park et al. (Citation2022), using 3D models. In addition, we analyze the actual size of the terminal, car, and the background of a case-studied port using FlexSim to identify the non-value-adding activities of walking workers. Finally, dealing with the entire loading system in a port, this paper compares the productivity of the current loading system and the CAV loading system proposed.
3. Materials and methods
3.1. Case study
In this study, we used a 3D model to reconstruct the Pyeongtaek Port and ship, as shown in . See Park et al. (Citation2021) and Park et al. (Citation2022) for the port’s layout and details on the car carrier and its parking section. The parking yard at Pyeongtaek Port is divided into six blocks labeled a to f starting with the block closest to the berth. One block can accommodate approximately 1200 cars. Between the blocks are roads on which the vehicles can travel (called main roads). The traffic laws followed by all vehicles in the port are the same as those followed on city roads, and traffic is controlled by a signal person. The numbers marked in are main shipping sections in a sequential order: the yard, external ramp, deck 7, and parking area.
3.2. Simulation flowchart
A simulation flowchart was designed, and a 3D model incorporating the actual size of the terminal, ship, and car was created using FlexSim simulation. The simulation flowchart was designed based on the main shipping sections of the automobile terminal: the yard, external ramp, decks, and parking area. In the first stage, we created 48 cars, 24 drivers, and 3 shuttle vans in the yard. Although the actual loading situation involves handling thousands of cars at full vessel capacity, we experimented with a scaled-down version of the loading process to overcome the graphical limitations on the local PC. This involved testing the minimum number of cars that could be tested in two cycles of stowage operations. However, to ensure accurate measurements, we considered the composition of stevedores required for the vessel's full capacity. This approach allowed us to assess the actual working speed under conditions that would be encountered when handling thousands of cars at full vessel capacity. In the next stage, one car has one driver, who must leave the yard after arriving at the car. If the driver does not arrive, the vehicle will wait in the yard. The car passes through the external ramp and arrives in the parking area on deck 7 while the shuttle van moves to where the drivers are waiting. In the parking area, the drivers leave the shipping vehicles, and the parking attendants continue parking the cars until all cars are parked. In the waiting area on deck 7, the drivers may only return to the yard once all eight of them are gathered and the shuttle van is present. In the case of the proposed CAV loading system, all activities involving workers are removed, as shown in .
3.3. Vehicle speed and safe following distance
Vehicle speed exerts the greatest impact on an automobile terminal’s work speed. The faster the vehicle, the higher the productivity of the automobile terminal. However, as vehicle speed increases, the possibility of a contact accident increases. Therefore, the vehicle speed in each section of an automobile terminal is regulated to prevent accidents. In particular, full deceleration is required to protect a vehicle from the road surface when entering the external ramp. The acceleration and deceleration needed to reach the maximum speed in each section also significantly affect the work speed of the automobile terminal. Therefore, as in previous studies, we referred to the Hyundai Glovis transportation and handling manual to set the vehicle speed (Hyundai Glovis Citation2019). In addition, we considered vehicle acceleration and deceleration. The speeds of human driven vehicle (HDV), shuttle van, CAV, and driver’s walking in each section are shown in . Parking preparation time is allocated for CAVs to account for tasks such as network ensuring, proximity checks, communication with parking infrastructure and verifying the destination. While CAVs are capable of performing some of these tasks automatically, the parking preparation time is still assigned as a buffer to accommodate any potential delays or uncertainties.
Table 1. Maximum vehicle speed (unit: m/s).
Table 2. Vehicle acceleration (unit: m/s2).
Table 3. Vehicle deceleration (unit: m/s2).
Table 4. Safe following distance (unit: m).
Table 5. CAV loading system simultaneous parking capacity (unit: s).
3.4. Simulation model
3.4.1. Simulation assumptions
This study aims to compare the productivity of two loading systems. The final loading time at full vessel capacity is determined by the maximum number of vehicles that can be loaded on the ship. However, as FlexSim contains 3D animation that requires high-quality graphics, the minimum number of vehicles that could be tested in two cycles was simulated using a local PC. In addition, we set the following assumptions based on previous studies:
Deck pillar surfaces were not considered due to their small size and the large spaces between deck pillars.
The vehicle speeds of the two loading systems were in accordance with the Hyundai Glovis transportation and handling manual.
Sudden braking and sudden onset by drivers were not considered.
This study experimented with the minimum number of vehicles that could be operated in two cycles, so the loading system experiment involved only the main ramp at the stern (without using the side ramp).
3.4.2. FlexSim simulation
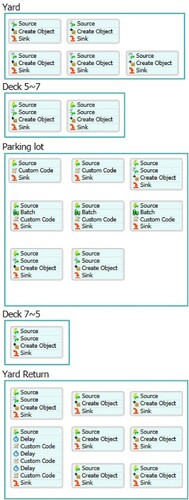
FlexSim is an object-oriented software tool that enables the simulation of objects with various attributes and functions, such as Java and C++. FlexSim displays the entire process visually while collecting information from the object (Pongjetanapong et al. Citation2018). As shown in , we can develop high-dimensional logic by combining rectangular modules, as in Arena. In addition, FlexSim can link logic with 3D models, which cannot be performed by Arena. The novelty of FlexSim is that the entity's maximum speed, acceleration, and deceleration can be set. Moreover, the sizes of figures are adjustable; the ability to change the size of the terminal, car, and background of the studied port enabled us to analyze the actual loading system. Therefore, this is the first study to propose a loading system for automobile terminals using the actual terminal size to identify non-value-adding activities.
Figure 4. FlexSim process flow development.
3.4.3. FlexSim simulation model for current loading system
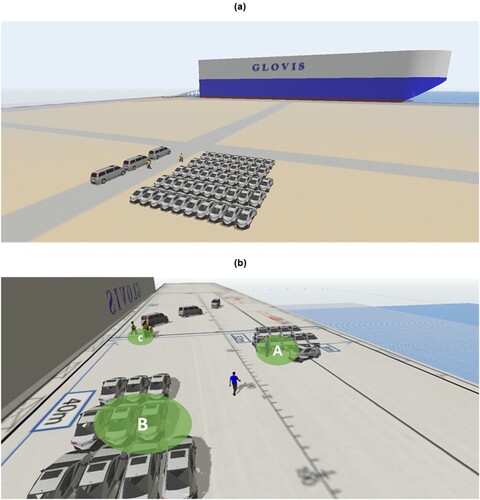
shows the FlexSim simulation model of the CAV loading system. Based on the main shipping sections, four main backgrounds were developed in three dimensions: the yard, external ramp, deck, and parking area. We created 48 cars for shipment and three shuttle vans (transportation means for the drivers in block e) using the Process Flow Create module. Then, we created 24 drivers and divided them into three teams. The drivers moved to the cars from the shuttle vans through the ‘round robin’ function of FlexSim ((a)). One car left the yard after the arrival of one driver. During the simulation, each car passed through the main road without crossing the other blocks because actual stowage operation loads thousands of vehicles that are placed in the other blocks. In the parking area, the vehicle arriving from the internal ramp waited at position A. Then, three parking attendants approached the vehicle from position B for parking. Meanwhile, the drivers left the cars and waited for the shuttle van at position C ((b)). After the eight drivers gathered and the shuttle van arrived, the drivers returned to the yard. Once the shuttle van returned to the yard, the group of eight drivers started the next round of work straight away, and the other groups followed.
Figure 5. Simulation model of current loading system in FlexSim: (a) yard, (b) parking area.
3.4.4. FlexSim simulation model for CAV loading system
Self-driving cars use a grid map to identify their current location and plan paths to their destination. A-Star algorithm is one of the most popular algorithms in path planning. A-Star algorithm use heuristic functions to find paths to the target point. The conventional A-Star algorithm is given as follows:
(1)
(1) where f(x) is the cost function from an initial point to destination. g(x) is the cost value of the current state and h(x) is the next state and heuristic function. The interface of FlexSim Simulation consists of a grid of numerous squares, and the A-Star module, which finds the shortest paths, is available. The objects included in A-Star module circumvent the barriers and travel to the destination by the shortest path. All self-driving cars in the CAV loading system were designated as objects of A-Star module.
The interface of the CAV loading system is similar to that of the current loading system. We first created 48 self-driving cars in block e using the Process Flow Create module. We did not create shuttle vans and drivers in the CAV loading system because drivers are not required by the operation. All 48 cars moved to the ship one by one at the start of the simulation. The maximum number of vehicles that could park in the parking area simultaneously was limited to three considering the spatial margin of the y axis.
4. Results
4.1. Current loading system
4.1.1. Simulation results for first and second cycles
We conducted simulation verification to ensure that all created objects flowed as intended (Durst et al. Citation2022). is a Gantt chart movement during the entire loading process. The gray, yellow, blue, dark blue, and green blocks represent vehicle movement times in the main shipping sections. Therefore, each series of blocks is the entire movement time of one car. Cars 1 to 24 were involved in the first cycle, and cars 25 to 48 were in the second cycle. The gap between the starting line and the gray block represents the time consumed by the driver to walk to the shuttle van. The first driver consumed 18 s for walking, boarding, and preparing before driving car 1. The drivers required an average of 7 s to reach the cars and an average of 3 s to move the cars to the starting point. Although the preparation time before departure varied between drivers, the departure sequence of the cars was constant because the 5 s rule was applied to all vehicles to prevent them from colliding with preceding cars (Park et al. Citation2021). However, full deceleration and longer safe following distance are required when entering the external ramp, so the following vehicles had to wait in front of the external ramp for 7 s before entering. Then, the vehicles needed an average of 1 min 33 s to reach deck 7 from the external ramp. In addition, the vehicle speed on the deck differed from that on the internal ramp, so a queue formed in front of the internal ramp. Consequently, the total travel time of car 24 exceeded that of car 1. The movement time of car 1 between the external ramp and deck 7 was 1 min 11 s, and that of car 24 was 1 min 55 s. In the parking area, the movement time of car 24 was 1 min 22 s longer than that of car 1 because the parking attendants were over-processing. The later cars had to wait until the earlier cars completed parking. Moreover, the parking attendants needed time to walk to a car after parking another car. After the eight drivers gathered and the shuttle van arrived, the drivers returned to the yard. Once the shuttle van returned to the yard, the group of eight drivers started the next round of work as soon as their arrival, and the other groups followed.
Figure 6. Simulation Gantt chart for current loading system.
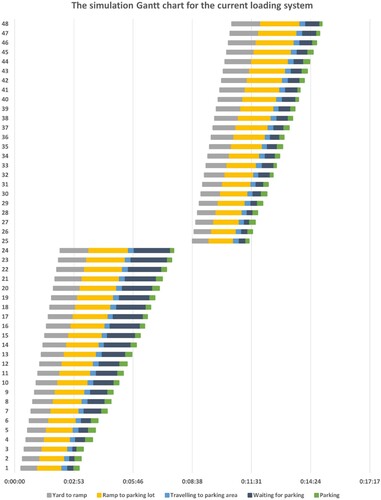
The process and results of the second cycle were similar to those of the first cycle, but their parking times differed. The time spent by the vehicles in the parking area was reduced significantly, and the reason is elaborated in Subsection 4.1.3. After the second cycle was completed, the final loading time was determined. The final loading time was the moment when all vehicles were parked and the shuttle van exited the vessel to remove all workers’ participation. In this study, the total loading time in the current loading system was 16 min 7 s. Lastly, there was a time gap between the first and second cycles. This gap was the movement time of the shuttle van, as explained in the following Subsection 4.1.2.
4.1.2. Simulation result for shuttle vans
The shows the main stop points of the shuttle vans in the yard, along with the coordinate origin. The shows the coordinates of the shuttle vans’ start/stop points. The shuttle vans operated separately from the vehicles to be loaded. The shuttle vans were to pick up drivers after they parked on deck 7. As a single shuttle van could transport a maximum of eight drivers (one team), three shuttle vans were used to transport the three gangs of stevedores. The first shuttle van departed at 2 min 18 s, which was 5 s later than the last car of the cycle. Then, the other shuttle vans followed. The group of workers in each shuttle van resumed their work immediately upon returning. All the cars in the vessel finished parking on deck 7 while the third shuttle van returned to the yard. Therefore, there was no additional queue for the first car of the second cycle when it entered the parking area.
Figure 7. Stop points of shuttle vans.
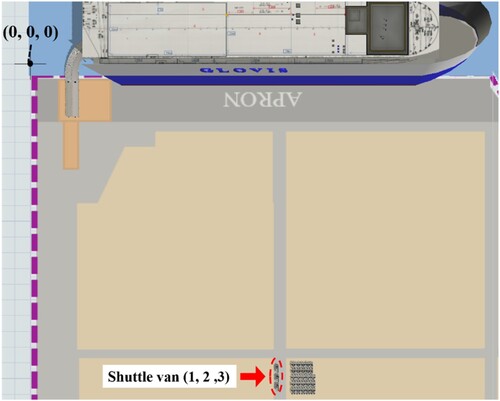
Table 6. Coordinates of start/stop points of shuttle vans (unit: x, y, z axis).
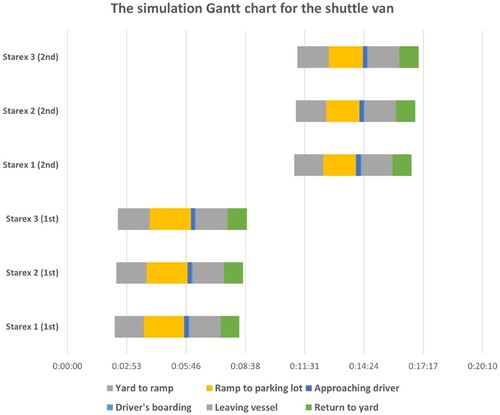
is a Gantt chart showing the travel times of the shuttle vans from the time they left the yard to the time they returned to the yard. From the perspective of the Toyota Production System, the operation of shuttle vans is a non-value-adding activity. Therefore, while these series of blocks are essential for current operations, they also represent potential areas for improvement through the implementation of the CAV loading system.
Figure 8. Simulation Gantt chart for shuttle vans.
4.1.3. Average waiting time in current loading system
displays the average waiting time in the section where congestion occurred during the loading process. The average waiting time in front of the external ramp was 17.85 s, and the average waiting time in front of the internal ramp, which was connected to deck 6, was 26.33 s. Lastly, the average waiting time in the parking area was 45.54 s, which was the longest. A queue formed because the ramp was a narrow pathway connecting the deck, land, and vessel, which limited the speed and number of vehicles that could pass. In addition, a queue formed in the parking area because the number of parking attendants was smaller than the number of vehicles entering for parking. shows the average time consumed by each parking attendant to park vehicles. The walking times of the parking attendants were longer than their parking times. The average walking times in the first and second cycles were 22 and 16 s, respectively, whereas the average parking time of the two cycles was 13.85 s. Therefore, during the parking process, the parking attendants consumed a long time for walking.
Table 7. Average waiting times at bottlenecks in current loading system (unit: s).
Table 8. Average parking times of parking attendants (unit: s).
Consequently, the vehicles consumed the shortest time passing through the yard despite that the actual vehicle travel distance from the yard to the external ramp was the longest compared with the other sections. On the contrary, the vehicles consumed the longest time moving from the external ramp to deck 7 because of the waiting time. The second-longest waiting time of the vehicles was in the parking area. However, the average waiting times in the parking area during the first and second cycles differed by 1 min 4 s and by 29 s, respectively, because the walking distance in the second cycle was reduced.
4.1.4. Simulation validation
Simulation validation was conducted to confirm how well the simulation model mirrored the actual loading system under the same input variables (Durst et al. Citation2022). The main input variables for the simulation were the numbers of car drivers, shuttle van drivers, parking attendants, and cars. In the studied port, an average of 76.66 cars are loaded on the ship on an hourly basis. With the same input variables, the simulation loaded 75.94 units per hour. With an accuracy of 99%, the simulation was deemed valid.
4.1.5. Simulation results for different working composition
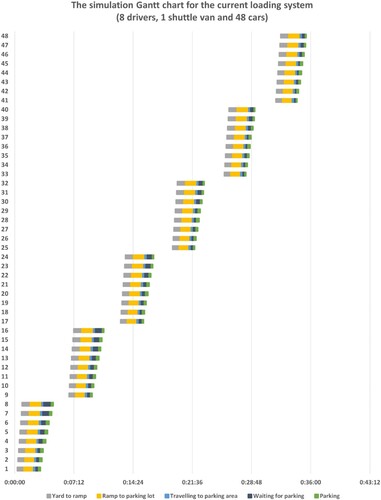
The composition of workers in automobile ports may vary depending on the working environment. shows the simulation result, which includes 8 drivers, a shuttle van, and 48 cars. In this scenario, the loading operation involved six cycles, and the total loading time was 36 min and 49 s.
Figure 9. Simulation Gantt chart for current loading system (8 drivers, 1 shuttle van, and 48 cars).
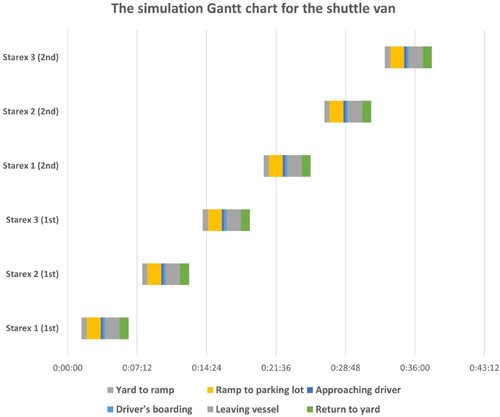
Likewise, the simulation result for the shuttle van involved six cycles, as shown in . Since a single shuttle van could transport a maximum of eight drivers, it had to make six round trips to complete the task.
Figure 10. The simulation Gantt chart for the shuttle van (8 drivers, 1 shuttle van, and 48 cars).
4.2. CAV loading system
4.2.1. Simulation result for CAV loading system
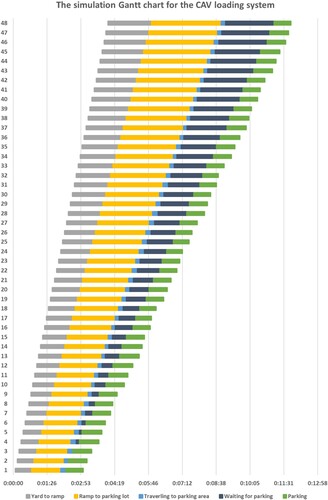
The simulation result for the CAV loading system showed that most of the non-value-adding activities of workers were removed. In the departure stage, the walking, boarding, and preparation of drivers before vehicle boarding were eliminated. The result for the CAV loading system showed a gap between the starting line and the gray block (). In addition, all vehicles could be loaded in a single cycle because the number of drivers did not affect the stowage operation. As shown in , the time gap between the first and second cycles in was removed, and cars 25 to 48 could be loaded consecutively. For the current loading system, car 25, which was the first car to depart in the second cycle, departed 9 min 1 s after the driver of car 24 left the deck at 5 min 49 s and returned to the yard at 8 min 43 s. For the CAV loading system, car 25 departed at 2 min 6 s, right after car 24 left the yard. Consequently, all non-value-adding activities caused by waiting for drivers to return to the yard were removed, which saved 4 min 19 s in terms of time. Ultimately, with a total loading time of 11 min 48 s, the CAV loading system improved the productivity of the current loading system by 26.78%.
Figure 11. Simulation Gantt chart for CAV loading system.
4.2.2. Average waiting time in CAV loading system
The vehicle travel time in the CAV loading system was longer than that in the current loading system because of the longer average waiting time in the main sections. displays the average waiting time in the main sections in the CAV loading system. The average waiting times in front of the external and internal ramps in the proposed system were longer than those in the current loading system because of the larger number of vehicles entering the vessel simultaneously in the former system. In the CAV loading system, the average waiting times in front of the external and internal ramps were 31.72 and 54.79 s, respectively. Compared with those in the current loading system, the average waiting times in the CAV loading system were 13.87 s longer in front of the external ramp and 27.46 s longer in front of the internal ramp. Hence, although the departure time of car 25 in the CAV loading system was earlier than that of the current loading system, its arrival at deck 7 was not so much different. In addition, the average waiting time within the parking area was 62.79 s which is 17.25 s longer than that of the current loading system. The average parking time in the CAV loading system was longer by 18 s. In other words, the vehicles’ passing speed in the main sections decreased in the CAV loading system.
Table 9. Average waiting times within main sections in CAV loading system (unit: s).
5. Conclusions and future work
The current loading systems in automobile terminals heavily depend on workers, and most of the cycle time is consumed by non-value-adding activities done by workers. Therefore, we identified these activities and developed a CAV loading system. To demonstrate the self-driving-car-loading system in an automobile terminal, we performed simulations using FlexSim by incorporating the actual size of the terminal, cars, and background of a real port. The simulation results were shown using Gantt charts containing blocks that depicted vehicle travel times in the main shipping sections. The walking time of workers, operation time of shuttle vans, and waiting time, which are non-value-adding activities, occupied most of the cycle time. In the current loading system, drivers consumed 18 s for preparation before driving a car. The walking time of the parking attendants exceeded their actual parking time. In addition, the operation time of the shuttle vans occupied a significant part of the entire loading process. Consequently, the total lead time until the start of the second cycle was 6 min 26 s, which occupied 39.93% of the cycle time. On the contrary, the CAV loading system eliminated all non-value-adding activities done by workers. First, in the departure stage, the walking, boarding, and preparation of drivers before driving the cars were removed. Second, the number of vehicles that could be loaded in a single cycle was not affected by the number of drivers, so all 48 cars moved to the ship at the start of the operation. However, the average waiting times in front of the external and internal ramps were longer than those in the current loading system because of the larger number of vehicles entering the vessel simultaneously. Therefore, the work speed in the main sections decreased. Nevertheless, the total loading time of the CAV loading system was 11 min 48 s, and compared with the current loading system, productivity increased by 26.78%. Consequently, operational efficiency improved.
The study makes valuable contributions to the field of transport research by addressing the productivity challenges faced by automobile terminals in port operations. While the productivity of automobile terminals is primarily influenced by human factors, the development and implementation of a CAV loading system presents an opportunity for automation in this sector. Moreover, the findings of what-if analysis of the study indicate the importance of determining the optimal speed for autonomous vehicles within the terminals. While higher speeds can improve efficiency, they can also lead to increased congestion. Terminal operators need to find the right balance to maximize overall performance. Further research should focus on establishing the optimal speed for CAVs, considering their advanced technologies, such as sensors. This research can help terminal operators make informed decisions that consider throughput, congestion, safety, and layout to enhance efficiency.
The results of this study have several implications for the integration of self-driving-car-loading systems into automobile terminal operations in ports. However, this study has limitations that merit future study. This study experimented using the minimum number of cars that could be tested in two cycles of stowage operation to compare the productivity of the two loading systems. Therefore, the final loading time at full vessel capacity was not obtained. An experiment involving the maximum number of vehicles that can be loaded on a ship is needed in future study. Second, we experimented with the CAV loading system based on the Hyundai Glovis transportation and handling manual, so the average waiting time in the main sections increased despite that the loading system was simplified. A suitable handling manual is needed for the CAV loading system to reduce queuing. Finally, this study highlights the productivity benefits of implementing a CAV loading system. Nonetheless, improving terminal productivity can be valuable. For instance, terminal operating costs can be reduced. Worker wages account for a significant portion of terminal operating costs (Park et al. Citation2022). Therefore, in future studies, economic benefits will be studied considering worker wages in each port.
Acknowledgements
The authors would like to thank the anonymous reviewers and handling editors for their constructive comments that greatly improved this article from its original form.
Disclosure statement
No potential conflict of interest was reported by the author(s).
Additional information
Funding
References
- Abourraja, M. N., N. Kringos, and S. Meijer. 2022. “Exploiting Simulation Model Potential in Investigating Handling Capacity of Ro-Ro Terminals: The Case Study of Norvik Seaport.” Simulation Modelling Practice and Theory 117: 102513. doi:10.1016/j.simpat.2022.102513.
- Ahn, S. S., J. B. Lee, J. J. Kim, Y. H. Sohn, and H. M. Koo. 2021. “A Study on the Design of the Import/Export Ports Cyber-Physical System for Intelligent Vehicle.” Journal of the Korea Academia-Industrial Cooperation Society 22 (12): 25–35. doi:10.5762/KAIS.2021.22.12.25.
- Bai, X., H. Jia, and M. Xu. 2022. “Identifying Port Congestion and Evaluating its Impact on Maritime Logistics.” Maritime Policy & Management 0 (0): 1–19. doi:10.1080/03088839.2022.2135036.
- Becker, T., C. Illigen, B. McKelvey, M. Hülsmann, and K. Windt. 2016. “Using an Agent-Based Neural-Network Computational Model to Improve Product Routing in a Logistics Facility.” International Journal of Production Economics 174: 156–167. doi:10.1016/j.ijpe.2016.01.003.
- Bianco, D., A. Bueno, M. G. Filho, H. Latan, G. M. D. Ganga, A. G. Frank, and C. J. C. Jabbour. 2023. “The Role of Industry 4.0 in Developing Resilience for Manufacturing Companies During COVID-19.” International Journal of Production Economics 256: 108728. doi:10.1016/j.ijpe.2022.108728.
- Brooks, M. R. 2006. “Chapter 25 Issues in Measuring Port Devolution Program Performance: A Managerial Perspective.” Research in Transportation Economics 17: 599–629. doi:10.1016/S0739-8859(06)17025-0.
- Brooks, M. R., and T. Schellinck. 2013. “Measuring Port Effectiveness in User Service Delivery: What Really Determines Users’ Evaluations of Port Service Delivery?.” Research in Transportation Business & Management 8: 87–96. doi:10.1016/j.rtbm.2013.04.001.
- Çetin Er, C., and O. Ozcan. 2022. “Urban and Architectural Spatial Changes Based on Technology-Adapted Users: A Literature Review.” Technological Forecasting and Social Change 182: 121783. doi:10.1016/j.techfore.2022.121783.
- Chen, X., F. Li, B. Jia, J. Wu, Z. Gao, and R. Liu. 2021. “Optimizing Storage Location Assignment in an Automotive Ro-Ro Terminal.” Transportation Research Part B: Methodological 143: 249–281. doi:10.1016/j.trb.2020.10.009.
- Clarkson Research. 2022. Car Carrier Trade & Transport 2022. London: Clarkson Research Services Ltd.
- Cullinane, K., D. W. Song, and R. Gray. 2002. “A Stochastic Frontier Model of the Efficiency of Major Container Terminals in Asia: Assessing the Influence of Administrative and Ownership Structures.” Transportation Research Part A: Policy and Practice 36 (8): 743–762. doi:10.1016/S0965-8564(01)00035-0.
- de Jesus Pacheco, D. A., D. Møller Clausen, and J. Bumann. 2023. “A Multi-Method Approach for Reducing Operational Wastes in Distribution Warehouses.” International Journal of Production Economics 259: 108705. doi:10.1016/j.ijpe.2022.108705.
- Dias, J. C. Q., J. M. F. Calado, and M. C. Mendonça. 2010. “The Role of European «Ro-Ro» Port Terminals in the Automotive Supply Chain Management.” Journal of Transport Geography 18 (1): 116–124. doi:10.1016/j.jtrangeo.2008.10.009.
- Ducruet, C. 2022. “Port Specialization and Connectivity in the Global Maritime Network.” Maritime Policy & Management 49 (1): 1–17. doi:10.1080/03088839.2020.1840640.
- Durst, P. J., D. McInnis, J. Davis, and C. T. Goodin. 2022. “A Novel Framework for Verification and Validation of Simulations of Autonomous Robots.” Simulation Modelling Practice and Theory 117: 102515. doi:10.1016/j.simpat.2022.102515.
- Esteve-Pérez, J., J. E. Gutiérrez-Romero, and C. Mascaraque-Ramírez. 2021. “Performance of the Car Carrier Shipping Sector in the Iberian Peninsula Under the COVID-19 Scenario.” Journal of Marine Science and Engineering 9 (11): 1295. doi:10.3390/jmse9111295.
- Fan, D., A. C. L. Yeung, D. W. Yiu, and C. K. Y. Lo. 2022. “Safety Regulation Enforcement and Production Safety: The Role of Penalties and Voluntary Safety Management Systems.” International Journal of Production Economics 248: 108481. doi:10.1016/j.ijpe.2022.108481.
- Fischer, T., and H. Gehring. 2005. “Planning Vehicle Transhipment in a Seaport Automobile Terminal Using a Multi-Agent System.” European Journal of Operational Research 166 (3): 726–740. doi:10.1016/j.ejor.2004.03.042.
- Frank, A. G., L. S. Dalenogare, and N. F. Ayala. 2019. “Industry 4.0 Technologies: Implementation Patterns in Manufacturing Companies.” International Journal of Production Economics 210: 15–26. doi:10.1016/j.ijpe.2019.01.004.
- Ha, M. H., and Z. Yang. 2017. “Comparative Analysis of Port Performance Indicators: Independency and Interdependency.” Transportation Research Part A: Policy and Practice 103: 264–278. doi:10.1016/j.tra.2017.06.013.
- Ha, M. H., Z. Yang, and J. S. Lam. 2019. “Port Performance in Container Transport Logistics: A Multi-Stakeholder Perspective.” Transport Policy 73: 25–40. doi:10.1016/j.tranpol.2018.09.021.
- Halawa, F., H. Dauod, I. G. Lee, Y. Li, S. W. Yoon, and S. H. Chung. 2020. “Introduction of a Real Time Location System to Enhance the Warehouse Safety and Operational Efficiency.” International Journal of Production Economics 224: 107541. doi:10.1016/j.ijpe.2019.107541.
- Hashemi-Petroodi, S. E., S. Thevenin, S. Kovalev, and A. Dolgui. 2023. “Markov Decision Process for Multi-Manned Mixed-Model Assembly Lines with Walking Workers.” International Journal of Production Economics 255: 108661. doi:10.1016/j.ijpe.2022.108661.
- Hou, Q., and C. Ai. 2020. “A Network-Level Sidewalk Inventory Method Using Mobile LiDAR and Deep Learning.” Transportation Research Part C: Emerging Technologies 119: 102772. doi:10.1016/j.trc.2020.102772.
- Hou, G., S. Chen, and F. Chen. 2019. “Framework of Simulation-Based Vehicle Safety Performance Assessment of Highway System Under Hazardous Driving Conditions.” Transportation Research Part C: Emerging Technologies 105: 23–36. doi:10.1016/j.trc.2019.05.035.
- Howard, G. 2022. “Car Carrier Outlook Remains Positive.” Seatrade Maritime News, Accessed 16 December 2022. https://www.seatrade-maritime.com/dry-cargo/car-carrier-outlook-remains-positive.
- Hyundai Glovis. 2019. “Transportation and Handling Manual.” Accessed 28 May 2023. https://aar.com/standards/pdfs/GLOVIS%20Transportation%20and%20Handling%20Manual.pdf.
- Jia, B., K. Tierney, L. B. Reinhardt, and J. Pahl. 2022. “Optimal Dual Cycling Operations in Roll-on Roll-off Terminals.” Transportation Research Part E: Logistics and Transportation Review 159: 102646. doi:10.1016/j.tre.2022.102646.
- Kaptan, M. 2022. “Analysis of Accidents During Vehicle Stowage on RO-RO Vessels by Using Fuzzy Bayesian Networks.” Ocean Engineering 260: 111997. doi:10.1016/j.oceaneng.2022.111997.
- Khattak, Z. H., B. L. Smith, M. D. Fontaine, J. Ma, and A. J. Khattak. 2022. “Active Lane Management and Control Using Connected and Automated Vehicles in a Mixed Traffic Environment.” Transportation Research Part C: Emerging Technologies 139: 103648. doi:10.1016/j.trc.2022.103648.
- Klein, L. L., M. S. Tonetto, L. V. Avila, and R. Moreira. 2021. “Management of Lean Waste in a Public Higher Education Institution.” Journal of Cleaner Production 286: 125386. doi:10.1016/j.jclepro.2020.125386.
- Li, M., Z. Feng, W. Zhang, and S. Zhu. 2021. “What Affects Drivers’ Satisfaction with Autonomous Vehicles in Different Road Scenarios?.” Transportation Research Part D: Transport and Environment 100: 103048. doi:10.1016/j.trd.2021.103048.
- Lu, C. S., K. C. Shang, and C. C. Lin. 2016. “Examining Sustainability Performance at Ports: Port Managers’ Perspectives on Developing Sustainable Supply Chains.” Maritime Policy & Management 43 (8): 909–927. doi:10.1080/03088839.2016.1199918.
- Marlow, P. B., and A. C. Paixão Casaca. 2003. “Measuring Lean Ports Performance.” International Journal of Transport Management 1 (4): 189–202. doi:10.1016/j.ijtm.2003.12.002.
- Medal-Bartual, A., M. Molinos-Senante, and R. Sala-Garrido. 2016. “Productivity Change of the Spanish Port System: Impact of the Economic Crisis.” Maritime Policy & Management 43 (6): 683–705. doi:10.1080/03088839.2016.1182653.
- Mor, R. S., A. Bhardwaj, S. Singh, and A. Sachdeva. 2019. “Productivity Gains Through Standardization-of-Work in a Manufacturing Company.” Journal of Manufacturing Technology Management 30 (6): 899–919. doi:10.1108/JMTM-07-2017-0151.
- Nayak, N., P. Pant, S. P. Sarmah, M. Jenamani, and D. Sinha. 2022. “A Novel Index-Based Quantification Approach for Port Performance Measurement: A Case From Indian Major Ports.” Maritime Policy & Management, doi:10.1080/03088839.2022.2116656.
- Özkan, E. D., S. Nas, and N. Güler. 2016. “Capacity Analysis of Ro-Ro Terminals by Using Simulation Modeling Method.” The Asian Journal of Shipping and Logistics 32 (3): 139–147. doi:10.1016/j.ajsl.2016.09.002.
- Park, S. H., J. Hwang, H. Yang, and S. Kim. 2021. “Simulation Modelling for Automated Guided Vehicle Introduction to the Loading Process of Ro-Ro Ships.” Journal of Marine Science and Engineering 9 (4): 441. doi:10.3390/jmse9040441.
- Park, S. H., J. Hwang, S. Yun, and S. Kim. 2022. “Automatic Guided Vehicles Introduction Impacts to Roll-On/ Roll-Off Terminals: Simulation and Cost Model Analysis.” Journal of Advanced Transportation 2022: 14. doi:10.1155/2022/6062840.
- Park, S., S. Yun, and S. Kim. 2023. “Autonomous Vehicle-Loading System Simulation and Cost Model Analysis of Roll-On, Roll-Off Port Operations.” Journal of Marine Science and Engineering 11: 1507. doi:10.3390/jmse11081507.
- Pongjetanapong, K., M. O'Sullivan, C. Walker, and N. Furian. 2018. “Implementing Complex Task Allocation in a Cytology lab via HCCM Using Flexsim HC.” Simulation Modelling Practice and Theory 86: 139–154. doi:10.1016/j.simpat.2018.05.007.
- Rahman, M. H., M. Abdel-Aty, and Y. Wu. 2021. “A Multi-Vehicle Communication System to Assess the Safety and Mobility of Connected and Automated Vehicles.” Transportation Research Part C: Emerging Technologies 124: 102887. doi:10.1016/j.trc.2020.102887.
- Ray, S., and B. John. 2011. “Lean Six-Sigma Application in Business Process Outsourced Organization.” International Journal of Lean Six Sigma 2 (4): 371–380. doi:10.1108/20401461111189443.
- SAE International. 2021. Taxonomy and Definitions for Terms Related to Driving Automation Systems for On-Road Motor Vehicles. SAE. https://www.sae.org/standards/content/j3016_202104/.
- Santos, A. M. P., R. Salvador, J. C. Q. Dias, and C. G. Soares. 2018. “Assessment of Port Economic Impacts on Regional Economy with a Case Study on the Port of Lisbon.” Maritime Policy & Management 45 (5): 684–698. doi:10.1080/03088839.2018.1471536.
- Schramm, H.-J. 2020. “A Cliometric Approach to Market Structure and Market Conduct in the Car Carrier Industry.” Case Studies on Transport Policy 8 (2): 394–402. doi:10.1016/j.cstp.2019.03.012.
- Seo, J. H., J. M. Gong, T. H. Nam, and G. T. Yeo. 2017. “Analyzing Efficiency of Korean Automobile Port.” Journal of Navigation and Port Research 41 (3): 127–136. doi:10.5394/KINPR.2017.41.3.127.
- Sharma, I., and S. Mishra. 2022. “Quantifying the Consumer’s Dependence on Different Information Sources on Acceptance of Autonomous Vehicles.” Transportation Research Part A: Policy and Practice 160: 179–203. doi:10.1016/j.tra.2022.04.009.
- Shin, J. H., and H. N. Jun. 2014. “A Study on Smart Parking Guidance Algorithm.” Transportation Research Part C: Emerging Technologies 44: 299–317. doi:10.1016/j.trc.2014.04.010.
- Sun, X., S. Wang, Z. Wang, C. Liu, and Y. Yin. 2022. “A Semi-Automated Approach to Stowage Planning for Ro-Ro Ships.” Ocean Engineering 247: 110648. doi:10.1016/j.oceaneng.2022.110648.
- Todorrov, D. M. 2016. Ro-Ro Handbook: A Practical Guide to Roll-On Roll-Off Cargo Ships. Pennsylvania: Schiffer publishing.
- Woo, S. H., S. J. Pettit, and A. K. C. Beresford. 2011. “Port Evolution and Performance in Changing Logistics Environments.” Maritime Economics & Logistics 13: 250–277. doi:10.1057/mel.2011.12.
- Xiao, J., and K. G. Goulias. 2022. “Perceived Usefulness and Intentions to Adopt Autonomous Vehicles.” Transportation Research Part A: Policy and Practice 161: 170–185. doi:10.1016/j.tra.2022.05.007.
- Xiong, B.-K., R. Jiang, and X. Li. 2022. “Managing Merging from a CAV Lane to a Human-Driven Vehicle Lane Considering the Uncertainty of Human Driving.” Transportation Research Part C: Emerging Technologies 142: 103775. doi:10.1016/j.trc.2022.103775.
- Yadav, G., and T. N. Desai. 2016. “Lean Six Sigma: A Categorized Review of the Literature.” International Journal of Lean Six Sigma 7 (1): 2–24. doi:10.1108/IJLSS-05-2015-0015.
- Yao, Z., Y. Ma, T. Ren, and Y. Jiang. 2024. “Impact of the Heterogeneity and Platoon Size of Connected Vehicles on the Capacity of Mixed Traffic Flow.” Applied Mathematical Modelling 125: 367–389. doi:10.1016/j.apm.2023.09.001.
- Yao, Z., Y. Wu, Y. Wang, B. Zhao, and Y. Jiang. 2023. “Analysis of the Impact of Maximum Platoon Size of CAVs on Mixed Traffic Flow: An Analytical and Simulation Method.” Transportation Research Part C: Emerging Technologies 147: 103989. doi:10.1016/j.trc.2022.103989.
- Zhao, J., B. Liang, and Q. Chen. 2018. “The Key Technology Toward the Self-Driving Car.” International Journal of Intelligent Unmanned Systems 6 (1): 2–20. doi:10.1108/IJIUS-08-2017-0008.
- Zhao, J., H. Xu, H. Liu, J. Wu, Y. Zheng, and D. Wu. 2019. “Detection and Tracking of Pedestrians and Vehicles Using Roadside LiDAR Sensors.” Transportation Research Part C: Emerging Technologies 100: 68–87. doi:10.1016/j.trc.2019.01.007.