
 ?Mathematical formulae have been encoded as MathML and are displayed in this HTML version using MathJax in order to improve their display. Uncheck the box to turn MathJax off. This feature requires Javascript. Click on a formula to zoom.
ABSTRACT
The objective of this paper is to propose an analysis of the vulnerability of road transportation networks in response to external shocks. Through the estimation of the accessibility and Link Importance Indicator (LII), a vulnerability road transportation analysis has been carried out and applied to a real case study. The case study comprises the 112 districts of the metropolitan area of the city of Naples, in the south of Italy. The main findings of this study are represented by the accessibility indicator introduced, which can be considered a measure to capture the vulnerability due to disruptions in the road network, and the LII, which can be used to identify critical roads. The proposed methodology represents a useful tool for local administrations, transportation agencies, and civil protection that need to deal with emergency situations, which are becoming more common.
1. Introduction
Road transportation systems are consistently susceptible to many different types of disruptions. The latter, when happen, may affect the functioning of the whole urban transportation system. They might be natural disasters such as earthquakes, or floods, or human-made events such as terrorist attacks, strikes, and system failures caused by human error or sabotage. These service shocks decrease the network performance and the accessibility to many urban areas, causing severe impacts on the mobility of the residents with consequences on the economy of the whole area affected by the shock itself. As a matter of fact, cities and urban areas are becoming increasingly vulnerable to anthropic/natural disruptions. Furthermore, the damages brought to urban mobility depend on where the disruptions take place, which roads could be subject to these descriptions, and how long the service disruptions last. Transportation network vulnerability analysis aims to assess the effects of disasters on the transportation system and identifies the areas that are most susceptible to these impacts. A complementary approach to vulnerability analysis, extensively developed in the literature, is known as network criticality. This method allows for the identification of the most crucial components within the network based on the topological properties and transport characteristics of the network. Events that have caught the interest in the transportation vulnerability analysis are the Kobe earthquake in 1995 and the terrorist acts of September 2001 (Jenelius, Petersen, and Mattsson Citation2006). After these shocks numerous studies have been carried out with the purpose to estimate the vulnerability and the consequences on road networks due to different events: earthquakes (Chang Citation2003), floodings (Balijepalli and Oppong Citation2014; Kermanshah, Derrible, and Berkelhammer Citation2017; Sohn Citation2006), sea-level rise (Lu and Peng Citation2011) and public transport interruptions (Rodríguez-Núñez and García-Palomares Citation2014). Disasters may happen within a transportation network with varying probabilities, and the outcomes of these incidents differ. Assessing the vulnerability of a transportation network can be exceedingly challenging due to the intricate nature of probability and uncertainty associated with such events. Vulnerability analysis encompasses numerous concepts such as robustness, resilience, reliability, vulnerability, etc. These terms are all technical in nature and are used to evaluate the security of system operations, albeit from different perspectives. Among them, vulnerability and resilience are the most pertinent and representative concepts. While definitions may vary among authors, discussions regarding resilience and vulnerability are extensively covered in the literature.
In the current literature, the approaches focus on comprehending transportation vulnerability through the assessment of system performance both pre- and post-disruption. Several methodologies have been proposed in the transportation arena to assess vulnerability. However, in the transportation systems analysis, identifying vulnerable areas is insufficient since another related issue is ranking critical links. In the network criticality literature, several studies have been proposed concerning the ranking of the importance of links, with networks exposed to natural catastrophic events or minor short-term disruptive events (Francini et al. Citation2020; Rupi et al. Citation2015; Wang, Djahel, et al. Citation2016). Establishing which are the critical roads within a network, both from a topological and congestion point of view, would allow administrators to allocate the resources necessary for maintenance, making the network at the same time more robust and flexible with respect to accidents and external shocks.
In this study, two complementary approaches have been developed in order to identify vulnerable urban areas and critical roads. Vulnerable areas could be identified by using the concept of accessibility. The latter is often correlated to the concept of vulnerability (Chen et al. Citation2007; Lu and Peng Citation2011) and refers to the ease of reaching a desired destination (Bono and Gutiérrez Citation2011).
The objective of this paper is to propose a methodology for evaluating the network criticality and vulnerability analysis of urban areas through the estimation of accessibility and link importance indicators (Lu and Peng Citation2011; Rupi et al. Citation2015). The methodology will be applied to a real case study, i.e. the metropolitan area of the city of Naples, in the south of Italy.
The paper is organized as follows. In section 2 a literature review is reported. Section 3 deals with the methodology description. In section 4 results are reported, while in section 5 conclusions and further perspectives are described.
2. Literature review
The notion of vulnerability initially emerged in the literature on disasters during the early 1970s, and subsequently, it found its way into other disciplines, with its definition continually expanding. During the 1990s, the concept of vulnerability in relation to road networks gained importance, particularly after the Kobe earthquake in 1995 (Lu and Peng Citation2011). Since then, numerous research focused on the vulnerability of transportation networks, presenting various definitions and approaches to the subject. Nevertheless, there is no universally agreed-upon definition for the concept of transport system vulnerability. Berdica (Citation2002) provides the most referenced and recognized definition of vulnerability in transportation networks. According to Berdica, vulnerability in the road transportation system refers to its susceptibility to incidents that can significantly diminish the level of serviceability offered by the road network (Berdica Citation2002). Serviceability refers to the ability to utilize a link, route, or road within a network at a specific time. Another aspect Berdica (Citation2002) emphasized is that vulnerability is associated with the capacity to sustain operations after experiencing a disruption.
Taylor, Sekhar, and D'Este (Citation2006) suggested that a network becomes susceptible when the loss or deterioration of a few links or routes significantly reduces the reachability to the intended destination nodes. Also, Chen et al. (Citation2007) viewed a direct link between vulnerability and reduced accessibility caused by different disruptions.
According to Husdal (Citation2004), a network is considered vulnerable when it demonstrates limited functionality, characterized by issues such as non-serviceability, non-accessibility, and variability, particularly in specific circumstances. This vulnerability stems from a lack of redundancy, robustness, and resilience within the network.
There are some properties connected to vulnerability such as reliability, robustness, and redundancy. Reliability focuses on the frequency of occurrence of the disturbance, or better, on its probability (Rupi et al. Citation2015). In other words, transportation reliability can be interpreted as the probability of travellers successfully completing their trips between certain OD pairs (Wang et al. Citation2015).
The Multidisciplinary Center for Earthquake Engineering Research provided a clear definition for robustness: ‘Robustness refers to the capacity of a network to endure a certain level of stress or demand without experiencing degradation and to maintain effective functionality’. It indicates the network's ability to withstand external pressures and disruptions while efficiently performing its intended tasks. Lastly, redundancy represents the existence of alternative links or paths that can satisfy functional requirements in case of interruption, degradation, or loss of functionality of a certain element.
According to Gonçalves and Ribeiro (Citation2020), a system can exhibit vulnerability when it is susceptible to disruptions (due to poor robustness and limited capacity to absorb damages), while also possessing the ability to adapt and recover some of its initial characteristics through redundancy. In this scenario, the system displays both vulnerability and resilience simultaneously.
As emphasized by Russo and Vitetta (Citation2006), the vulnerability of a system can be defined as the capacity of the infrastructure, both physical and non-physical, to withstand and respond to emergencies. Consequently, it pertains to the resistance of the infrastructure in emergency situations, without being contingent on demand (Russo and Vitetta Citation2006).
Vulnerability is also connected to the concept of risk, in fact, vulnerability is seen as ‘society’s risk of transport system disruptions and degradations’ (Jenelius, Petersen, and Mattsson Citation2006). There are various ways to define risk, but the majority of definitions centre around two key factors: the probability of an event with adverse impacts occurring, and the magnitude and severity of the consequences resulting from that event. Jenelius, Petersen, and Mattsson (Citation2006) argue that vulnerability can be approached in a similar manner to risk, suggesting that the concept of vulnerability should be separated into two distinct components: probability and consequence.
Erath et al. (Citation2009) provided a similar definition: ‘vulnerability is the probability of failure due to a given hazard event multiplied by the sum of the direct and indirect hazard-induced consequences’.
Pan et al. (Citation2021) provided a definition of transportation system vulnerability from the perspective of supply and demand considering the impact of the system itself and its users: In fact, transportation systems can exhibit abnormal sensitivity to both internal and external risk scenarios, leading to a significant decrease in system capacity. Therefore, the service quality of the transportation system is noticeably diminished, resulting in reduced accessibility and increased travel costs (Pan et al. Citation2021).
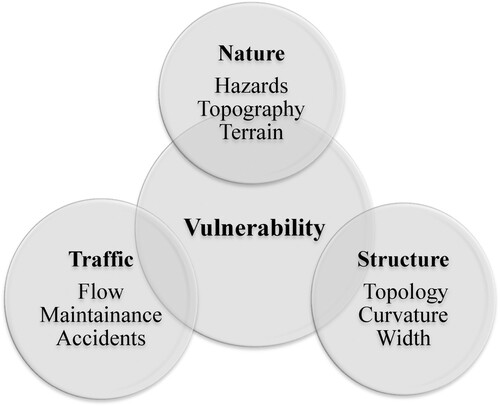
According to Husdal (Citation2004), the vulnerability of a transportation system is the result of three different elements: structure, nature, and traffic (see ). Indeed, vulnerability is closely connected to the physical body of the road, topology, geometry, width, curvature, gradient, tunnels, bridges, etc. Furthermore, vulnerability pertains to attributes of the natural environment, the topography, and to nature-given incidents, such as floods, heavy snow, earthquakes, etc. Finally, vulnerability concerns also with attributes describing traffic flow and attributes resulting in flow decrease, such as daily peak hours, as well as maintenance operations. shows the three different elements of vulnerability.
Figure 1. Elements of vulnerability. Source: Husdal (Citation2004).
Considering all these definitions of transportation network vulnerability reported in the literature, there are some correlated concepts that emerge among others: risk and accessibility.
As highlighted by Chen et al. (Citation2007), vulnerability can be seen as an issue arising from diminished accessibility caused by various disruptions. Specifically, a possible comprehensive definition describes vulnerability as the potential risk of the transportation system being exposed to natural/anthropic hazards, which can be measured through an accessibility reduction to a given node or to a given link (increased travel time and costs) and decrease of the system capacity in terms of traffic flow.
2.1. Measures of vulnerability
Road network vulnerability measures are often discussed from the perspective of accessibility (Chen et al. Citation2015; Lu, Peng, and Zhang Citation2014; Luathep et al. Citation2011; Sohn Citation2006; Taylor Citation2012; Taylor and D’Este Citation2005). An accessibility-based approach is able to effectively capture regional and traffic characteristics during the analysis considering population or employees, traffic volumes, distance, travel time and cost. Lu and Peng (Citation2011) used a location-based accessibility index to estimate the degradation of a network under sea-level scenario. This metric included population, residence, employment, and travel cost. Luathep et al. (Citation2011) provided a sensitivity analysis using a relative accessibility index based on the average path travel cost. Martin et al. (Citation2021) applied an accessibility-based approach to evaluate the territorial vulnerability of two Mediterranean region. The authors removed road sections from the networks using three different methods: random removal, deterministic removal in order of criticality, and deterministic removal in flood-prone areas. They found that deterministic removal of the most critical elements causes the most damage to the network. Papilloud and Keiler (Citation2021) tested two modified accessibility indices. These metrics included flood affected population, average shortest travel time and opportunities. The latter included employment and school places.
One of the measures of vulnerability, reported in the literature, is the increase of the generalized travel cost (i.e. time, distance, cost, etc.) for the users of the network (Jenelius, Petersen, and Mattsson Citation2006; Nagurney and Qiang Citation2012; Taylor, Sekhar, and D'Este Citation2006). In this formulation, the generalized travel cost is conceived as a simple measure of accessibility, indicating the difficulty connected when travelling between two locations.
Based on the increase in cost of travel Jenelius, Petersen, and Mattsson (Citation2006) proposed two measures: importance of a link and exposure. These metrics can be calculated with respect to a single node, to the municipalities and to the whole network. Taylor, Sekhar, and D'Este (Citation2006) suggested a weighted network travel time increase as a consequence of failure of link and an accessibility index called ARIA, which is an index of remoteness to estimate the social impacts of rural communities as a measure of regional vulnerability.
Multiple metrics have been proposed to estimate the criticality of links within a network considering transportation characteristics such as travel time, flow and capacity (Balijepalli and Oppong Citation2014; Li and Ozbay Citation2012; Rodríguez-Núñez and García-Palomares Citation2014; Snelder, Van Zuylen, and Immers Citation2012; Sullivan et al. Citation2010; Ukkusuri and Yushimito Citation2009). One of them is the Network Robustness Index (NRI) (Sullivan et al. Citation2010). It is a measure for evaluating the critical importance of a road and it is equal to the increase of the cost due to the demand re-assignment when the given road segment becomes not usable.
The Network Trip Robustness (NTR) is an index based on NRI (Network Robustness Index) and it has been calculated by adding all the individual NRI values for each link in the network and dividing by the total demand in the network (Luathep, Suwanno, and Taneerananon Citation2013). Li et al. (Citation2020) suggested a new metric called traffic flow betweenness index (TFBI) to identify critical links in large-scale road network. This parameter is a function of the minimum travel time, link flow, and the total traffic demand.
Balijepalli and Oppong (Citation2014) proposed a new vulnerability index considering the change in travel time, flow and capacity of a link before and after a flooding event. Snelder, Van Zuylen, and Immers (Citation2012) developed a framework which studied the relations between robustness, travel time and travel time reliability. They divided indicators of robustness into three groups: static indicators, which are independent of the traffic flow, dynamic indicators which are dependent on the traffic flow and indirect indicators which refer to travel time. They suggested to use an indirect indicator, travel time losses caused by incidents, to assess the robustness of a network.
Some studies evaluated the efficiency of a network due to a link closure considering topological properties (Chen et al. Citation2012; Freeman, Borgatti, and White Citation1991; Gu et al. Citation2020; Latora and Marchiori Citation2003; Nagurney and Qiang Citation2007). One of the most recognized metrics, originally proposed by Freeman, Borgatti, and White (Citation1991), is betweenness centrality, which assess the criticality of a link or node based on his frequency in the shortest path between nodes in a network. Latora and Marchiori (Citation2003) proposed the efficiency of the network as a measure to evaluate the impact on the network connectivity. Nagurney and Qiang (Citation2007) used this metric incorporating travel demand and travel cost. Eliminating one link at a time allows for assessing the decrease in network efficiency and determining which component is more critical. Gu et al. (Citation2020) proposed some system based and topological metrics including the Closeness Index, which measures the relative change in the average shortest distances between all nodes.
Sarlas, Páez, and Axhausen (Citation2020) proposed a hybrid metric called betweenness-accessibility index which includes topological properties and socio-economic features. The authors provided an empirical example estimating this metric to the road network of Zurich, Switzerland.
Mylonas, Mitsakis, and Kepaptsoglou (Citation2023) proposed various hybrid graph-theoretic parameters such as traffic volume centrality, to study the criticality of a link considering topological properties and the inputs/outputs of user equilibrium-based traffic assignment models. Gauthier, Furno, and El Faouzi (Citation2018) proposed a parameter that is a function of the travel cost increase and compared it with parameters referring to topological properties. They suggest that the proposed methodology is computationally expensive and not easily applicable to medium to large networks. On the contrary, topological indices are imprecise, failing to reproduce traffic patterns. Almotahari and Yazici (Citation2020) compared five metrics, including network efficiency proposed by Nagurney and Qiang (Citation2007) and ‘NRI’ proposed by Sullivan et al. (Citation2010). The authors provide a methodology for selecting a parameter from various alternatives based on topological and network congestion characteristics. Kermanshah and Derrible (Citation2016) combined topological indicators such as betweenness centrality with accessibility indicators to define a new parameter called vulnerability surface. The authors calculated this index to quantify the impacts on the road network of Los Angeles and San Francisco following an earthquake.
Some of these parameters have been studied in the paper of Jafino, Kwakkel, and Verbraeck (Citation2020). The authors provided a review of transport network criticality evaluating and comparing seventeen criticality metrics. They found that the network topology plays a fundamental role in bringing out an empirical similarity among the parameters. Nevertheless, they state that conceptually similar parameters do not necessarily have to have similar empirical evidence.
Other authors (Francini et al. Citation2020) proposed a Vulnerability Index (VI) including infrastructure components. The latter encompasses geometric properties such as road length and width, the availability of alternative routes (redundancy) in the area, and the presence of critical elements. Rupi et al. (Citation2015) developed a methodology in which the level of usage (traffic flow) and the impact on the general connectivity of the network are used to classify links. This methodology has been applied in this paper and will be presented in section 3.2.
Other contributions found evaluate link interruptions and alternative routing (Berdica and Mattsson Citation2007; Snelder, Van Zuylen, and Immers Citation2012). A network disruption event can restrict or delay travel on a particular road segment or a series of segments. When a network link is interrupted, routes need to be redirected, resulting in an overall increase in the total route length. In these cases, Morelli and Cunha (Citation2021) suggested that the user should always choose the shortest path connecting two points. Consequently, route efficiency can be evaluated by examining the changes in average minimum distances between points.
Finally, some resources also tried to institute a hierarchy among the links by employing a combination of different criteria or by using spatiotemporal patterns of alternative travel routes (Fang et al. Citation2012; Knoop, Hoogendoorn, and Van Lint Citation2012). In their study, Kumar et al. (Citation2019) identified three factors that determine the significance of a road within a network: connectivity to crucial facilities, traffic volume, and the number of origins and destinations it serves. Some of these metrics briefly described in this section have been collected in .
Table 1. List of some vulnerability/criticality metrics.
3. Methodology
In this paper two distinct analyses have been carried out. The first deals with the accessibility variation (decrease) due to the disruption of some critical roads and the second concerns the identification of a specific parameter for these roads to establish a ranking of importance between them.
The following sections show the methodology and how these analyses have been carried out.
3.1. Link accessibility-vulnerability
Accessibility is a crucial concept in transportation analysis and planning, as emphasized by Miller (Citation1999). It encompasses the notion of ‘ease’ in reaching various opportunities for activities and services. In literature, there are two general types of accessibility: active and passive. As stated by Cascetta, Cartenì, and Montanino (Citation2013), active accessibility refers to the ease with which individuals located in a particular zone can engage in various activities such as shopping, entertainment, education, work, and more. On the other hand, passive accessibility pertains to the ease with which an activity located in a specific zone can be reached by potential users, including clients, workers, providers, and others. This study considers active accessibility as a measure of vulnerability, and it is calculated with the following equation:
(1)
(1) where:
is the active accessibility of the origin node o;
We calibrated the values of and
using data related to the observed trips carried out with private transportation within the metropolitan area of the city of Naples, as reported in the Urban Plan for Sustainable Mobility (Piano Urbano della Mobilità Sostenibile – Città Metropolitana di Napoli, – Urban Plan for Sustainable Mobility – Metropolitan City of Naples Citation2022). Referring to a descriptive gravitational model,
represents the traffic demand between the origin
and destination
during the morning peak hour
and can be calculated as follows:
(2)
(2) where
is the number of jobs, provided by the Census, located in the destination node and
is the travel time between the
pair. The statistical tests for the validation of beta parameters are reported in .
Table 2. The statistical tests for the gravity model.
One of the expected effects of disruptions of critical roads is a decrease in accessibility in some areas. Accessibility is closely connected with vulnerability. Indeed, the vulnerability of a generic node can be regarded as a problem of reduced accessibility due to different disruptions (accidents, floods, etc.) and it can be calculated as follows:
(3)
(3)
where:
3.2. Link Importance Index
In this section, a hierarchy between roads has been proposed through the estimation of the Link Importance Index (LII) introduced by Rupi et al. (Citation2015). The following expression for the index has been estimated for a generic link
:
(4)
(4) where:
F is a function of
is called local importance and
is called global importance. As stated by Rupi et al. (Citation2015)
can take values between 0 and 1 and the specific value should be determined at the political level (Jenelius, Petersen, and Mattsson Citation2006). In this study, we consider local and global importance to carry equal weight; hence,
is equal to 0.5.
The local importance indicator is proportional to the link traffic. In fact, a road should be considered vulnerable when the volume of traffic along is increasing. To consider this, the local importance indicator has been defined as follows:
(5)
(5) where
and
are respectively the minimum and the maximum ADT measured on the set of links whose ADT is known.
The global importance function involves assessing , which represents the overall change in trip cost across the network resulting from the closure of a specific link
.
(6)
(6)
represents the total cost of the network when link j is closed,
represents the total cost of the undamaged network and
is the set of links under investigation.
The total trip cost C is the sum of all generalized trip costs paid by all users and is calculated as:
(7)
(7) where
The global importance index of a link, denoted as , can be estimated as:
(8)
(8) where
and
are the total minimum and maximum travel times computed through the software TransCAD.
represents the total trip cost variation when link
has been closed.
The above methodology has been applied to the case study of the metropolitan city of Naples.
4. Case study
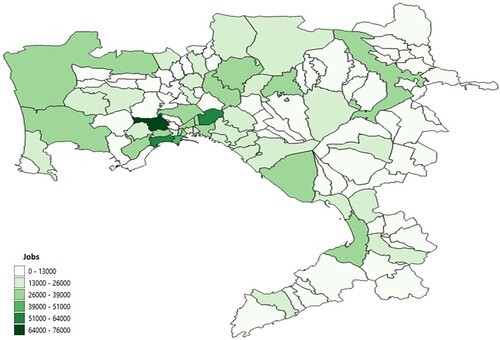
The road network of the metropolitan city of Naples serves an area of an extension of 1.179 square kilometres populated by 3,017,658 residents. Despite the metropolitan city of Naples covering only 8.6% of the regional territory, it concentrates over half of the entire population of the Campania region within its borders, making it one of the most densely populated areas in Europe. Almost a third of the inhabitants concentrate in the municipality of Naples alone, on a surface of just 119 square kilometres. Along the coastal strip, stretching from the municipality of Giugliano in Campania (second in population density in the entire metropolitan area) to the municipality of Castellammare di Stabia in the Sorrentine Peninsula, approximately half of the population is concentrated. 11% of the municipalities in the metropolitan area of city of Naples have a population fewer than 5000 inhabitants, while no municipality has a population below 1000 inhabitants. Above 100,000 inhabitants, there are only 2% of the municipalities, city of Naples and Giugliano in Campania, while half of the municipalities have a population ranging from 10,000 to 40,000 inhabitants. and show the active population and jobs distribution of the area. The active population consists of all citizens in the working age group (age range 16–65 years), while jobs are individuals who need to commute from their place of residence for work. Approximately 41% of jobs are concentrated in the municipality of Naples alone.
Figure 2. Active population distribution of the metropolitan area of the city of Naples. Source: Author’s elaboration.
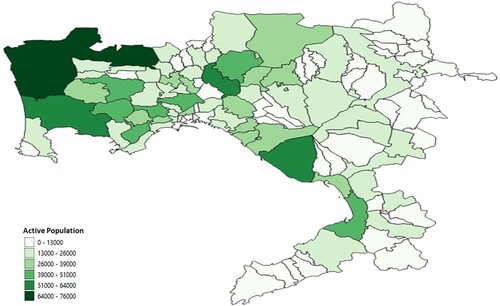
Figure 3. Jobs distribution of the metropolitan area of the city of Naples. Source: Author’s elaboration.
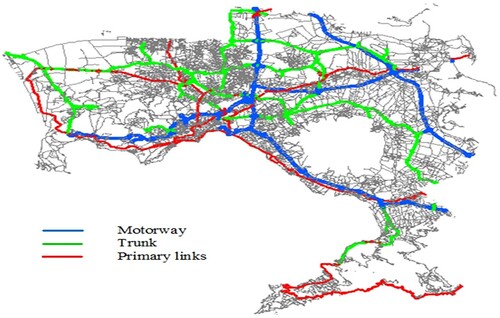
The area is crossed by A1, A3, A16, A30, and A56 motorways and by the national roads SS162, SS7, SS145, SS268, SS163. A graph of 75,184 links represents the area under study.
shows the main important road (motorway, trunk, and primary link) of the area.
Figure 4. Main links in the study area. Source: Author’s elaborations.
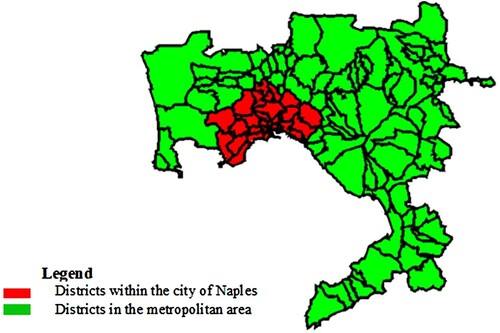
As shown in , the area was divided into 112 districts: 82 for every municipality in the metropolitan area of the city of Naples and 30 for the district within the city of Naples.
Figure 5. Districts of the metropolitan area of the city of Naples. Source: Author’s elaboration.
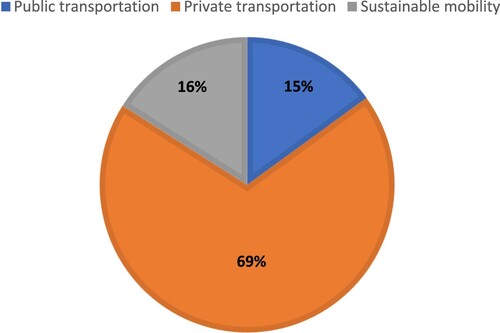
The matrix has been based on Urban Plan for Sustainable Mobility (Piano Urbano della Mobilità Sostenibile – Città Metropolitana di Napoli, – Urban Plan for Sustainable Mobility – Metropolitan City of Naples Citation2022) referring to a weekday and it provides the car demand between the 112 centroids included in the network model. The demand matrix was calculated based on some data related to telephone users. These are databases that store trips in each study area for a particular time period. The trips linked to phone users in transit within the metropolitan area of city of Naples area during October 2021 were acquired and processed. All the information is anonymized in compliance with current privacy regulations. Further details can be obtained by consulting section 5 of the Urban Plan for Sustainable Mobility. The database contains extensive information, including origin and destination traffic zones, purpose of the trip, and the mode of transportation used. As reported in the Urban Plan for Sustainable Mobility, the average number of trips recorded among the municipalities within the metropolitan area of Naples on a typical weekday is over 2.5 million. An interesting analysis proves to be that related to the purpose of trip and the mode of transportation used. As shown in during the morning hours (from 5 AM to 12 PM), 32% of trips are attributed are for work or school-related purposes. 37% of the trips are associated with other purposes, where under the category ‘other purposes’ are included all trips that neither have the usual place of study nor work as their origin or destination. The ‘home-home’ trips represent 31% of the total. In this category, there are trips that, despite crossing other cellular towers, never stayed for more than 30 min in any of them, thus having both the origin and destination coinciding with the cellular tower location of own residence. illustrates the modal distribution of trips during the morning peak hours on a typical weekday. As evident, the use of private modes of transportation (cars and motorcycles) is highly prevailing.
Figure 6. Distribution of the purpose of movement during the morning on a typical weekday. Source: Author’s elaboration based on Urban Plan for Sustainable Mobility.
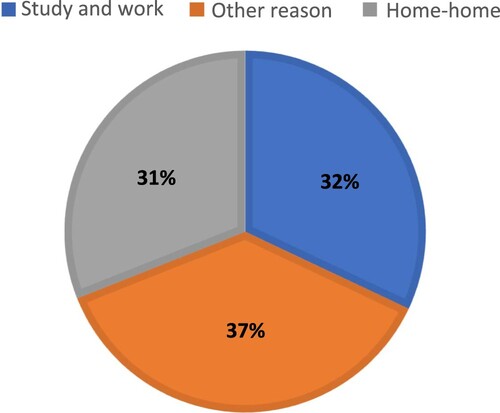
Figure 7. Modal distribution for internal movements within the metropolitan area of the city of Naples during the morning peak hours in a typical weekday. Source: Author’s elaboration based on Urban Plan for Sustainable Mobility.
These information were essential to estimate the average trips generated by each municipality during the morning peak hours on a typical weekday using private transportation (for further details, refer to tables 87 and 91 of section 5 of the Urban Plan for Sustainable Mobility, Piano Urbano della Mobilità Sostenibile – Città Metropolitana di Napoli, – Urban Plan for Sustainable Mobility – Metropolitan City of Naples Citation2022). Based on a gravity model for interaction between all OD pairs it was possible to complete the OD matrix using jobs as a weighting factor. The O-D matrix has been assigned to the road network using a stochastic user equilibrium approach (Cascetta Citation2009).
Using the TransCAD® software, some simulations have been conducted based on seven different hypotheses. points out the seven links investigated during the simulation.
Figure 8. Links investigated. Source: Author’s elaboration.
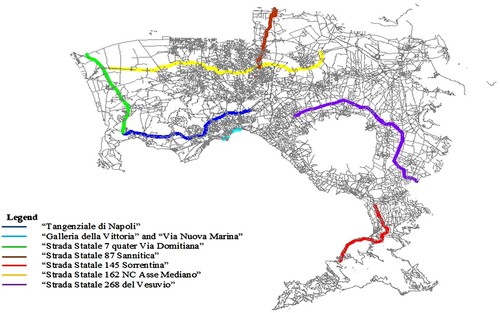
The basis scenario considers operating all the roads within the metropolitan area; this scenario provides the regular traffic flow in the area. In the first hypothesis, the road ‘Tangenziale di Napoli’ (A56) has been removed by the network (see ). This road is 20.2 kilometres long and crosses 10 districts. It is crossed by about 170,000 transits per day (source: Urban Plan for Sustainable Mobility Mobility – Metropolitan City of Naples Citation2022), its route starts at Capodichino, nearby the international Airport of Capodichino, and crosses the entire city of Naples from east to west until it reaches the Phlegraean area of Pozzuoli. The road consists of three lanes in each direction, and along its route, there are eight overpasses and four tunnels. This scenario tries to evaluate the global effect on the whole metropolitan area. The second hypothesis focuses on the local effects on human urban mobility caused by removing two important roads: ‘Galleria della Vittoria’ and ‘Via Nuova Marina’. They are primary links consisting of two lanes in each direction located in the centre of the city of Naples, some of the busiest streets in the city (see ). ‘Galleria della Vittoria’ extends for about 630 metres long while ‘Via Nuova Marina’ is 845 metres long. These roads are some of the main connecting roads for users coming from the western part of the city to the seaport, these links crossed three districts. In the third scenario the road ‘Strada Statale 7 Domitiana’ has been removed from the network. This link crosses two districts located in the western parts of the area (see ). It is one of the access roads to the centre of the metropolitan area for users coming from the north. Starting from the border between Lazio and Campania regions on the Garigliano river, this trunk road, consisting of two lanes in each direction, extends for about 49 kilometres along the entire Domitian-Flegrean coastline. At the end of its development, it connects to ‘Tangenziale di Napoli’. During the simulation only the last sections of the road, which are about 13 kilometres long, inside the metropolitan area of city of Naples have been removed. The fourth hypothesis evaluates the damages caused by removing ‘Strada Statale 87 Sannitica’. This road links the city of Benevento with the metropolitan area of the city of Naples and crosses 5 municipalities of interest (see ). The road has two lanes in each direction and it’s 13.5 kilometres long. Along its route, it intersects with important arteries of the area such as the ‘Circumvallazione esterna di Napoli’, the trunk roads 162 ‘NC Asse Mediano’ and ‘Asse di supporto Nola-Villa Literno’.
The fifth scenario provides the effects on human mobility caused by the interruption of the ‘Strada Statale 145 Sorrentina’. This road links south-east parts of the area with the rest of the region and crosses 7 districts (see ). It is a single-lane, high-speed state road that connects the A3 Napoli-Salerno highway with the Sorrento Peninsula. The road is about 43 kilometres long, and along its route, there is a tunnel of over 5 kilometres that allows bypassing the winding and busy centre of the municipality of Vico Equense. The road crosses a very fragile territory from a hydrogeological perspective and it is the main connecting road to the major tourist destinations in the Sorrento Peninsula. Only the first sections of the road, which are about 7.6 kilometres long, inside the metropolitan area of city of Naples have been removed.
In the sixth scenario the link ‘Strada Statale 162 NC Asse Mediano’ has been removed by the network. This road connects the west and east parts of the area under analysis and crosses 8 districts located in the north part of the study area (see ). The road is 39 kilometres long, with two lanes in each direction and 8 kilometres of viaducts. It forms a tangential line inland to the north of Naples, connecting to other internal main roads and the Italian highway network.
The last hypothesis considers the interruption of the ‘Strada Statale 268 del Vesuvio’. This trunk road goes around the volcano’s Vesuvius and crosses 9 municipalities (see ). The current route is partially single-lane and partially dual-lane in each direction, extending for about 30 kilometres. This road crosses the entire inner Vesuvian area before terminating at the A3 highway. All these roads play a fundamental topological role and represent the main arteries of the network, being traversed every day by a very high number of users (source: Urban Plan for Sustainable Mobility – Metropolitan City of Naples Citation2022). The main characteristics of the case study are summarized in .
Table 3. Main characteristic of the case study.
Lastly, the LII was estimated for these six critical roads.
4.1. Results
By removing the critical road ‘Tangenziale di Napoli’ (A56), the accessibility of the metropolitan area of the city of Naples was reduced by an average of 16.83%. The effects are significant for the districts located in the northwest parts of the area. Furthermore, accessibility was reduced by an average of 43.08% only for the city of Naples. 39 are the districts with an important reduction in accessibility greater than 10%. This simulation shows that the metropolitan area of Naples is highly vulnerable with respect to scenario 1. shows the percentage accessibility variation in all the districts within the metropolitan area with respect to scenario 1.
Figure 9. Damaged districts by removing the road ‘Tangenziale di Napoli’ (scenario 1) from the network. Source: Author’s elaboration.
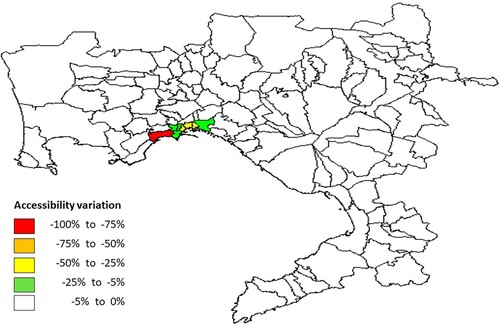
By removing the critical roads ‘Galleria della Vittoria’ and ‘Via Nuova Marina’ it was pointed out that the global accessibility of the area was not influenced meanwhile it was noted a reduction of 7.69% on average only for the city of Naples. For this scenario, five districts showed an accessibility reduction greater than 10%. shows the percentage accessibility variation in all the districts within the metropolitan area with respect to scenario 2.
Figure 10. Damaged districts by removing the ‘Galleria della Vittoria and Via Nuova Marina’ (scenario 2) from the network. Source: Author’s elaboration.
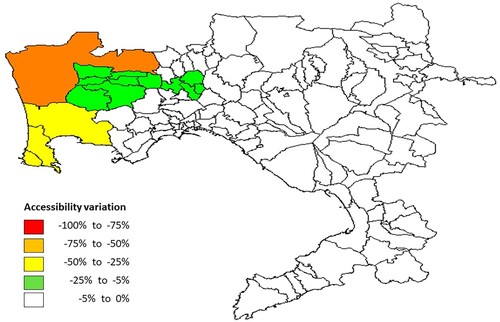
In the third scenario the global accessibility was reduced by an average of 2.55% and 4 municipalities registered an accessibility reduction greater than 10%. The main damaged districts are located in the northwest parts of the area. shows the percentage accessibility variation in all the districts within the metropolitan area with respect to scenario 3.
Figure 11. Damaged districts by removing the road ‘Strada Statale 7 quater Via Domitiana’ (scenario 3) from the network. Source: Author’s elaboration.
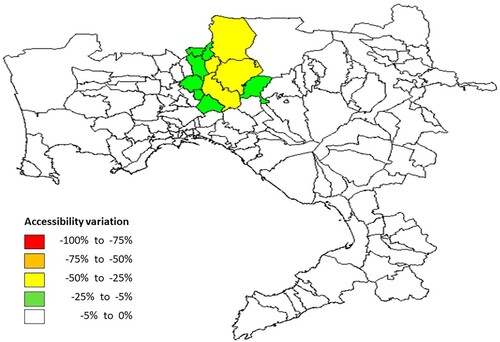
By removing the road ‘SS 87 Sannitica’ the accessibility of the metropolitan area was reduced by an average of 1.96%. The most important effects were concentrated in the northern part of the area. shows the percentage accessibility variation in all the districts within the metropolitan area with respect to scenario 4.
Figure 12. Damaged districts by removing the road ‘Strada Statale 87 Sannitica’ (scenario 4) from the network. Source: Author’s elaboration.
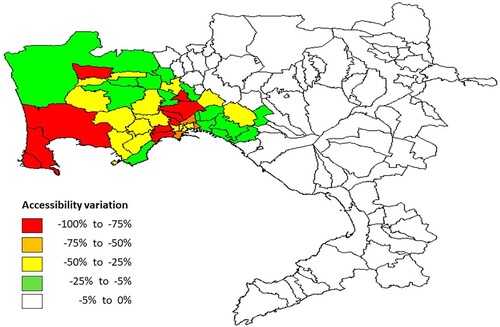
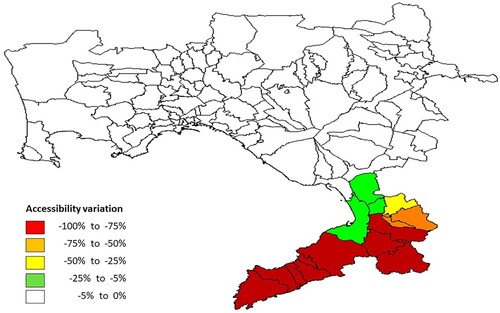
In the fifth scenario the removal of the ‘SS 145 Sorrentina’ caused a decrease of 9.27% in the area’s accessibility and the effects were significant for the south-east districts. The latter are vulnerable with respect to the closure of ‘SS 145 Sorrentina’. For this scenario, fourteen districts showed an accessibility reduction greater than 10%. shows the percentage accessibility variation in all the districts within the metropolitan area with respect to scenario 5.
Figure 13. Damaged districts by removing the road ‘Strada Statale 145 Sorrentina’ (scenario 5) from the network. Source: Author’s elaboration.
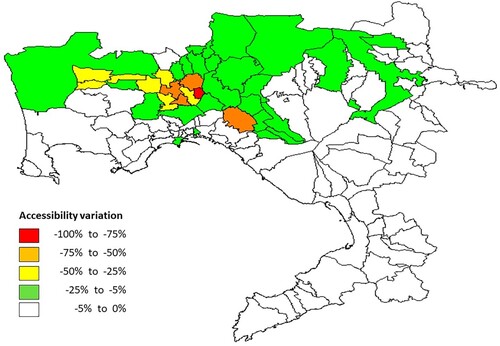
The removal of the ‘SS 162 NC Asse Mediano’ caused a considerable reduction of accessibility equal to 8.44% and 10.17% for the whole area and for the city of Naples respectively. Twenty-four municipalities with a decrease of accessibility greater than 10% were registered. shows the percentage accessibility variation in all the districts within the metropolitan area with respect to scenario 6.
Figure 14. Damaged districts by removing the road ‘Strada Statale 162 NC Asse Mediano’ (scenario 6) from the network. Source: Author’s elaboration.
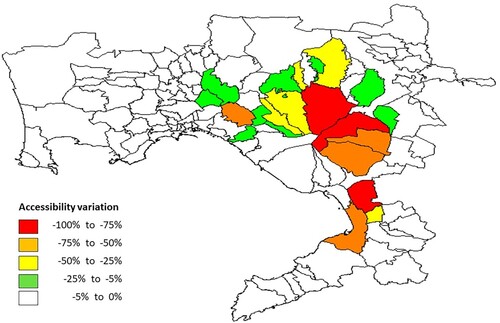
The last scenario provided the impacts by removing the ‘SS 268 del Vesuvio’. It was estimated an 8.33% reduction of accessibility and eighteen districts had a decrease of accessibility greater than 10%. shows the percentage accessibility variation in all the districts within the metropolitan area with respect to scenario 7. shows the percentage accessibility variation in all the districts within the metropolitan area with respect to scenario 7.
Figure 15. Damaged districts by removing the road ‘Strada Statale 268 del Vesuvio’ (scenario 7) from the network. Source: Author’s elaboration.
summarizes the effects on accessibility for the whole metropolitan area and for the city of Naples.
Table 4. Results.
Following Equation (4) a hierarchy between the roads has been established. The Average Daily Traffic () and the travel time were estimated using the TransCAD® software. The parameter β is equal to 0.5 giving the same weight to the global and local indices. summarizes the results for the seven links investigated.
Table 5. Link Importance Index.
According to Equation (7) ‘Tangenziale di Napoli’ and ‘Strada Statale 268 del Vesuvio’ are the main critical roads in the road network due to their daily traffic flows and their strategic geographic positions. These roads are located near the centre of the metropolitan area and serve the most densely populated part of the region. ‘Strada Statale 154 Sorrentina’ and ‘Strada Statale 87 Sannitica’ are quite important for the area, while ‘Strada Statale 7 Via Domitiana’ and ‘Galleria della Vittoria’ and ‘Via Nuova Marina’ are less important roads compared to other links of the metropolitan area.
5. Conclusions and further perspectives
This study evaluates the main impacts on urban mobility caused by the disruptions of some links in the metropolitan area of the city of Naples. The methodology used in this study captures the influence of travel time increases as a result of interrupted links. Another complementary investigated aspect was the importance, in terms of traffic flow and travel time (total user’s cost), of some critical roads.
This study provides quantitative results on the degree of network vulnerability and identifies vulnerable areas based on an accessibility-based index. Active accessibility could be a good measure to capture the breakdown in the road network and to identify some critical roads. Using the TransCAD® software, it was stated that the worst case could be the first scenario with the disruption of ‘Tangenziale di Napoli’. 39 districts might be considered vulnerable with an accessibility reduction greater than 10%.
Consistent and spread damages on mobility might occur if ‘Strada Statale 162 NC Asse Mediano’ or ‘Strada Statale 268 del Vesuvio’ were interrupted. These important roads for metropolitan human mobility caused an accessibility reduction greater than 10% for 24 and 18 districts respectively. The breakdown of ‘Strada Statale 268 del Vesuvio’ makes vulnerable 7 districts, located around the volcano, with an accessibility reduction greater than 50%.
There are some gaps in this research. The latter focused on a single mode of transportation, so the dynamic analysis of the number of users in the network and travel demand only considers the changes within this mode of transport. With the diversification of travel methods, the interconnection between different transportation systems has become increasingly significant. It is crucial to consider the changes and improvements that arise from the integration and combination of various transportation modes on the performance of the overall system. Another issue concerns the non-identification of the external shock that causes a closure in the network.
To improve on the methods introduced in this study, future investigations should consider a multimodal transport system and a better comprehensive vulnerability metric. This measure might include other aspects such as robustness, redundancy, rapidity, and resourcefulness.
One of the necessary measures to avoid or prevent shocks is to maintain a high level of maintenance on critical roads. Following traffic distribution and the topology structure of the network, it is possible to establish a priority of maintenance. According to the results obtained, it could be recommended a high level of maintenance on all the roads discussed, especially for ‘Tangenziale di Napoli’, ‘Strada Statale 268 del Vesuvio’ and ‘Strada Statale 145 Sorrentina’. These roads are crucial for the regular traffic flow and are fundamental for connecting districts to the others of the whole area.
Maintenance interventions are part of short-term strategies that administrators should necessarily adopt to guarantee a minimum level of network serviceability. However, nowadays, these actions are no longer enough. In section 4, the characteristics of the case study have been highlighted. As many urban areas in Italy, the metropolitan area of the city of Naples has been growing constantly all over the last years. Despite the municipality of Naples remains the economic and social centre of the area, over 66% of the inhabitants are concentrated in the neighbouring territory, outside the municipal boundaries. One of the effects of this urban sprawl is the increase of congestion linked to private transport demand. Indeed, as shown in , almost 70% of users choose private transportation for their trips. Considering also the increasing frequency of service disruptions due to extreme events connected to climate change, administrators should promote comprehensive long-term sustainable urban planning policies to reduce the vulnerability of the transportation system. The most crucial links investigated in this study are very long and congested arteries that cross a large part of the urban territory, for this reason it is necessary to support the development of different transportation modes. Public transportation should be improved by expanding the transportation supply and enhancing the existing one. Moreover, creating cycling and pedestrian paths, which the metropolitan area of Naples is not particularly equipped with, could further serve the residents of the area. The safety and efficiency of the road network could be also improved using autonomous vehicles and the widespread implementation of road monitoring systems. The latter are very useful for informing users in real-time about accidents and changes in road conditions. All these strategies should be implemented through the community involvement in decision-making process because they are crucial to ensure sustainable urban growth and improve citizens’ quality of life. In this process vulnerability and criticality analysis plays a fundamental role because, through monitoring the transportation system, it can assist administrators in allocating resources for maintenance interventions and reducing impacts on mobility.
Disclosure statement
No potential conflict of interest was reported by the author(s).
References
- Almotahari, A., and A. Yazici. 2020. “Impact of Topology and Congestion on Link Criticality Rankings in Transportation Networks.” Transportation Research Part D: Transport and Environment 87:102529. https://doi.org/10.1016/j.trd.2020.102529.
- Balijepalli, C., and O. Oppong. 2014. “Measuring Vulnerability of Road Network Considering the Extent of Serviceability of Critical Road Links in Urban Areas.” Journal of Transport Geography 39:145–155. https://doi.org/10.1016/j.jtrangeo.2014.06.025.
- Berdica, K. 2002. “An Introduction to Road Vulnerability: What Has Been Done, is Done and Should be Done.” Transport Policy 9 (2): 117–127. https://doi.org/10.1016/S0967-070X(02)00011-2.
- Berdica, K., and L. G. Mattsson. 2007. “Vulnerability: A Model-Based Case Study of the Road Network in Stockholm.” In Critical Infrastructure: Reliability and Vulnerability, edited by A. T. Murray and T. H. Grubesic, 81–106. Berlin: Springer.
- Bono, F., and E. Gutiérrez. 2011. “A Network-Based Analysis of the Impact of Structural Damage on Urban Accessibility Following a Disaster: The Case of the Seismically Damaged Port Au Prince and Carrefour Urban Road Networks.” Journal of Transport Geography 19 (6): 1443–1455. https://doi.org/10.1016/j.jtrangeo.2011.08.002.
- Cascetta, E. 2009. Transportation Systems Analysis, Models and Applications. New York: Springer.
- Cascetta, E., A. Cartenì, and M. Montanino. 2013. “A New Measure of Accessibility Based on Perceived Opportunities.” Procedia-Social and Behavioral Sciences 87:117–132. https://doi.org/10.1016/j.sbspro.2013.10.598.
- Chang, S. E. 2003. “Transportation Planning for Disasters: An Accessibility Approach.” Environment and Planning A 35 (6): 1051–1072. https://doi.org/10.1068/a35195.
- Chen, B. Y., W. H. Lam, A. Sumalee, Q. Li, and Z. C. Li. 2012. “Vulnerability Analysis for Large-Scale and Congested Road Networks with Demand Uncertainty.” Transportation Research Part A: Policy and Practice 46 (3): 501–516. https://doi.org/10.1016/j.tra.2011.11.018.
- Chen, X. Z., Q. C. Lu, Z. R. Peng, and J. E. Ash. 2015. “Analysis of Transportation Network Vulnerability Under Flooding Disasters.” Transportation Research Record 2532 (1): 37–44. https://doi.org/10.3141/2532-05.
- Chen, A., C. Yang, S. Kongsomsaksakul, and M. Lee. 2007. “Network-Based Accessibility Measures for Vulnerability Analysis of Degradable Transportation Networks.” Networks and Spatial Economics 7 (3): 241–256. https://doi.org/10.1007/s11067-006-9012-5.
- Erath, A., J. Birdsall, K. W. Axhausen, and R. Hajdin. 2009. “Vulnerability Assessment Methodology for Swiss Road Network.” Transportation Research Record 2137 (1): 118–126. https://doi.org/10.3141/2137-13.
- Fang, Z., S. L. Shaw, W. Tu, Q. Li, and Y. Li. 2012. “Spatiotemporal Analysis of Critical Transportation Links Based on Time Geographic Concepts: A Case Study of Critical Bridges in Wuhan, China.” Journal of Transport Geography 23:44–59. https://doi.org/10.1016/j.jtrangeo.2012.03.018.
- Francini, M., S. Gaudio, A. Palermo, and M. F. Viapiana. 2020. “A Performance-Based Approach for Innovative Emergency Planning.” Sustainable Cities and Society 53:101906. https://doi.org/10.1016/j.scs.2019.101906.
- Freeman, L. C., S. P. Borgatti, and D. R. White. 1991. “Centrality in Valued Graphs: A Measure of Betweenness Based on Network Flow.” Social Networks 13 (2): 141–154. https://doi.org/10.1016/0378-8733(91)90017-N.
- Gauthier, P., A. Furno, and N. E. El Faouzi. 2018. “Road Network Resilience: How to Identify Critical Links Subject to Day-to-Day Disruptions.” Transportation Research Record 2672 (1): 54–65. https://doi.org/10.1177/0361198118792115.
- Gonçalves, L. A. P. J., and P. J. G. Ribeiro. 2020. “Resilience of Urban Transportation Systems. Concept, Characteristics, and Methods.” Journal of Transport Geography 85:102727. https://doi.org/10.1016/j.jtrangeo.2020.102727.
- Gu, Y., X. Fu, Z. Liu, X. Xu, and A. Chen. 2020. “Performance of Transportation Network Under Perturbations: Reliability, Vulnerability, and Resilience.” Transportation Research Part E: Logistics and Transportation Review 133:101809. https://doi.org/10.1016/j.tre.2019.11.003.
- Husdal, J. 2004 Reliability/vulnerability versus cost/benefit. Nicholson AJ, Dante, A. Avaible at : https://d1wqtxts1xzle7.cloudfront.net/40534809/etc2004_epr08ii_husdal_rev-libre.pdf?1448971110=&response-content-disposition=inline%3B+filename%3DReliability_and_vulnerability_versus_cos.pdf&Expires=1710410894&Signature=FvPT0DBp2LXoL48~JTRyrhq6kboT8B2-AjnEKx6D2~7dlQVIMvB64WKlVO0tCE6TyIJW2AOJN8Khe6ODRw~faSipCdQQkaVn~lXMIKISUAQqYtsU8XHOz-dOjr1oOhan8HH6u4rqVVTS7rm9wIOPMK3nBf56hg2gpVNY0b3EhlLTB~es0s1RuKscxMhQVUxoFyhCrlmcMwinSBTLgzV6Eeu2f4MgzV1Fx4jKYEBLDAvOFfkQU7WilWqkou9pMchZQavLtaHDP9gbqnJ23QlLZOvbGuUcG7cx1O~zx8pGeCXOEjbkBp4BYtN8W7oNCgTPMuL8Acki2nnC9NfOB4t24A__&Key-Pair-Id=APKAJLOHF5GGSLRBV4ZA
- Jafino, B. A., J. Kwakkel, and A. Verbraeck. 2020. “Transport Network Criticality Metrics: A Comparative Analysis and a Guideline for Selection.” Transport Reviews 40 (2): 241–264. https://doi.org/10.1080/01441647.2019.1703843.
- Jenelius, E., T. Petersen, and L. G. Mattsson. 2006. “Importance and Exposure in Road Network Vulnerability Analysis.” Transportation Research Part A: Policy and Practice 40 (7): 537–560. https://doi.org/10.1016/j.tra.2005.11.003.
- Kermanshah, A., and S. Derrible. 2016. “A Geographical and Multi-Criteria Vulnerability Assessment of Transportation Networks Against Extreme Earthquakes.” Reliability Engineering & System Safety 153:39–49. https://doi.org/10.1016/j.ress.2016.04.007.
- Kermanshah, A., S. Derrible, and M. Berkelhammer. 2017. “Using Climate Models to Estimate Urban Vulnerability to Flash Floods.” Journal of Applied Meteorology and Climatology 56 (9): 2637–2650. https://doi.org/10.1175/JAMC-D-17-0083.1.
- Knoop, V. L., S. P. Hoogendoorn, and J. W. C. Van Lint. 2012. “Routing Strategies Based on Macroscopic Fundamental Diagram.” Transportation Research Record 2315 (1): 1–10. https://doi.org/10.3141/2315-01.
- Kumar, A., K. Haque, S. Mishra, and M. M. Golias. 2019. “Multi-Criteria Based Approach to Identify Critical Links in a Transportation Network.” Case Studies on Transport Policy 7 (3): 519–530. https://doi.org/10.1016/j.cstp.2019.07.006.
- Latora, V., and M. Marchiori. 2003. “Economic Small-World Behavior in Weighted Networks.” The European Physical Journal B-Condensed Matter and Complex Systems 32 (2): 249–263. https://doi.org/10.1140/epjb/e2003-00095-5.
- Li, F., H. Jia, Q. Luo, Y. Li, and L. Yang. 2020. “Identification of Critical Links in a Large-Scale Road Network Considering the Traffic Flow Betweenness Index.” PLoS One 15 (4): e0227474.
- Li, J., and K. Ozbay. 2012. “Evaluation of Link Criticality for Day-to-Day Degradable Transportation Networks.” Transportation Research Record 2284 (1): 117–124. https://doi.org/10.3141/2284-14.
- Lu, Q. C., and Z. R. Peng. 2011. “Vulnerability Analysis of Transportation Network Under Scenarios of Sea Level Rise.” Transportation Research Record 2263 (1): 174–181. https://doi.org/10.3141/2263-19.
- Lu, Q. C., Z. R. Peng, and J. Zhang. 2014. “Identification and Prioritization of Critical Transportation Infrastructure: Case Study of Coastal Flooding.” Journal of Transportation Engineering 141 (3): 04014082.
- Luathep, P., A. Sumalee, H. W. Ho, and F. Kurauchi. 2011. “Large-Scale Road Network Vulnerability Analysis: A Sensitivity Analysis Based Approach.” Transportation 38 (5): 799–817. https://doi.org/10.1007/s11116-011-9350-0.
- Luathep, P., P. Suwanno, and P. Taneerananon. 2013. “Identification of Critical Locations in Road Networks due to Disasters.” In Proceedings of the Eastern Asia Society for Transportation Studies, Vol. 9, 206, Hat Yai, Thailand.
- Martin, B., E. Ortega, R. Cuevas-Wizner, A. Ledda, and A. De Montis. 2021. “Assessing Road Network Resilience: An Accessibility Comparative Analysis.” Transportation Research Part D: Transport and Environment 95:102851. https://doi.org/10.1016/j.trd.2021.102851.
- Miller, H. J. 1999. “Measuring Space-Time Accessibility Benefits Within Transportation Networks: Basic Theory and Computational Procedures.” Geographical Analysis 31 (1): 187–212. https://doi.org/10.1111/gean.1999.31.1.187.
- Morelli, A. B., and A. L. Cunha. 2021. “Measuring Urban Road Network Vulnerability to Extreme Events: An Application for Urban Floods.” Transportation Research Part D: Transport and Environment 93:102770. https://doi.org/10.1016/j.trd.2021.102770.
- Mylonas, C., E. Mitsakis, and K. Kepaptsoglou. 2023. “Criticality Analysis in Road Networks with Graph-Theoretic Measures, Traffic Assignment, and Simulation.” Physica A: Statistical Mechanics and its Applications 629:129197. https://doi.org/10.1016/j.physa.2023.129197.
- Nagurney, A., and Q. Qiang. 2007. “A Network Efficiency Measure for Congested Networks.” Europhysics Letters 79 (3): 38005. https://doi.org/10.1209/0295-5075/79/38005.
- Nagurney, A., and Q. Qiang. 2012. “Fragile Networks: Identifying Vulnerabilities and Synergies in an Uncertain Age.” International Transactions in Operational Research 19 (1–2): 123–160. https://doi.org/10.1111/j.1475-3995.2010.00785.x.
- Pan, S., H. Yan, J. He, and Z. He. 2021. “Vulnerability and Resilience of Transportation Systems: A Recent Literature Review.” Physica A: Statistical Mechanics and Its Applications 581:126235. https://doi.org/10.1016/j.physa.2021.126235.
- Papilloud, T., and M. Keiler. 2021. “Vulnerability Patterns of Road Network to Extreme Floods Based on Accessibility Measures.” Transportation Research Part D: Transport and Environment 100:103045. https://doi.org/10.1016/j.trd.2021.103045.
- Piano Urbano della Mobilità Sostenibile – Città Metropolitana di Napoli, – Urban Plan for Sustainable Mobility – Metropolitan City of Naples. 2022. https://www.cittametropolitana.na.it/documents/10181/11878111/Allegato+0+%E2%80%93+Quadro+Conoscitivo+PUMS+-+Relazione.pdf/335c6fc6-0d93-400d-9c08-0763dbe73964
- Rodríguez-Núñez, E., and J. C. García-Palomares. 2014. “Measuring the Vulnerability of Public Transport Networks.” Journal of Transport Geography 35:50–63. https://doi.org/10.1016/j.jtrangeo.2014.01.008.
- Rupi, F., S. Angelini, S. Bernardi, A. Danesi, and G. Rossi. 2015. “Ranking Links in a Road Transport Network: A Practical Method for the Calculation of Link Importance.” Transportation Research Procedia 5:221–232. https://doi.org/10.1016/j.trpro.2015.01.003.
- Russo, F., and A. Vitetta. 2006. “Risk Evaluation in a Transportation System.” International Journal of Sustainable Development and Planning 1 (2): 170–191. https://doi.org/10.2495/SDP-V1-N2-170-191.
- Sarlas, G., A. Páez, and K. W. Axhausen. 2020. “Betweenness-Accessibility: Estimating Impacts of Accessibility on Networks.” Journal of Transport Geography 84:102680. https://doi.org/10.1016/j.jtrangeo.2020.102680.
- Snelder, M., H. J. Van Zuylen, and L. H. Immers. 2012. “A Framework for Robustness Analysis of Road Networks for Short Term Variations in Supply.” Transportation Research Part A: Policy and Practice 46 (5): 828–842. https://doi.org/10.1016/j.tra.2012.02.007.
- Sohn, J. 2006. “Evaluating the Significance of Highway Network Links Under the Flood Damage: An Accessibility Approach.” Transportation Research Part A: Policy and Practice 40 (6): 491–506. https://doi.org/10.1016/j.tra.2005.08.006.
- Sullivan, J. L., D. C. Novak, L. Aultman-Hall, and D. M. Scott. 2010. “Identifying Critical Road Segments and Measuring System-Wide Robustness in Transportation Networks with Isolating Links: A Link-Based Capacity-Reduction Approach.” Transportation Research Part A: Policy and Practice 44 (5): 323–336. https://doi.org/10.1016/j.tra.2010.02.003.
- Taylor, M. A. 2012. “Remoteness and Accessibility in the Vulnerability Analysis of Regional Road Networks.” Transportation Research Part A: Policy and Practice 46 (5): 761–771. https://doi.org/10.1016/j.tra.2012.02.008.
- Taylor, M. A., and G. D’Este. 2005. “An Accessibility Based Method for Vulnerability Analysis in Strategic Transport Networks.” Doctoral diss., NSW Transport and Population Data Centre.
- Taylor, M. A., S. V. Sekhar, and G. M. D'Este. 2006. “Application of Accessibility Based Methods for Vulnerability Analysis of Strategic Road Networks.” Networks and Spatial Economics 6 (3–4): 267–291. https://doi.org/10.1007/s11067-006-9284-9.
- Ukkusuri, S. V., and W. F. Yushimito. 2009. “A Methodology to Assess the Criticality of Highway Transportation Networks.” Journal of Transportation Security 2 (1–2): 29–46. https://doi.org/10.1007/s12198-009-0025-4.
- Wang, S., S. Djahel, Z. Zhang, and J. McManis. 2016. “Next Road Rerouting: A Multiagent System for Mitigating Unexpected Urban Traffic Congestion.” IEEE Transactions on Intelligent Transportation Systems 17 (10): 2888–2899. https://doi.org/10.1109/TITS.2016.2531425.
- Wang, Y., H. Liu, K. Han, T. L. Friesz, and T. Yao. 2015. “Day-to-Day Congestion Pricing and Network Resilience.” Transportmetrica A: Transport Science 11 (9): 873–895. https://doi.org/10.1080/23249935.2015.1087234.