
ABSTRACT
Previous research shows that well-grounded knowledge of the intended travellers is essential for achieving successful DRT services. However, there is a lack of understanding of the potential travels in different age groups, and the acceptance of design alternatives that may affect these. Based on surveys conducted in Sweden, this paper investigates these factors in a hypothetical DRT service, in the age groups 6–17, 18–69 and over 70 years. A total of 1241 people answered the questionnaires. The results show that the age groups have similar acceptance regarding delays and departure time intervals. Older adults have lower acceptance of digital solutions, and children and older adults have stronger requirements for value-added services. About 85–90% of the respondents claim they would use the service, at least occasionally. The results also show how a DRT system should be configured to allow room for system efficiency gains, while still being accepted by most travellers.
1. Introduction
In recent years, public transport actors have shown an increased interest in Demand-Responsive Transport (DRT). This interest can be derived from a need to investigate alternative transport solutions to, for instance, improve sustainability or cost efficiency, or to increase accessibility for different travel groups in the society. Naturally, DRT is not a solution that will solve all problems. On the contrary, DRT services often face many challenges in terms of high costs, low productivity in terms of passengers per revenue hour, and substantial vehicle kilometres (Coutinho et al. Citation2020; Currie and Fournier Citation2020; Pettersson Citation2019). Other barriers may relate to technological and service complexity challenges for travellers (Currie and Wong Citation2020). However, in some contexts, DRT services have shown to be a cost-efficient and more sustainable alternative to fixed transport lines (Coutinho et al. Citation2020; Dytckov et al. Citation2022; Wang et al. Citation2023). Moreover, from the traveller perspective, DRT has many times proven to be an attractive and relatively reliable transport service with reduced perceived travel time, compared to fixed transport lines (Alonso-González et al. Citation2018; Perera, Ho, and Hensher Citation2020). Regarding accessibility, DRT provides flexible solutions, often in terms of both time and routes, which means that the service can be used, for instance, to increase mobility options in areas with otherwise poor public transport services as well as to enable more convenient pick-up and drop-off points, and thus shorter walking distances (Coutinho et al. Citation2020; Perera, Ho, and Hensher Citation2020; Saxena, Rashidi, and Rey Citation2020).
DRT services provide transport ‘on demand’ by adapting the route and/or timetable to the travellers’ dynamic needs (Grosso et al. Citation2002; NASEM Citation2020). The vehicles, usually small buses, thereby do not stop at predefined places and/or times; instead, the current transport demand determines where and/or when to stop. A DRT service can be designed in many different ways; for instance, the routes may allow for many origins and many destinations (many-to-many), many origins to one/few destinations (many-to-few), or one/few origins to many destinations (few-to-many) (Davison et al. Citation2014). A DRT service operating as a feeder to conventional public transport is an example of a many-to-few service, and a DRT service that provides travel from door to door is an example of a many-to-many service. Furthermore, DRT services can be implemented in different environments, from rural to urban areas (Currie and Fournier Citation2020). For instance, Denmark has a DRT service called Plustur that has been in operation since 2018, which aims to improve accessibility in rural areas (Pettersson and Khan Citation2020), whereas in Germany, the MOIA service, also launched 2018, operates in urban and suburban areas with the mission to increase ridesharing (Gilibert et al. Citation2019; MOIA Citation2023). The study presented in this paper does not specify a particular type of service area, but have a more general focus on DRT as part of the public transport system, where a high level of ridesharing is an important target. The DRT service is thus assumed to be available for the public and fares are charged on a per passenger and not a per-vehicle basis. The service allows for many-to-many routes, and the traveller has to inform the system about pick-up and drop-off points as well as requested departure or arrival times.
Previous research has addressed several aspects of DRT, such as key success and failure factors of DRT services, potential traveller markets for DRT as well as the design and assessment of DRT systems. For instance, Currie and Fournier (Citation2020) show that DRT services with low operating costs and simple routes often have a higher potential for success than other DRT services. Furthermore, Wang et al. (Citation2014) have identified a number of characteristics of people living in areas where the demand for DRT services is relatively high: low car ownership, low population density, high proportion of white people, and high levels of social deprivation. Commuting DRT services, and DRT services for socio-recreational trips and airport/station access have all shown to offer potentials in terms of market shares (Ryley et al. Citation2014; Saxena, Rashidi, and Rey Citation2020; Wang et al. Citation2015; Weckström et al. Citation2018). The susceptibility to DRT in a particular population can be estimated using traveller preference surveys, or it might be possible to learn from other DRT experiences, in combination with knowledge of the current demographic and current trip characteristics (Jain et al. Citation2017). Moreover, guidelines for implementation or development of DRT services that identify key issues for the policy level, can also be found in research literature (Brake et al. Citation2007), as well as assessment frameworks for evaluating DRT systems (Alonso-González et al. Citation2018; Papanikolaou et al. Citation2017). Finally, many research studies use simulations to investigate different DRT system designs, for instance, with the objective to assess and compare system performances before actual implementation, or to optimize different configuration parameters (Dytckov et al. Citation2020; Ronald, Thompson, and Winter Citation2017; Xu and Huang Citation2009).
Unfortunately, many of the DRT services implemented over the years have failed. One of the reasons for these failures has been that the type or scale of the DRT system has not been appropriate for the intended market to be served (Davison et al. Citation2012). Thereby, having well-grounded knowledge of the traveller market is essential before introducing a new DRT service. Moreover, it is well known that people of different ages have different needs and preferences (Basarić et al. Citation2016). For instance, it has been shown that older people make fewer and shorter motorized trips than other travellers (Basarić et al. Citation2016; Hu, Wang, and Wang Citation2013), and that children have a higher tendency to use active transport modes, such as walking, bicycle, and scootering, than adults (Stark et al. Citation2018). However, in relation to DRT it is not yet clear how these different needs and preferences affect potential DRT travelling, i.e. to what extent people of different ages believe they would use a DRT service, and what preferences they have regarding different design alternatives that may affect their willingness to use it. In particular, there is a lack of knowledge of the acceptance limits regarding such design alternatives. For instance, having a large departure time interval may open up for a flexible vehicle route planning and efficiency gains from the operator’s perspective; however, it may be unacceptable for a large portion of the travellers who will then not use the service.
This paper presents the results from surveys, which provide an increased understanding of different factors that influence travellers’ use of DRT and the acceptance levels regarding different design configurations of DRT, in different age groups of travellers. Both differences and similarities between the age groups are identified. The results can, for instance, be used as guidance in how a DRT system should be configured to take most advantage of potential efficiency gains, for instance in terms of bus routeing, while their consequences are still accepted by the travellers. The traveller groups include children and young people (6–17 years), adults (18–69 years), and older adults (70 years and above).
The remaining part of this document is structured as follows. Section 2 describes the methodology used in the study. Section 3 presents and analyses the results, which are then discussed in Section 4. The paper ends with the conclusions, in Section 5.
2. Methodology
A quantitative approach with questionnaire surveys was used for this study. The reason for choosing surveys was to enable the study of people’s perceptions of different DRT configurations, before actual implementation. Thereby, more information about alternative configurations could be collected, which would otherwise be time-consuming, expensive, and maybe impossible to gather from real-world implementations. Three different data collections were made with slightly different methods. The surveys ask questions about acceptance of different configurations of a hypothetical DRT service and potential travel with the service.
2.1. Characteristics of the study region
All data were collected in Skåne, which is the most southern county in Sweden with approximately 1.4 million inhabitants. Statistics on the age distribution in the region show that 25% are under 20 years, 61% are between 20 and 69 years, and 15% are 70 years or older (SCB Citation2023a). The gender distribution varies slightly in the three age groups with 49% women in the youngest group, 50% women in the adult age group, and 53% women among the oldest (SCB Citation2023a). The studied region has three larger towns (with between 100,000 and 350,000 inhabitants) and a number of smaller towns and villages as well as countryside. The population density in the municipality with the largest town is 2277 persons per square kilometre and in the region as a whole 129 persons per square kilometre (SCB Citation2023b). The public transport system includes regional train service, regional bus service, and local buses in the 10 largest towns (there is also a tram route in one of the cities) with varying number of routes and degree of service. The region also provides Special Transport Service (STS) for older people and people with disabilities who are entitled to it. In some rural areas a service with smaller buses/taxis is offered, which one can order in advance according to a timetable, when or where there is no other public transport. A DRT service as described in this study does not exist in the region.
2.2. Data collection
The study includes datasets for three different age groups, children between 6 and 17 years of age, adults between 18 and 69 years of age, and older adults aged 70 years or older. The data from children were collected via a web panel organized by a commercial market research company, where people in advance had signed up to participate in different kinds of surveys. An online questionnaire was available for two weeks in December 2021. To be able to gather information about children’s thoughts about and potential use of DRT, the parents were approached. For the youngest ones (those in compulsory school), between approximately 6 and 15 years, the parents helped to answer the questions, but for the older ones the parents asked their teenagers to fill in the questionnaire by themselves. Clear instructions for this followed the invitation to participate. Parents in the whole region were invited to participate and in total, after cleaning the data, the dataset included answers from 401 children. Parents living in the three largest cities represented 51% of those who answered and the rest were scattered in the region. Data collection via panel was chosen because of difficulties with reaching children in other ways and the risk of a low response rate using other methods for data collection.
The data from adults were collected during three weeks in May/June 2021. Again, a web panel was used to be able to capture both existing and potential public transport travellers, in an efficient way. The sample was stratified to obtain an equal distribution of age (age groups 18–30, 31–43, 44–57, and 58–70 years) and gender in the region. The data collection closed when the sample included 343 answers.
Regarding the oldest age group, a questionnaire was sent out by post in February 2021 to a representative sample of people aged 70 years and older. An official data source (SPAR Citation2023) was used to identify the sample. The questionnaire was sent out together with an introductory letter and an envelope to send back the answer. There was also a possibility to answer online, but only six people chose this option. In total, 1500 questionnaires were sent out and 497 answers came back, which means a 33% response rate was achieved. Overall, the data collection included 32% children, 28% adults, and 40% older adults. Compared to the age distribution in the region (see 2.1), the sample is not representative. However, since we analyse the different age groups separately and compare them with each other, our goal has been to achieve as even distribution as possible between the age groups (i.e. equal amount of answers), rather than to get a representative distribution between the age groups.
Although the method to collect the data varied between the age groups, the questions included were more or less the same. A structured questionnaire was used including a first section with socioeconomic and other background questions about the respondent (e.g. gender, age, income, education, occupation, and household with some variations among the age groups), questions about prerequisites for travel (e.g. possession of driving licence, car in household), and travel habits (how often they travelled by car or public transport before the Covid pandemic). The questionnaire for the children was a bit different from the others since this first section was divided into one part addressing the parent and one part addressing the child. One of the questions in the surveys concerned place of residence. Three answer options were chosen, based on the classification used by the Swedish Board of Agriculture (a government agency in Sweden): towns with more than 10,000 inhabitants, towns between 1000 and 10,000 inhabitants and countryside with less than 1000 inhabitant (Jordbruksverket Citation2013). This classification was found appropriate for this survey, since the interest lies in distinguishing between people living in towns where there is public transport on a more regular basis, either local public transport or regional public transport passing through the town, and people living outside of these towns. The definition of rural in this survey is therefore places with less than 1000 people and areas where there are only scattered houses. In general, these areas have long distance to public transport and are only served by regional less frequent public transport, if any.
The second section, for all age groups, included questions about acceptance levels related to DRT configurations and a question about the respondent’s preferences towards using DRT. These questions were exactly the same for all questionnaires. Prior to these questions, a thorough description of a DRT service was provided to help the respondents understand and visualize the service, see Appendix 1. All data were collected during the time of the Covid pandemic, but the respondents were specifically asked to relate to a time without a pandemic when they answered the questions. Furthermore, some of the questions concerned the time of booking and changed conditions after booking. In these questions, the respondents were asked to base their answers on situations where they have no fixed appointment to keep. In the beginning of the questionnaire, time-fixed appointments were exemplified with doctor’s appointments and train connections, whereas other trips were intended to be viewed as less time bounded. For most trips people usually want to be on time; however, for many cases it is not essential to be on the minute. The aim was to cover the majority of trips and not focus on trips with very strict time limits.
2.3. Data preparations
For all age groups, there were some missing data, although this problem was minor for the children and adult data since the online questionnaire format minimized the risks of incorrect filling in. In order to get accurate comparisons between the age groups, the missing data and the answering alternatives ‘do not know’/’do not want to answer’ were treated equally. Thus, in cases where respondents had answered ‘do not know’/’do not want to answer’ these answers were recoded into missing values. The missing values were then not included in the frequency analysis or in the binary logistic regression analysis (described below).
Some questions included two or more scenarios and the scenarios were listed on different rows, and arranged according to deteriorating conditions. For instance, one of the questions asked about the respondent’s acceptance of travel time delays. Scenario row 1 asked about the acceptance for 5 min delay, scenario row 2 the acceptance for 10 min delay and scenario row 3 acceptance for 20 min delay. The possible answers to these alternatives was: Accept, Probably accept, Probably don’t accept, Don’t accept, Don’t know. For these questions, the respondents were supposed to provide one answer per scenario/row. However, some respondents in the sample of older adults have not provided an answer on each row. To be able to still use the answer from these respondents the gaps have been filled in. This was done when there was a logical pattern in the answers and clearly not a misunderstanding of the question. For instance, if the closest worse condition is positive (accept and probably accept) and the opinions provided follow an increasingly negative or neutral pattern, the opinion of the closest worse condition is copied to the better condition. Such complements were made for 17–21% of the responses of these types of questions, except for one question about accepted departure time interval (which was the first question of this structure), which required 29% complements, and two questions about acceptance of moving a stop (which were the last questions of this structure and unlike previous questions, they only included two possible answers), which required 8–9% complements. This problem with missing data did not exist in the two other samples, where data were collected via an online survey tool.
2.4. Data analysis
The statistical software SPSS version 28.0.1.1 (14) was used to analyse the data. Comparisons between the three age groups were done by presenting frequencies and test for differences between groups using Chi2-test (on a 0.05 level). A binary logistic regression was also used to investigate which respondents stated they would use DRT, based on continuous and nominal independent variables as shown in . The binary logistic regression was used since the dependent variable is binary; ‘would travel by DRT at least every month’ and ‘would travel less or not at all by DRT’. The question about how often a person believes they would use DRT in the future was constructed with five possible answers, ‘daily/almost daily’, ‘every week’, ‘every month’, ‘more seldom’, and ‘never’. Since the question was hypothetical and the respondents might have had difficulties being that specific, the variable was recoded into a binary variable.
Table 1. Independent variables included in the binary logistic regression analysis. Variables with * have been recoded from an ordinal scale to a dichotomy variable.
Independent variables coming from questions that in the questionnaire had answers on an ordinal scale, were recoded into dichotomy nominal scale. These were the questions about how important parents thought time-efficiency and sustainability were when choosing transport for their children, how often different modes of transport are used among adults and older adults, and how used older adults are to internet and searching for trips in an app on their mobile phone. Finally, income was divided into the groups under and above 35,000 SEK, and preferred and used transport mode into the groups public transport and other modes.
Since the three surveys were not completely identical, the data from each survey have been treated separately and three separate analyses have been performed.
3. Results and analysis
This section describes the results from the questionnaires in two parts. Subsection 1 describes the frequency results from the questions related to the respondent characteristics and contexts, as well as the questions focused on different DRT configurations. Subsection 2 presents the results from the binary logistic regression analysis, which is used to predict DRT travelling in different age groups. It also includes comparisons between the respondents’ different characteristics and anticipated travel with DRT.
3.1. Descriptive analysis results
The child respondent group included 401 respondents with an average age of 13.1 years. The older adults respondent group included 497 respondents with an average age of 77.4. The adults respondent group included 343 responses, with an average age of 43.1 years. The gender distribution was relatively even, ranging between 49% and 52% men, and thus between 48% and 51% women, for the different age groups. A bit more than half of the children and older adults (57% and 53%) lived in towns with more than 10,000 inhabitants, whereas the corresponding figure for the adults was 72%. Around 20% of all respondents lived in towns between 1000 and 10,000 inhabitants (22%, 17%, and 19%, respectively). However, 21% and 27% of the children and older adults, respectively, lived in rural areas, whereas the corresponding figure for the adults was only 11%. The vast majority of the respondents had access to private car in the household (83% for older adults, 84% for adults, and 92% for children). Among the older adults, 93% had a driving licence, while of the adults, a slightly smaller share, 85%, had a driving licence. Furthermore, of the older adults 44% travelled daily by car and 35% travelled by car once or several times a week. The corresponding figures for the adults were 39% and 32%, and for the children 25% and 32%. Of the older adults 4% travelled daily by public transport and 17% by public transport once or several times a week. The corresponding figures for adults were 20% and 16%, and for the children 37% and 6%.
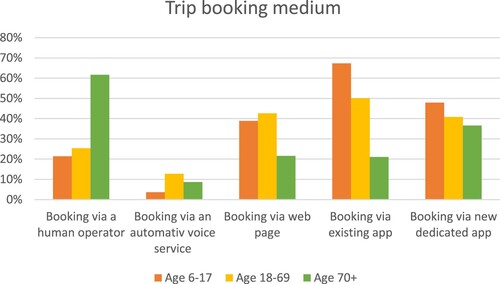
The frequency results from the DRT-related questions are listed in Appendix 2, together with the differences between the age groups and the significance levels of these differences. These results show that the older adults have a significantly higher acceptance of booking trips via telephone and talk to a human operator, than the other age groups (see ). Furthermore, children and adults have a higher acceptance for booking DRT trips via the existing travel planner app provided by the PT operator than using a new dedicated DRT app, whereas the opposite relationship holds for the older adults.
Figure 1. Accepted ways of booking a DRT trip.
The questionnaire also included a question of whether the respondents would require the possibility to book extra space for equipment, and what they in that case would book space for. The results show that around one-third of the children and the older adults require this possibility, whereas only 21% of the adults think this is necessary. The older adults would primarily book extra space for walkers, adults would typically book space for bicycles and strollers, whereas children would mainly book space for bicycles.
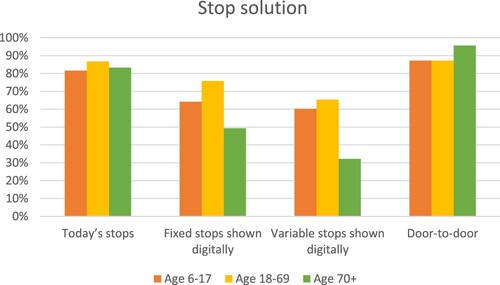
In general, most respondents accept door-to-door and today’s fixed and physically visible bus stops, see . Older adults have a significantly lower acceptance of stops that are only visible digitally in apps, compared to the other age groups. They also have a significant, but only slightly, higher acceptance for a door-to-door stop solution. About 60–70% of the children and adults accept digitally visible stops.
Figure 2. Accepted pick-up/drop-off stops.
When booking a DRT trip, the traveller may be provided with a time interval (instead of a fixed time), within which the DRT vehicle will arrive to pick up the traveller. A large time interval naturally gives more flexibility for the operator when planning the vehicle routes; in particular in systems that allows for late travel requests. The results regarding time intervals show that the differences between the age groups are relatively small and in most cases not significant. Almost all respondents accept a departure time interval of 5 min. and around 90% accept an interval of 10 min. Only about 50% accept a departure time interval of 20 min.
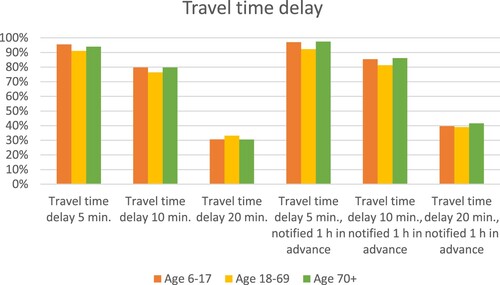
A DRT system can also be configured to allow for some departure time delays and travel time delays, in order to enable replanning of the routes (making the routes as efficient as possible). shows the different age groups’ acceptance of travel time delays. The differences between the groups are small and most often not significant. When providing information about the delay just before the time of departure, travel time delays of 5 min. are accepted by almost all respondents and just over 80% accept delays of 10 min. However, delays of 20 min. are only accepted by 28–37% of the respondents. Providing the delay information 1 h in advance results in similar figures for 5 and 10 min. delay. However, for 20 min. delay, the acceptance level is raised to just above 40% for all respondents. For older adults, receiving delay information 1 h in advance raises the acceptance levels slightly more than for the other age groups.
Figure 3. Accepted travel time delay, when delay information is given just before the time of departure or 1 h in advance.
The results concerning departure time delays show similar figures as the results concerning travel time delays.
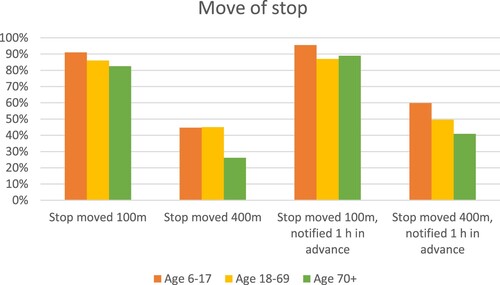
A DRT system can also be configured to allow for moving the pick-up or drop-off point after booking, in order to enable replanning of the routes. shows the acceptance levels when moving the stop 100 or 400 m further away from the original pick-up point, when information about the move is provided just before the time of departure and 1 h in advance, respectively. In general, moving a stop 100 m is accepted by over 80% of the respondents whereas moving it 400 m is accepted by considerably fewer. The differences between the age groups are mostly significant and show that older adults have a particularly low acceptance for moving a stop 400 m compared to the other groups, and that children have, in general, a higher acceptance of moving a stop. Providing information about the move 1 h in advance results in higher acceptance levels. In particular, for children and older adults the acceptance level increases by about 15%, when providing information about moving a stop 400 m 1 h in advance.
Figure 4. Accepted move of pick-up or drop-off point 100/400 m further away, when information about move is given just before the time of departure or 1 h in advance.
The questionnaires also included some questions related to value-added services. Some of these services require access to the traveller’s positioning data from their smartphones. The differences between the age groups concerning their acceptance of revealing positioning data are significant, and show that only 69% of the older adults accepted this, whereas the corresponding acceptance level for the adults and children were 81% and 87%, respectively.
shows the respondents’ stated needs for the following services:
Suggestions of nearby pick-up stops
Notification of when it is time to start walking to a pick-up stop
Digital map to the pick-up stop
Notification after boarding that confirms that the traveller is on the correct vehicle
Notification when it is time to get off the vehicle
Journey suggestion based on time, position, and personal history
Figure 5. Required value-added services related to DRT.
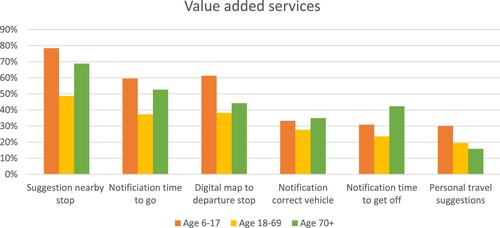
As can be seen, children and older adults have a significantly stronger requirement for most of these types of services, compared to the adults. The service providing suggestions of nearby pick-up stops is the service demanded most by all respondents.
In order to more easily be able to follow and identify a relevant DRT vehicle, information about the vehicles’ current positions, information about the vehicles’ planned route and stops, and information about the vehicles’ licence plates can be provided to the travellers. The results show that children have a (in most cases significantly) stronger requirement for these types of services than adults, and that adults, in turn, have a significantly stronger requirement than older adults for these services. Information about vehicles’ current position is the most demanded service, whereas information about vehicles’ licence plates is the least demanded. Finally, a service that allows for avoiding travelling in crowded vehicles is demanded by around 50% in all age groups.
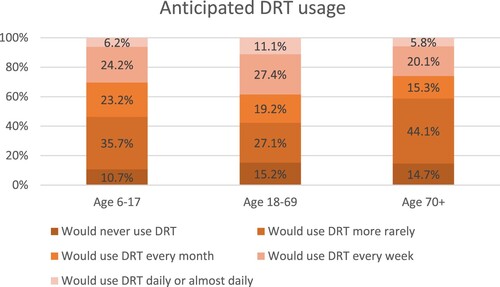
The questionnaire also included some questions that cannot be transformed into binary response categories. The results of these questions are shown in . shows that older adults have a significantly higher acceptance for booking long before departure, than the other respondent groups. For instance, booking at least 1 h in advance (or even longer) is acceptable for 53%, 50%, and 73% of the different age groups, whereas booking at least 30 min. in advance (or even longer) is acceptable for 88%, 85%, and 96% of the different age groups, respectively. shows that adults have significantly higher requirements on how fast a DRT trip must be, in comparison to children and older adults. shows that children have a significantly higher acceptance of variable ticket prices that are dependent on the risks of changing travel conditions (e.g. delays), and that older adults have a significantly higher acceptance of fixed ticket prices with no changes after booking, in comparison to the other respondent groups. shows that adults state that they would use a DRT service significantly more frequently than the other respondent groups. The results also show that 54% of the children, 58% of the adults, and 47% of the older adults would use a DRT service every month or more often.
Figure 6. Acceptance of booking a trip sometime before departure. Overall significance <0.001 for differences between age 18–69 and 70+ and between age 6–17 and 70+. Differences between age 6–17 and 18–69 are not significant.
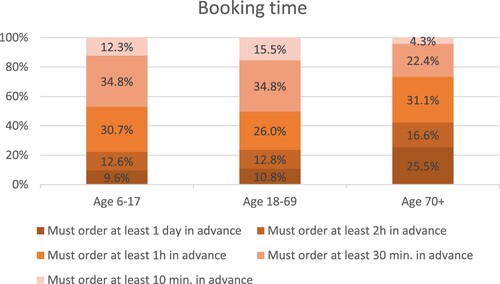
Figure 7. Acceptance of DRT travel time. Overall significance <0.001 for the differences between all age groups.
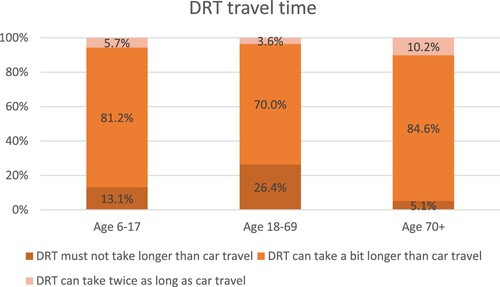
Figure 8. Acceptance of different ticketing solutions. Overall significance <0.001 for the differences between all age groups.
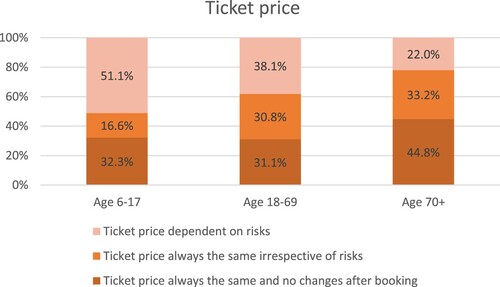
Figure 9. Anticipated usage of DRT service. Overall significance <0.001 for differences between age 18–69 and 70+. Differences between age 6–17 and 18–69, and between 6–17 and 70+ have significance <0.01.
3.2. Tests for differences between groups and binary logistic regression results
The following section presents the share of respondents in different subgroups of children, adults, and older adults, that state they would use DRT. Overall, there were small differences between groups.
shows the share in different subgroups of children who stated they would use DRT at least every month. There was only one significant difference, and that was between children whose parents had different preferred modes of transport, i.e. either by car, by public transport, or by walking/cycling. Those who have parents who preferred travel by public transport stated they would use DRT more than those who have parents who prefer walking/cycling or going by car. There were no other significant differences on a 0.05 level between different subgroups.
Figure 10. The percentage who state they would use DRT at least every month in subgroups of children, * indicates a difference with significance <0.05. City in this context refers to cities with more than 10,000 inhabitants.
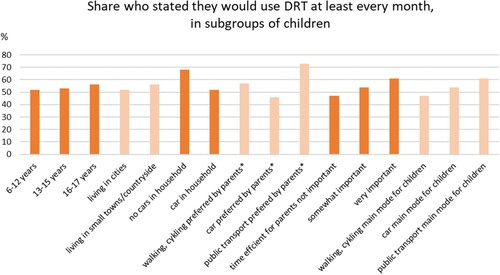
As a complement to , all relevant variables from which subgroups among children could be created are listed below. They are divided into whether there was a significant difference between the subgroups or not (on a 0.05 level) regarding the share who stated they would use DRT at least every month.
Significant difference: parents’ preferred transport mode.
No significant difference: gender, age-groups, parents’ level of education, household income, number of children in family, number of adults in family (one or more), living in big versus small cities (with more or less than 10,000 inhabitants), distance to city centre (more/less than 5 km), car in household, whether time efficiency is important for parents, whether environmental friendly transport is important for parents, distance to school (less/more than 1 km), child’s possibility to make the trips they want (always/seldom), most used mode of transport by child (0.073), preferred mode of transport by child.
shows subgroups of adults and the share who stated they would use DRT at least every month. Some significant differences (on 0.05 level) were found and the most evident difference was between those who are already travelling by public transport (77%) and those who are not (41%). There was also a difference between the age-groups of the adults showing that the youngest stated they would use DRT more than the other age-groups. There was a higher share who stated they would use DRT among adults living in cities compared to adults living in smaller towns or in the countryside.
Figure 11. The percentage who stated they would use DRT at least every month in subgroups of adults, * indicates a difference with significance <0.05. City in this context is cities larger than 10,000 inhabitants.
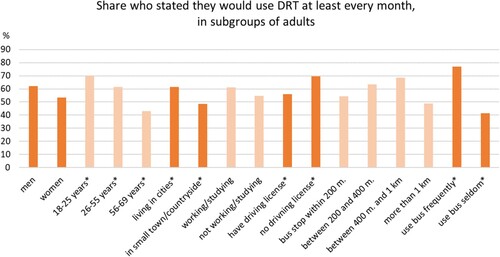
As a complement to , all relevant variables from which subgroups among adults could be created are listed below. They are divided into whether there was a significant difference between the subgroups or not (on a 0.05 level) regarding the share who stated they would use DRT at least every month.
Significant difference: age-group, living in cities (cities with more than 10,000 inhabitant) versus towns/countryside, children in household, possession of driving licence, travel frequency by bus, travel frequency by train, frequency of the nearest bus service, number of destinations during a car trip (question only for those using a car), number of destinations during a public transport trip (question only for those using public transport), distance between home and workplace (question for those working or studying).
No significant difference: gender, income, marital status, occupation (working full/part time versus not working), how often the person travel to the workplace (question only for those working or studying), car in the household, travel frequency by car, distance to the nearest bus stop.
shows subgroups among older adults and whether there were differences between them regarding the share who stated that they would use DRT at least every month. Overall few differences between groups were significant, but as for adults, there were differences between those who were already travelling by public transport (60% stated they would use DRT) and those who were not (32%). There was also a difference between those living in cities compared to those who were not (48% compared to 33%).
Figure 12. The share of respondents who state they would use DRT at least each month in subgroups of older adults, * indicates a difference with significance <0.05. City in this context is cities larger than 10,000 inhabitants.
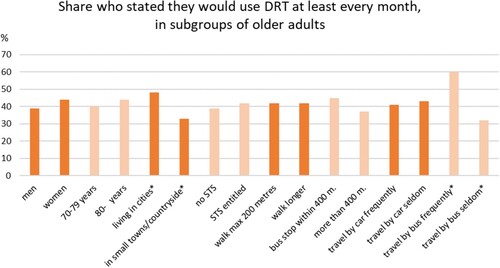
As a complement to , all relevant variables from which subgroups among older adults could be created are listed below. They are divided into whether there was a significant difference between the subgroups or not (on a 0.05 level) regarding the share who stated they would use DRT at least every month.
Significant difference: living in cities (cities with more than 10,000 inhabitants) versus towns/countryside, education level, used to internet, travel frequency by bus, travel frequency by train.
No significant difference: gender, age-group, walking capacity, using walking aid, used to mobile phones, used to apps on mobile phones, used to digital pay system, used to search for trips online, used to buy public transport tickets with apps, possession of driving licence, car in the household, entitled to STS, distance to the nearest bus stop (0,076), frequency of the nearest bus service, travel frequency by car.
The result from the binary logistic regression is shown in for all three age groups: children, adults, and older adults. Overall, most of the variables were not significant in any of the models. In the children survey, the only significant independent variable was ‘preferred transport mode for parent’, meaning that if the parent preferred to travel by public transport the child’s willingness to use DRT was higher. For adults the only significant variable was whether the person was already using public transport buses. If the respondent was already using public transport, the likelihood of using DRT was higher. For older adults two variables were significant, transport mode used and used to using internet. In the group of older adults, the likelihood of using DRT increased for those who are already using buses. The likelihood of using DRT is also higher among those who are used to using internet.
Table 2. Result from three binary logistic regression analyses, parents and children, adults, and older adults, with significance level 0.05 in bold.
4. Discussion
For all age groups, the proportions who claim they will never use the system is rather small, but on the other hand, the proportion who say they will use the system quite often is relatively limited as well. In the questionnaire, it was not stated whether DRT would be the only public transport option provided or if the DRT service would be a complement to other public transport services. This will most probably affect how much it will be used. The adults state they would use a DRT service significantly more frequently than the other respondent groups. This result goes against many other research studies, whose findings show that school children and retired people are the dominant users of DRT (Jain et al. Citation2017). One reason for this might be that, according to the results of this study, more older adults than adults have access to car and have a driving licence, and thus may feel they have less need for public transport. Moreover, those older adults who have disabilities or reduced mobility already have access to STS (which is similar to DRT), and overall, older people do fewer trips per day than other age groups (Trafikanalys Citation2017). Another reason for this result may be that the adult group include people between 18 and 25 years, who state they would use DRT more frequently than the rest in this age group. These are people who in many cases do not have a driving licence or a car. This is also in line with the results from Wang et al. (Citation2014), who identified a correlation between low car ownership and high DRT service demand. Finally, the result might be an indication of the increased awareness of climate changes and the need for new transport solutions, which may be stronger among the adults than the older adults.
One purpose of this study was to provide an increased understanding of different factors that influence travellers’ use of DRT (in addition to age). The results do not reveal any clear market groups, but they show that those who are already travelling with public transport and those living in cities, among adults and older adults, would use DRT more than others. However, the significance levels of many of the studied factors were too poor, which means that no safe conclusions can be drawn about them. This could be explained either by the sample size being too small, or that there are only a few common characteristics of people susceptible to DRT in this population. The latter would indicate a need for further studies of DRT susceptibility in different populations, for instance in different countries, where the contexts differ. Furthermore, to create a modal shift from the private car to more sustainable options is difficult (Batty, Palacin, and González-Gil Citation2015). The interest in using DRT, at least among older adults, seems to be more linked to whether a person is active and already travels regularly, than a lack of transport options. This seems to be valid also for other types of public transport (Ryan and Wretstrand Citation2019). Getting people to use the service probably requires persistence and specific information campaigns designed for different user groups.
Depending on how the DRT system is configured, the service will naturally be better or worse than the already existing alternatives. For those who are already using public transport the benefits of the DRT service could be, for instance, shorter distance to the pick-up point or shorter waiting time for departure. These are qualities that have shown to be important for different travel groups (Ona Citation2022; Svensson Citation2003; Tennøy, Knapskog, and Wolday Citation2022). As mentioned above, our results show that more of those who are already travelling with public transport, compared to those who are not, believe they would use the DRT service. This indicates that they interpret it as a better or equally good service as the public transport services they are already using today. Being able to compete with the car is more difficult though (Anable Citation2005; Haustein and Kroesen Citation2022), as DRT might not be able to offer a standard that is considered higher than the car. An ongoing discussion is whether DRT is suitable for more rural areas, where it is difficult to provide good public transport services. However, in this study people living in rural areas seem to be less interested in using the system than people living in cities.
According to Currie and Fournier (Citation2020), low operating costs are important success factors for DRT services. When designing a DRT service, it is therefore important to identify potential cost efficiency gains. Some of the answers from the respondents open up for such efficiency gains. For instance, about 90% of the travellers in all age groups accept receiving a departure time interval of 10 min, which gives some variability space in bus route planning. Additionally, the acceptance for booking a journey at least 30 min in advance ranges from about 85% to 96%, for the different age groups. This leaves room for route and vehicle optimization, especially when compared to a service that allows for real-time booking, i.e. when travellers can request for pick-up as soon as possible. A service that requires the travellers to book at least 1 h in advance might give even more room for efficiency gains; however, with such a service there is a risk of losing about 27% to 50% of the travellers. Another way to achieve efficiency benefits is to use variable stops or to move stops after booking, in order to enable more optimal bus routes. Over 80% of the respondents accept moving the bus stop 100 m further away after booking; however, moving the stop 400 m away is much less acceptable for the respondents. Older adults are particularly negative towards moving a stop, which might be explained by the fact that more people in this group may have difficulties reacting to rapid changes or walking long distances, especially if the walk must be done within a short timeframe (Risser, Haindl, and Ståhl Citation2010; Webber, Porter, and Menec Citation2010). Changing pick-up/drop-off stops may also cause feelings of stress and uncertainties for older people (Carlsson Citation2004). Similarly, variable stops are accepted by over 60% of the children and the adults, but only by 32% of the older adults. The reason for this might be that older travellers are more reluctant towards new digital solutions (Durand et al. Citation2022) and, again, may have difficulties walking long distances. Allowing for different types of delays can be yet another way to enable route optimization and increase efficiency for the bus operator. Our results on delays show that there is little difference between the age groups. This can be seen as a bit surprising, since stress and busy schedules vary across different periods in life, which means that delay sensitivity also might be expected to vary between the different age groups (Cohen and Janicki-Deverts Citation2012). In general, the respondents show a slightly higher acceptance for departure time delays than travel time delays. This result is in line with previous research on DRT in peri-urban areas (Thao, Imhof, and von Arx Citation2023). Our results also show that a DRT trip must not take twice as long as the corresponding trip by car, although somewhat longer travel time is accepted by most respondents. One might expect that in some situations it may be difficult to maintain short travel times, since a high level of ridesharing is an important target in this type of DRT service, which means that detours are often included (as opposed to taxi services).
Apps usually represent a more efficient media for communicating travel options and changes with the travellers compared to other media, such as using a call centre. The results show that older adults have a stronger preference for booking trips via telephone, than the other age groups. Thereby, this option should be available if a majority of this travel group is to be reached. Furthermore, older adults have a higher acceptance for a dedicated DRT app than for an integrated travel planner. This might indicate that older adults believe a dedicated DRT app would be simpler to navigate than an integrated travel planner with more features, while the other age groups rather see advantages with several features in one app. Furthermore, if apps are used that allow the traveller to share information, such as positioning data, with the operator system, more personalized services are enabled. Older adults are less willing to share this type of information compared to other age groups, which might be explained by older adults being less used to digital solutions (Shengxiao Citation2023), and thereby not trusting them or not seeing the benefits of sharing the data. On the other hand, older adults seem to be more interested in using the added-value service that might be offered.
Basarić et al. (Citation2016) show that people of different ages have different needs and preferences. This is also evident in our study, where the differences in acceptance vary between the age groups. For instance, there are relatively small differences in acceptance of delays and departure time intervals, but relatively big differences in acceptance of trip-booking media, stop solutions, move of stops, booking times, and ticket prices, as well as the need for value-added services. This means that it might be difficult to design a service that satisfies the vast majority of travellers, especially if maximum benefit of the potential efficiency gains is to be utilized. The challenge may thereby be to find a solution that optimizes the benefits for all travellers and PT actors where the benefits may differ between different stakeholders, for instance, depending on the purpose of introducing DRT, in terms of costs, accessibility, sustainability, etc. Furthermore, it may also be possible to incorporate many different design alternatives into the same service. For instance, the service could offer both ticket prices that depend on the risks (e.g. cheaper price for trips with high risk of delays), which young people prefer, and fixed ticket prices, which older adults prefer. It might even be possible to offer fixed stops along with variable stops, in a more advanced service design.
This study has some limitations. In particular, the surveys were conducted during the Covid pandemic and although restrictions during this period were less strict in Sweden compared to many other countries, it might have affected how people felt about using public transport. During the Covid period (spring 2020–autumn 2021) the Swedish authorities urged people not to travel by public transport, which caused a decrease in public transport travel. The questionnaire survey clearly stated that the respondents should base their answers on a situation without Covid and Covid restrictions. However, some people might have been less interested in the presented DRT service due to the pandemic, and especially in travelling with smaller vehicles. The percentage of respondents who wanted to avoid crowdedness was not as high as expected, though, but again restrictions in Sweden were less strict than in many other countries.
Moreover, questions were asked about a hypothetical DRT service. This raises the question of whether the results from the respondents can be trusted or not. However, we believe the DRT service should not have been too difficult for the respondent to understand and imagine. At the beginning of the questionnaire, the service was described, and the detailed configuration questions also helped guide the respondents to get a clear picture of the service. The question about whether the respondent thinks he or she will use the system comes at the end of the questionnaire when people probably have gained a relatively deep understanding of how a DRT service might look like. Additionally, it can be expected that many people in Sweden know about STS, a similar service dedicated to people who cannot use the ordinary public transport.
One uncertainty with this study design is that people might change their opinions when actually using a DRT service. This issue has been discussed regarding using the stated preference method compared to revealed preferences, but evidence is available showing that stated preferences among hypothetical travel scenarios provide a reasonable accurate guide to individuals’ actual preferences (Wardman Citation1988). Even though the stated preference method has not been used in this study, the promising results from that method regarding hypothetical questions can also strengthen the results from this study. Another uncertainty related to the answers from the respondents, is the fillings made for the questions involving two or more scenarios, in the older adults survey (see section 2.3). We believe that the approach used for this is logical and as reliable as possible. However, these fillings naturally open up for questions, and the corresponding results would therefore benefit from further studies that confirm them.
5. Conclusions
This study investigated the preferences and acceptance levels regarding different configurations of DRT, in three different age groups: children and young people (age 6–17), adults (age 18–69), and older adults (age 70 and above). The main results show that the age groups often have similar levels of acceptance; in particular, regarding acceptance for delays and departure time intervals. However, older adults differ from the other groups in some respects. For instance, they have a lower acceptance for digital solutions (e.g. booking via an app or finding the pick-up/drop-off stops in the app). Furthermore, children and older adults have a stronger requirement for most value-added services, even though older adults are relatively negative to the other digital solutions. Booking at least 30 min in advance is accepted by the vast majority of the travellers, and the majority also accepts that a DRT trip takes longer than the corresponding car trip (but not twice as long). Older adults have lower acceptance for changes in pick-up stops, especially if they have to walk 400 m to reach the new place. This means restrictions in efficiency gains. In general, however, the results indicate that many of the configuration alternatives presented in the questionnaires that allow room for different types of efficiency gains, are accepted by the majority of travellers (departure time interval of 10 min, booking a journey at least 30 min in advance, etc.).
The study also shows that about half of the respondents claim they would use the DRT service every month or more often, whereas about 10–15% of the respondents claim they would never use the service. Based on the investigated variables, it is difficult to identify specific target groups for DRT services; however, some characteristics of those that claim they would use the service can be identified. For instance, those who already use public transport, those who are younger within the adult group, and those who live in cities are more willing to use DRT. The results from this study do not indicate that car drivers are particularly inclined to switch transport mode, from car to DRT. However, if a DRT service begins to attract people, for instance those with few transport options, the service may persist over time and, at a later stage, also attract new groups of travellers, such as car drivers.
In general, the study shows that people have an interest in this type of public transport. However, one recommendation is to open up for several configuration alternatives, regarding booking, travel time, and price, to attract people at different ages and with different preferences. For public transport authorities it is important to know the potential market and people’s preferences before implementing a DRT system. Even though this study gives some answers, it is advisable for actors to explore their specific market. This could be done via, for instance, interviews or questionnaires. Moreover, it is advisable to have some patience when implementing a new DRT service, since changing behaviour often takes time (Mulley et al. Citation2012). It also takes time for the public transport actors to build up an understanding of the behaviours and needs of the traveller target groups.
Suggestions for future research include a follow-up study with revealed preferences to learn how people actually are using this type of service. A few DRT services have started in Sweden during the last year and revealed preferences regarding, for example, how far ahead people are booking their trips can now be studied, as well as whether extra services are used and whether people cancel booked trips when conditions are changed, for instance in travel time. Further research should also explore if DRT can be part of future solutions that succeeds in changing travel behaviour, so that more people travel by public transport and fewer by private car.
Acknowledgements
Docent Jan A. Person at Malmö University has assisted in the development of some of the DRT-related questionnaire questions. Furthermore, Dr Chunli Zhao at Lund University has practically performed the web panel data collection related to children, and Jessica Göransson at VTI has done the corresponding for the adults.
Disclosure statement
No potential conflict of interest was reported by the author(s).
Additional information
Funding
References
- Alonso-González, M. J., T. Liu, O. Cats, N. Van Oort, and S. Hoogendoorn. 2018. “The Potential of Demand-Responsive Transport as a Complement to Public Transport: An Assessment Framework and an Empirical Evaluation.” Transportation Research Record 2672 (8): 879–889. https://doi.org/10.1177/0361198118790842
- Anable, J. 2005. “Complacent Car Addicts’ or ‘Aspiring Environmentalists’? Identifying Travel Behaviour Segments Using Attitude Theory.” Transport Policy 12 (1): 65–78. https://doi.org/10.1016/j.tranpol.2004.11.004
- Basarić, V., A. Vujičić, J. M. Simić, V. Bogdanović, and N. Saulić. 2016. “Gender and Age Differences in the Travel Behavior – a Novi Sad Case Study.” Transportation Research Procedia 14:4324–4333. https://doi.org/10.1016/j.trpro.2016.05.354
- Batty, P., R. Palacin, and A. González-Gil. 2015. “Challenges and Opportunities in Developing Urban Modal Shift.” Travel Behaviour and Society 2 (2): 109–123. https://doi.org/10.1016/j.tbs.2014.12.001
- Brake, J., C. Mulley, J. D. Nelson, and S. Wright. 2007. “Key Lessons Learned from Recent Experience with Flexible Transport Services.” Transport Policy 14 (6): 458–466. https://doi.org/10.1016/j.tranpol.2007.09.001
- Carlsson, G. 2004. “Travelling by Urban Public Transport: Exploration of Usability Problems in a Travel Chain Perspective.” Scandinavian Journal of Occupational Therapy 11 (2): 78–89. https://doi.org/10.1080/11038120410020548
- Cohen, S., and D. Janicki-Deverts. 2012. “Who’s Stressed? Distributions of Psychological Stress in the United States in Probability Samples from 1983, 2006, and 2009.” Journal of Applied Social Psychology 42 (6): 1320–1334. https://doi.org/10.1111/j.1559-1816.2012.00900.x
- Coutinho, F. M., N. van Oort, Z. Christoforou, M. J. Alonso-González, O. Cats, and S. Hoogendoorn. 2020. “Impacts of Replacing a Fixed Public Transport Line by a Demand Responsive Transport System: Case Study of a Rural Area in Amsterdam.” Research in Transportation Economics 83:100910. https://doi.org/10.1016/j.retrec.2020.100910
- Currie, G., and N. Fournier. 2020. “Why Most DRT/Micro-Transits Fail – What the Survivors Tell Us About Progress.” Research in Transportation Economics 83:100895. https://doi.org/10.1016/j.retrec.2020.100895
- Currie, G., and T. Wong. 2020. “Workshop 4 Report: Realising the Potential Benefits of Demand-Responsive Travel.” Research in Transportation Economics 83:100912. https://doi.org/10.1016/j.retrec.2020.100912
- Davison, L., M. Enoch, T. Ryley, M. Quddus, and C. Wang. 2012. “Identifying Potential Market Niches for Demand Responsive Transport.” Research in Transportation Business & Management 3:50–61. https://doi.org/10.1016/j.rtbm.2012.04.007
- Davison, L., M. Enoch, T. Ryley, M. Quddus, and C. Wang. 2014. “A Survey of Demand Responsive Transport in Great Britain.” Transport Policy 31:47–54. https://doi.org/10.1016/j.tranpol.2013.11.004
- Durand, A., T. Zijlstra, N. van Oort, S. Hoogendoorn-Lanser, and S. Hoogendoorn. 2022. “Access Denied? Digital Inequality in Transport Services.” Transport Reviews 42 (1): 32–57. https://doi.org/10.1080/01441647.2021.1923584
- Dytckov, S., F. Lorig, P. Davidsson, J. Holmgren, and J. A. Persson. 2020. “Modelling Commuting Activities for the Simulation of Demand Responsive Transport in Rural Areas.” International Conference on Vehicle Technology and Intelligent Transport Systems, 1: 89-97. SciTePress.
- Dytckov, S., J. A. Persson, F. Lorig, and P. Davidsson. 2022. “Potential Benefits of Demand Responsive Transport in Rural Areas: A Simulation Study in Lolland, Denmark.” Sustainability 14 (6): 3252. https://doi.org/10.3390/su14063252
- Gilibert, M., I. Ribas, N. Maslekar, C. Rosen, and A. Siebeneich. 2019. “Mapping of Service Deployment Use Cases and User Requirements for an on-Demand Shared Ride-Hailing Service: MOIA Test Service Case Study.” Case Studies on Transport Policy 7 (3): 598–606. https://doi.org/10.1016/j.cstp.2019.07.004
- Grosso, S., J. Higgins, J. Mageean, and J. D. Nelson. 2002. “Demand Responsive Transport: Towards Best Practice in Rural Applications.” Proceedings of the AET European Transport Conference, UK-CD ROM.
- Haustein, S., and M. Kroesen. 2022. “Shifting to More Sustainable Mobility Styles: A Latent Transition Approach.” Journal of Transport Geography 103:103394. https://doi.org/10.1016/j.jtrangeo.2022.103394
- Hu, X., J. Wang, and L. Wang. 2013. “Understanding the Travel Behavior of Elderly People in the Developing Country: A Case Study of Changchun, China.” Procedia-Social and Behavioral Sciences 96:873–880. https://doi.org/10.1016/j.sbspro.2013.08.099
- Jain, S., N. Ronald, R. Thompson, and S. Winter. 2017. “Predicting Susceptibility to Use Demand Responsive Transport Using Demographic and Trip Characteristics of the Population.” Travel Behaviour and Society 6:44–56. https://doi.org/10.1016/j.tbs.2016.06.001
- Jordbruksverket. 2013. “Så gjorde vi Allt om landet”. https://www2.jordbruksverket.se/webdav/files/SJV/trycksaker/Pdf_ovrigt/aol18.pdf [2023-12-18].
- MOIA. 2023. https://www.moia.io/en [2023-04-12].
- Mulley, C., J. Nelson, R. Teal, S. Wright, and R. Daniels. 2012. “Barriers to Implementing Flexible Transport Services: An International Comparison of the Experiences in Australia, Europe and USA.” Research in Transportation Business & Management 3:3–11. https://doi.org/10.1016/j.rtbm.2012.04.001
- NASEM, National Academies of Sciences, Engineering, and Medicine. 2020. Development of Transactional Data Specifications for Demand-Responsive Transportation. Washington, DC: The National Academies Press. https://doi.org/10.17226/25800.
- Ona, J. 2022. “Service Quality, Satisfaction and Behavioral Intentions Towards Public Transport from the Point of View of Private Vehicle Users.” Transportation 49 (1): 237–269. https://doi.org/10.1007/s11116-021-10175-7
- Papanikolaou, A., S. Basbas, G. Mintsis, and C. Taxiltaris. 2017. “A Methodological Framework for Assessing the Success of Demand Responsive Transport (DRT) Services.” Transportation Research Procedia 24:393–400. https://doi.org/10.1016/j.trpro.2017.05.095
- Perera, S., C. Ho, and D. Hensher. 2020. “Resurgence of Demand Responsive Transit Services–Insights from BRIDJ Trials in Inner West of Sydney, Australia.” Research in Transportation Economics 3 (8): 100904. https://doi.org/10.1016/j.retrec.2020.100904
- Pettersson, F. 2019. “An International Review of Experiences from On-demand Public Transport Services”. K2 Working paper 2019:5. http://www.k2centrum.se/sites/default/files/fields/field_uppladdad_rapport/on-demand_pt.pdf [2023-05-30].
- Pettersson, F., and J. Khan. 2020. “Smart Public Transport in Rural Areas: Prospects, Challenges and Policy Needs.” In Shaping Smart Mobility Futures: Governance and Policy Instruments in Times of Sustainability Transitions, edited by Alexander Paulsson and Claus Hedegaard Sørensen, 187–201. Emerald.
- Risser, R., G. Haindl, and A. Ståhl. 2010. “Barriers to Senior Citizens’ Outdoor Mobility in Europe.” European Journal of Ageing 7 (2): 69–80. https://doi.org/10.1007/s10433-010-0146-4
- Ronald, N., R. Thompson, and S. Winter. 2017. “Simulating Ad-hoc Demand-Responsive Transportation: A Comparison of Three Approaches.” Transportation Planning and Technology 40 (3): 340–358. https://doi.org/10.1080/03081060.2017.1283159
- Ryan, J., and A. Wretstrand. 2019. “What’s Mode Got To Do With It? Exploring the Links Between Public Transport and Car Access and Opportunities for Everyday Activities among Older People.” Travel Behaviour and Society 14:107–118. https://doi.org/10.1016/j.tbs.2018.10.003
- Ryley, T. J., P. A. Stanley, M. P. Enoch, A. M. Zanni, and M. A. Quddus. 2014. “Investigating the Contribution of Demand Responsive Transport to a Sustainable Local Public Transport System.” Research in Transportation Economics 48:364–372. https://doi.org/10.1016/j.retrec.2014.09.064
- Saxena, N., T. Rashidi, and D. Rey. 2020. “Determining the Market Uptake of Demand Responsive Transport Enabled Public Transport Service.” Sustainability 12 (12): 4914. https://doi.org/10.3390/su12124914
- SCB (Statistics Sweden). 2023a. “Population Statistics” [Befolkningsstatistik]. https://www.scb.se/hitta-statistik/statistik-efter-amne/befolkning/befolkningens-sammansattning/befolkningsstatistik/#_Nyckeltal (2023-12-20).
- SCB (Statistics Sweden). 2023b. “Population Density per sq. km, Population and Land Area by Region and Sex.” Year 1991–2022. https://www.statistikdatabasen.scb.se/pxweb/en/ssd/START__BE__BE0101__BE0101C/BefArealTathetKon/ (2023-12-20).
- Shengxiao, L. 2023. “Revisiting the Relationship Between Information and Communication Technologies and Travel Behavior: An Investigation of Older Americans.” Transportation Research Part A: Policy and Practice 172:103689. https://doi.org/10.1016/j.tra.2023.103689
- SPAR. 2023. “Statens personadressregister SPAR.” https://www.statenspersonadressregister.se/master/start/ [2023-04-12].
- Stark, J., M. Meschik, A. Singleton, and B. Schützhofer. 2018. “Active School Travel, Attitudes and Psychological Well-being of Children.” Transportation Research Part F: Traffic Psychology and Behaviour 56 (–): 453–465. https://doi.org/10.1016/j.trf.2018.05.007
- Svensson, H. 2003. “The Public Transport Preferences of Older People – A Study Related to Individual Capacity and Environmental Stress in Service Route Traffic and Other Systems.” Doctoral Thesis, Department of Technology and Society, Lund University.
- Tennøy, A., M. Knapskog, and F. Wolday. 2022. “Walking Distances to Public Transport in Smaller and Larger Norwegian Cities.” Transportation Research Part D 103:103169. https://doi.org/10.1016/j.trd.2022.103169
- Thao, V. T., S. Imhof, and W. von Arx. 2023. “Demand Responsive Transport: New Insights from Peri-Urban Experiences.” Travel Behaviour and Society 31:141–150. https://doi.org/10.1016/j.tbs.2022.11.012
- Trafikanalys. 2017. “The Swedish National Travel Survey 2015–2016.” Trafikanalys Statistik 2017:13.
- Wang, J., K. Liu, T. Yamamoto, D. Wang, and G. Lu. 2023. “Built Environment as a Precondition for Demand-Responsive Transit (DRT) System Survival: Evidence from an Empirical Study.” Travel Behaviour and Society 30:271–280. https://doi.org/10.1016/j.tbs.2022.10.008
- Wang, C., M. Quddus, M. Enoch, T. Ryley, and L. Davison. 2014. “Multilevel Modelling of Demand Responsive Transport (DRT) Trips in Greater Manchester Based on Area-wide Socio-economic Data.” Transportation 41 (3): 589–610. https://doi.org/10.1007/s11116-013-9506-1
- Wang, C., M. Quddus, M. Enoch, T. Ryley, and L. Davison. 2015. “Exploring the Propensity to Travel by Demand Responsive Transport in the Rural Area of Lincolnshire in England.” Case Studies on Transport Policy 3 (2): 129–136. https://doi.org/10.1016/j.cstp.2014.12.006
- Wardman, M. 1988. “A Comparison of Revealed Preference and Stated Preference Models of Travel Behaviour.” Journal of Transport Economics and Policy 22 (1): 71–91.
- Webber, S. C., M. M. Porter, and V. H. Menec. 2010. “Mobility in Older Adults: A Comprehensive Framework.” The Gerontologist 50 (4): 443–450. https://doi.org/10.1093/geront/gnq013
- Weckström, C., M. N. Mladenović, W. Ullah, J. D. Nelson, M. Givoni, and S. Bussman. 2018. “User Perspectives on Emerging Mobility Services: Ex Post Analysis of Kutsuplus Pilot.” Research in Transportation Business & Management 27:84–97. https://doi.org/10.1016/j.rtbm.2018.06.003
- Xu, J., and Z. Huang. 2009. “An Intelligent Model for Urban Demand-Responsive Transport System Control.” Journal of Software 4 (7): 766–776.
Appendices
Appendix 1
DRT service description provided to the respondents:
There is a new type of service that is being introduced in public transport and which can be seen as a service somewhere between bus and taxi. The service is intended to be available to all people and the price is about the same as for a trip with the general public transport. To be able to travel with the new service, you must book your trip in advance. You can travel from any place and to any place within the municipality. You choose at what time you want to travel, but the time offered for departure may deviate somewhat from your desired time. You travel with a small bus and together with other travellers. The bus does not follow a fixed timetable or predetermined route, instead the route and time depend on which orders have been made, i.e. how different people want to travel.
This type of transport service is called demand-responsive traffic. The questions below concern what you think about such a transport service and how you think you would have acted if you had access to this service.
Appendix 2
Table A1. Frequency results from the DRT-related questions with yes/no answers, together with the differences between the age groups and the significance levels of these differences (pp stands for percentage points, and *, **, *** for significance levels 0.05, 0.01, and 0.001). The figures represent the share and differences of yes answers.
Table A2. Frequency results from the DRT-related question concerning booking time, together with the differences between the age groups and the significance levels of these differences (pp stands for percentage points, and *, **, *** for significance levels 0.05, 0.01, and 0.001). The figures represent the share and differences of yes answers.
Table A3. Frequency results from the DRT-related question concerning maximum travel time, together with the differences between the age groups and the significance levels of these differences (pp stands for percentage points, and *, **, *** for significance levels 0.05, 0.01, and 0.001). The figures represent the share and differences of yes answers.
Table A4. Frequency results from the DRT-related question concerning ticket price, together with the differences between the age groups and the significance levels of these differences (pp stands for percentage points, and *, **, *** for significance levels 0.05, 0.01, and 0.001). The figures represent the share and differences of yes answers.
Table A5. Frequency results from the DRT-related question concerning how often the respondent would use DRT, together with the differences between the age groups and the significance levels of these differences (pp stands for percentage points, and *, **, *** for significance levels 0.05, 0.01, and 0.001). The figures represent the share and differences of yes answers.