
ABSTRACT
This paper aims to analyze the charter contract management of major container shipping companies in response to fluctuations in shipping market conditions in terms of contract duration using data of containerships between 2010 and 2016. Duration analysis was conducted to examine the relationship between charter duration and shipping market conditions. Moreover, this paper explores the causes of Hanjin Shipping Company’s bankruptcy, drawing managerial implications. Test results from Cox PH (Proportional Hazard) model show that most container shipping companies in Europe having net earnings purchased large vessels instead of chartering vessels, while some ocean carriers featuring poor financial performance, in particular the Hanjin Shipping Company, chartered bigger ships with higher charter rates and longer duration. Contract charter rates and duration of Hanjin Shipping Company featured greater risk compared to competitors.
1. Introduction
Weaker demand and growing supply in the container shipping market have triggered a sharp drop in freight and charter rates owing to the global financial crisis of 2008. In addition, the Eurozone crisis and China’s recent economic slowdown have negatively impacted most container ocean carriers. Overcapacity of containerships along with flat or decreasing demand for cargoes has contributed to the downturn in container shipping. Under these unfavorable shipping market conditions, shipping companies have developed charter/ownership strategies considering their fleet management and financial risk. Optimization of chartering vessels and acquiring shipping space enable shipping companies not only to limit risk through adapting different contract duration of chartered vessels (Kavussanos and Alizadeh-M Citation2002) but also to avoid risk caused by fluctuation of freight rates (Zhang and Zeng Citation2015).
Due to the criticality of chartering strategies and decisions, research on the charter contract management has been conducted in maritime fields. However, the literature that addresses chartering decision problems focusing on charter duration in maritime transportation is limited. In particular, to the authors’ best knowledge, there is no previous research on charter duration of containerships for improving decision-making considering shipping market dynamics.
In particular, causes for the bankruptcy of the Hanjin Shipping Company (Hanjin) are examined in this study. First, Hanjin failed to set up effective chartering policy that reflected trends in the shipping market. Typically, shipping companies operate owned vessels to reduce financial risks in adverse shipping market conditions. While European shipping liners could operate their own big containerships, Hanjin did not own containerships with capacity exceeding 13,300 TEU during market downturns. Therefore, Hanjin needed to charter big container vessels to maintain their shipping alliance position and to service shipping networks. Consequently, the company chartered some vessels long term with high charter rates with the expectation that the shipping market would recover quickly. This is supported by fixture data during October 2010 to August 2016. The chartered period versus contract charter rate by vessel size group is presented in . Korean shipping companies (light blue-color in ) shows a higher slope than those of other shipping companies. Hanjin and Hyundai had charters contract with longer term compared with other carriers, especially in Group 2 in . This charter contract management featuring long duration and a high charter rate was regarded as one of the main causes for Hanjin’s collapse.
Figure 1. Contract charter rate versus chartered period.
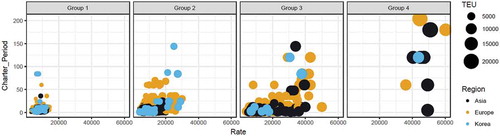
According to the raw fixture data, Hanjin chartered seven container vessels (10,000 TEU) at 43,750 ($/day) for 10 years. Unfortunately, contrary to Hanjin’s expectation, the prolonged slump of the shipping market persisted beyond their expectations. As a result, the firm suffered from their high charter rate with long duration in the depressed container shipping market in which the oversupply of global container fleet exceeded 20 million TEUs as of July 2016.
Although Hanjin chartered bigger containerships, the company might have minimized its operating losses if contracts had been short term. MSC, Evergreen, and MOL exhibited similar decision failures in chartering. Hanjin, however, failed to operate their vessels continuously due to the shortage of working capital, unlike these three companies.
The Korean financial crisis beginning in November 1997 affected all industries, and the International Monetary Fund (IMF) bailout programmers initiated Korean economic reforms. The Korean government introduced a policy requiring the debt-to-equity ratio of Chaebols (i.e. family-controlled conglomerates) to not exceed 200% through selling off real estate and subsidiaries in 1999. The Hanjin Shipping Company was forced to sell 29 containerships with charter-back conditions to improve their debt-to-equity ratio (Lee Citation1999; Lee, Lin, and Shin Citation2012). A principle of ship sale and purchase involves acquiring vessels when they are lower price and sold at higher price when the shipping market recovers (Lun, Lai, and Cheng Citation2010). Hanjin could not adhere to this principle for capital gains from ship sale because they were required to reduce their debt-to-equity ratio in 1999 regardless of shipping market conditions.
Moreover, it is widely confirmed that the recent bankruptcy of Hanjin was mainly caused by its insufficient working capital (Shen Citation2016). Evergreen and Yang Ming shipping companies in Taiwan survived due to their strong financial conditions, despite making similar mistakes in charter contract management. Unfortunately, Hanjin’s financial condition was not sufficient to avoid bankruptcy without financial support from the Korean government.
To contribute to the existing literature, this paper analyzes data based on panel data of 10 major container shipping lines by size and regional shipping companies. Also, this paper conducted duration analysis, which is appropriate for examining the importance of duration, reflecting how chartering duration changes according to shipping market conditions. Subsequently, charter contract management implications will be examined using a real example, the collapse of the Hanjin Shipping Company.
Thus, this paper has been motivated to investigate charter contract management of container shipping companies through an empirical approach focusing on charter duration. The aim of this paper is twofold: (i) to compare charter contract management for selected major shipping lines with historical fixture data and (ii) to examine the causes of the Hanjin collapse and drawing managerial implications.
2. Literature review
Chartering strategies have been examined in the maritime domain because a successful chartering decision is essential for shipowners and/or operators not only to reduce risk by diversifying charter contract duration but also to increase fleet optimization and operational activities. For these reasons, studies regarding charter decisions and strategies of chartering have provided stakeholders in the shipping industry with useful policy guidance and decision reference.
The early literature predominantly focused on the evaluation of profitability of chartering strategies. Taylor (Citation1981) evaluated the relative effectiveness of charter policies under various freight market conditions by simulating decision-making and comparing the effects of three different charter policies over a period of 25 years. Also, Taylor determined the optimal ‘fleet mix’ based on the simulation involving data of dry and liquid cargo ships and its combined carriers. Berg-Andreassen (Citation1998) also assessed the profitability of chartering strategies from the shipowner’s perspective using a theoretical model and numerical examples regarding the bulk shipping industry. This study provided implications for strategic charter decision-making in each scenario. Adland and Strandenes (Citation2006) investigated the profitability of chartering strategies for a ship operator in the tanker market. These studies provide possible methods to assess risk and the appropriate adjustment period of the charter rate.
Over the last decade following the global financial crisis, a second wave of charter contract management research has mainly concerned uncertainty under tight market conditions and application of optimal strategies. These chartering strategy studies have provided a framework for chartering decisions, especially in tough times for ship chartering markets that have changed along with the fluctuation in shipping markets.
Adland and Jia (Citation2008) assessed the risk premium affecting default risk in the charter market by means of a stochastic model and simulation under different market conditions and contract durations in bulk shipping. Wang et al. (Citation2013) focused on the tanker chartering decision problem to find the appropriate time and charter rate with a stochastic dynamic programming model under freight rate uncertainty. This study applied their model to the real world by examining a company’s chartering strategy. Adland, Cariou, and Wolff (Citation2016) assessed the contribution of owners and charterers, as well as their interaction, in bulk shipping freight rate formation with an econometric methodology (two-way fixed effect regression) reflecting the volatility of the freight market based on individual freight contract data. Wang, Fagerholt, and Wallace (Citation2017) investigated optimal chartering strategies with a stochastic programming model by considering uncertainties affecting the spot market in determining tactical fleet composition, with integrated fleet deployment and speed optimization. Adland, Bjerknes, and Herje (Citation2017) tested for spatial efficiency in the freight market by comparison of normal and tight market conditions. Furthermore, they evaluated the performance of trading rules with geographical optimization of chartering decisions and the entry/exit decisions of vessel deployment under uncertainty.
Of the previous studies related to chartering, however, most studies have focused on bulk shipping (Berg-Andreassen Citation1998; Adland and Strandenes Citation2006; Adland and Jia Citation2008; Adland, Bjerknes, and Herje Citation2017; Adland, Cariou, and Wolff Citation2016) and tanker shipping (Wang et al. Citation2013; Wang, Fagerholt, and Wallace Citation2017), both dry-cargo and tanker shipping (Taylor Citation1981), and general cargo and drybulk shipping (Ozer and Cetin Citation2012). Regarding containership, Cariou and Wolff (Citation2013) discussed charter contract and analyzed chartering rate data regarding container liner shipping companies. Cariou and Wolff (Citation2013) examined the impact of chartering on the profitability of container shipping companies using econometric analysis. However, there is still considerable ambiguity regarding studies on charter contract management of container shipping, even though most container shipping companies charter container vessels.
Moreover, one of the neglected areas in the study of vessel chartering concerns ‘duration of charter’, although some studies have used the duration term in their studies. However, these studies tended to focus on: (i) the relationship between long—and short-term charter contracts (Taylor Citation1981; Kavussanos and Alizadeh-M Citation2002; Rygaard Citation2009; Zhang and Zeng Citation2015); (ii) the relationship between freight rates and laycan period (lead time between the contracting date and delivery time of chartered ships) (Alizadeh and Talley Citation2011a, Citation2011b) rather than focusing on the charter contract period. In this sense, Cariou and Wolff (Citation2013) mentioned additional study on charter contract period is required for further investigation. As Adland and Cullinane (Citation2005) and Adland and Jia (Citation2008) identified that the duration of the time charter that affects risk premium in the freight market, this study will concentrate on the relationship between charter duration and shipping market conditions.
Finally, few studies have addressed the lessons from the collapse of the Hanjin Shipping Company. Although it is important to heed the lessons of failure, existing academic evidence offers little insight about the case of Hanjin. Thus, this paper examines the experience of Hanjin Shipping Company by comparing other container shipping lines’ chartering strategy. These results have implications for finding the causes of the Hanjin collapse from a charter contract management perspective.
In conclusion, although the time charter and freight rates have been studied extensively, the duration of time charter contracts in container shipping requires further study. This paper investigates the relationship between duration of charter and shipping market conditions based on previous studies. Moreover, on the basis of charter contract management of shipping companies, results from the analysis of the fundamental causes of the collapse of Hanjin are provided.
3. Methodology
This paper employs a duration model, the Cox PH (Proportional Hazard) model, to analyze shipping market conditions on the charter period. Cox PH regression has been widely employed in engineering, social sciences, behavioral sciences, and economics fields, as well as by medical professionals (Allison Citation2010). This regression is a distribution-free model which does not require a specific distribution (Guo Citation2010). The Cox PH model provides reliable results without concern as to whether an unsuited parametric model may be chosen (Kleinbaum and Klein Citation2012). Furthermore, the model uses partial likelihood to estimate covariate parameters which does not allow for a specified baseline hazard function (Guo Citation2010; Allison Citation2010). Despite the many statistical advantages and ‘time-to-event’ analysis, to date this methodology has only been applied to studies on impacts of ship inspections on a ship’s lifespan (Bijwaard and Knapp Citation2009) and vessels’ recurrent accidents analysis (Luo, Shin, and Chang Citation2017) in maritime studies. shows that the distribution of the charter period does not follow a normal distribution. Thus, the characteristic of the Cox PH model, i.e. distribution-free, is suitable for charter period analysis.
Figure 2. Distribution of charter period.
The basic formulation of the Cox PH regression is expressed as the product of two quantities as follows:
:
vector of unknown regression parameters
The hazard function for the event time (random variables) associated with a
vector of time-varying variables
.
stands for hazard, which is the conditional probability that an individual containership
will complete their charter contract (events in duration analysis) at time
.
is called the baseline hazard function, which is the function in which all independent variables of an individual
have a value of zero.
Thus, we can reflect the above into a duration model as follows:
The dependent variable is chartering duration of containership between a lessor (ship owners) and a lessee (container shipping companies). In this expression, SM is the proxies for shipping market condition, stands for an individual charter contract of
index (or price, percentage) at fixture time
. VZ and VG are the set of controlling variables indicating the vessel size and the vessel age. This paper assumes that a charterer and a shipowner decide the charter rate, not referring to the same month in which they contract, but considering shipping market conditions in the previous month (
. The previous ‘one month’ is assumed for providing chartering decision makers with consideration of market conditions prior to signing contracts. Since no data on time between signing date of a contract and starting date of it is available from Clarkson, this study assumes a duration about previous one month.
Assuming that there are charter contracts, the partial likelihood (PL) of all contracts at the contract time can be written as:
Where if
and
if
.
are used to exclude data that already experienced the event from the denominator (Guo Citation2010; Allison Citation2010). Then, like an ordinary likelihood function, Equation (3) can be maximized with respect to
by maximizing the logarithm of the likelihood as follows:
4. Dataset and variable construction
4.1. Dataset
In our empirical analysis, top 10 container shipping companies were selected and ranked by the number of chartered ships they possessed to look into their charter contract management. Panel data comprises four major shipping lines in Europe and Asia, and two major ocean carriers in Korea as shown in . The10 shipping companies’ earnings before interest and taxes (EBIT), which indicates ocean carriers’ performance, for the last four years is presented in . Most European shipping lines maintained a positive EBIT, even though they experienced adverse market conditions. In contrast, most Asian shipping lines and Korean ocean carriers recorded negative earnings in the same period.
Table 1. Sample shipping lines and fleet information (as of 9 September 2016).
Charter contract data for the 10 shipping companies above was provided by Clarkson’s Shipping Intelligence Network, comprising fixture information (contract records) signed by the charterers and the ship owners. This dataset covers 5,583 contract fixtures of 10 container shipping companies over the period from October 2010 to August 2016. This data includes charter contract information by charterer including the date of the contract, vessel name, year of vessel construction, vessel size (in TEU), charter period, contract chartered rate ($/day), and ship owner (lessor) and charterer (lesser) at the time of contract. Unlike previous studies that used fixture data (Alizadeh and Talley Citation2011a; Adland, Cariou, and Wolff Citation2016, Citation2017), this paper concentrates on charter duration at the fixture date (or hire date) after completion of negotiations and contracts between the vessel owner and the vessel charterer. Fixture information refers to contractual agreement, and data used in this study indicates commencement of contracts. In the duration model, this paper excludes data if either of two information requirements (chartered rate or charter duration) are missed in the dataset, since this information should be applied together in the model. The process of model development included filtering missed and unusable observations. Consequently, a total of 4,801 fixture observations are used in this paper. presents the number of observations by each shipping company. Especially in the charter period, some contract records from Clarkson’s database did not provide exact chartering periods, but those records generally contain the rough chartering data ranges such as ‘1–3 months’, ‘40–70 days’, and ‘6–8 Months.’ This paper calculated mean values (i.e. 2 months in the case of 1–3 months) to simplify the empirical analysis. Missing chartering rates and the period of Hanjin shipping are supplemented by internal data acquired from Hanjin shipping.
Table 2. Number of fixture observation by region and by the shipping company (from October 2010 to August 2016).
The world’s container fleet is broadly categorized into eight size classes by TEU, according to the classification by Drewry Shipping Consultants Ltd., as shown in . Based on filtered data, this paper reduces these categories by four groups to meet the required sample size for the statistical test. Group 2 containing intermediate and Panamax size classes includes 2,313 chartered containerships in the period of observation. Of the three regions, Europe has 3,790 charter contracts. The top four shipping lines in Europe, which were ranked by the number of hiring vessels, have about four times more vessels than the top four shipping lines in Asia, excluding the two Korean shipping companies. However, the number of charter vessels by the four European liners in Group 4 (Very Large and ULCV) chartered just seven vessels.
Table 3. Sample data number of charter contract by vessel size and regional shipping lines.
4.2. Variable construction and selection of shipping market
This paper considers eight exogenous variables as indicators affecting the shipping market directly or indirectly as shown in . To avoid multicollinearity, we looked for input variables that are correlated with other variables, and excluded any variable in which the multicollinearity was high. shows linear relationships between pairs of shipping market variables presented in using Spearman statistics from October 2011 to August 2016.
Table 4. Description and selection for input variable as indicators of shipping market condition.
Figure 3. Linear relationships between pairs of shipping market variables.
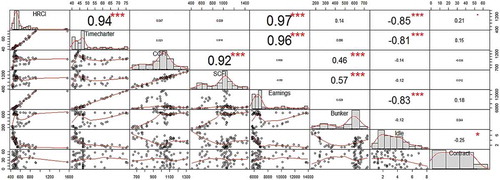
As seen in , Howe Robinson Container Index (HRCI) shows very high positive correlation with time charter rate index and earnings, and a high negative correlation with idle. This is natural in shipping markets because HRCI is an index indicating container shipping market condition. It is increasing when the market peaks along with time charter rate index, and earnings. However, the percentage of idle will decrease during peak times.
To avoid multicollinearity among variables, this paper selected time charter rate index as a variable that represents direct shipping market conditions instead of HRCI and earnings, because the charter rate index serves as a major indicator of the supply and demand of vessels for shipping companies (Lun, Pang, and Panayides Citation2010). Since charter duration is closely related with freight rates (Adland and Jia Citation2008), this study input time charter rate index as one of the explanatory variables.
Freight ratesFootnote1 such as China Containerized Freight Index (CCFI) and Shanghai Containerized Freight Index (SCFI) are also selected as a variable in our model because they have a relationship in the spot market with charter rate contracts. Some studies (Zhang and Zeng Citation2015; Kavussanos and Alizadeh-M Citation2001; Glen, Owen, and van der Meer Citation1981; Kavussanos Citation1996) have investigated the correlation between the spot and time charter rate (and time charter period). Zhang and Zeng (Citation2015) examined factors of time charter rates on freight rates in the dry bulk shipping market. Kavussanos and Alizadeh-M (Citation2001) examined the seasonal pattern of freight and charter rates. Thus, this paper considers spot rate as a predictor along with time charter rate index, and selects one index, CCFI, as a proxy of freight rate conditions in the container market due to the strong correlation between CCFI and SCFI as shown in .
The paper also assesses the contract charter duration affected by bunker price which incurs considerable operating expenses for carriers of containers. The framework between bunker costs and charter rate, according to Notteboom and Vernimmen (Citation2009), is that shipping lines would negotiate with ship owners seeking low charter rates when the fuel price is high because increasing the bunker fuel price leads to high expenses for container shipping companies. Therefore, bunker price included in our model is based on Singapore fuel oil 360 cst bunker prices.
The percentage of idle containership can be also the indicator showing the situation of the shipping market. The number of idled container ships reflects the inactive demand for shipping. The low percentage of idle fleet pertained to rising charter rates with active shipping market (Barnard Citation2015), but shipping companies may temporarily withdraw supply (existing vessel capacity) in the economic crisis (Hoffmann Citation2010).
The contract volume of new orders for containerships can also be a predictor of the charter duration, indicating the level of newbuild demand. The contract volume also reflects tension in the shipping market because carriers adjust their existing fleet in response to a decline in demand by halting new vessel orders in downward shipping conditions (Hoffmann Citation2010). Also, the contract volume reflects tension in the shipping market because carrier adjusts their existing fleet by operating vessels to reduce risk in downward shipping conditions (Kavussanos and Alizadeh-M Citation2002).
This paper set ship age as a control variable. Vessel age may affect the charter duration of ships due to the decline of operational functioning, efficiency of technology, and quality of vessel as ship age increases (get older) (Alizadeh and Talley Citation2011a). This paper considers that charter contract management is affected by vessel size since larger vessels are chartered at a higher price. For these reasons, this paper sets vessel characteristics (vessel age and TEU) as control variables, investigating their impacts on chartering activity.
5. Empirical results from data analysis and duration model
This section provides the descriptive data and results from the duration model. First, we report the results from data analysis with fixture data of containership in the period from 2010 to 2016. Second, we investigate the influence of shipping markets on the charter duration of major shipping companies using the same data. Third, we draw discussion and managerial implications from the results.
5.1. Data analysis
It is interesting to note that the contract charter rates of European shipping companies (except for MSC) did not exceed 40,000 ($/day), while most Asian and Korean shipping operators had contracts greater than 40,000 ($/day) during October 2010 to August 2016. The long-term contract charter period (over 3 years) was made in most cases involving larger vessels. In , the X-axis indicates the year, while the Y-axis represents contract charter rate by the shipping company. The density of the red color stands for the duration of the charter between each shipping company and ship owner along with the vessel size, which is expressed by circle size. Duplicate contracts, which result from hiring the same vessels on the same date with the same contract charter rate, were plotted with an identical circle. graphically presents the charter period during the period from 2010 to 2016. This figure provides the intuitive chartering strategy of each shipping line, although the figure does not present all contract data since the plotting spots are printed with filtered data. For example, Hyundai chartered an 8,428 TEU containership at 43,500 ($/day) in 2010, but its charter period is missing in the dataset. Thus, missing information could not be printed in the figure.
Figure 4. Contract charter rate and charter period by shipping lines.
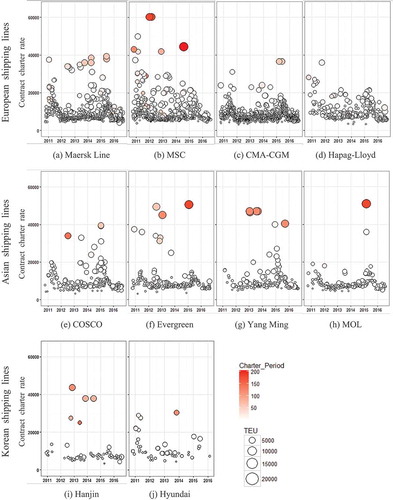
The top four European shipping operators (except for MSC) feature chartering strategies involving not chartering containerships exceeding 10,000 TEU, as well as ensuring contract charter rates do not surpass 40,000 ($/day), except for MSC. MSC is the second largest operator in the world in terms of total container capacity and the first in terms of chartering volume as of September 2016 (as shown in ). However, the number of container vessels exceeding 18,000 TEU of MSC is less than APM-Maersk (as shown in ). MSC chartered larger vessels instead of ordering new vessels to compete with APM-Maersk, while the other three European shipping companies (APM-Maersk, CMA-CGM, and Hapag-Lloyd) did not charter ships over 10,000 TEU.
Table 5. Number of container vessel by vessel size and shipping lines.
, presents the number of container vessels by vessel size, and also supports the argument that larger shipping companies tend to use their own fleet rather than chartering ships to reduce risk. This may contribute to their positive EBIT and lower chartering ratio of their fleet operations.
This phenomenon can be explained by Lun, Lai, and Cheng (Citation2010) that larger shipping companies tend to operate their own fleets because shipping lines believe that utilizing internal vessels rather than chartering is less risky. Also, the strategy to own more ships instead of chartering shipping assures availability of vessels during rough times (Lun, Pang, and Panayides Citation2010; Pfeffer Citation1972). This argument is supported by current statistics of chartering ratios by shipping lines as presented in . The chartering proportion of most Asian shipping companies (COSCO Container Lines (70.0%), Yang Ming Marine Transport Corp. (64.9%), and MOL (70.9%)) is higher than that of European companies (APM-Maersk (44.6%), MSC (61.7%), CMA CGM Group (54.4%), and Hapag-Lloyd (44.6%)).
presents descriptive statistics concerning vessel size, contract charter rate, chartering period, and vessel age at contract date of 10 shipping lines.
Table 6. Descriptive statistics for vessel size, contract charter rate, chartering period, and vessel age of contracted vessels by shipping lines.
As mentioned above, APM-Maersk does not charter large vessels (>10,000 TEU) but deploys and operates their own fleets instead. CMA CGM and Hapag-Lloyd follow this behavior. However, most Asian and Korean shipping firms under this study try to maintain their market coverage by chartering large vessels. Evergreen, Yang Ming, and MOL among Asian shipping operators paid charter rates of approximately 50,000 USD per day for the use of large vessels.
In the case of Korean shipping companies, shows that the mean values of their charter duration are higher than those of the other container shipping companies. Hanjin and Hyundai M.M. featured containership charter contracts on average for 27.2 months and 20.2 months, respectively, which are higher than APM-Maersk (6.9 months) and COSCO (6.4 months). Moreover, the values of the standard deviation of Asian shipping companies including Korea firms are higher than those of European firms. The possible explanation for this high standard deviation is that Asian shipping companies may have an inconsistent and shortsighted policy for chartering.
and support that larger shipping companies prefer owning their ships to hiring vessels from the charter market to avoid risk in tight periods. This difference in chartering strategy between the four European shipping companies and the other six shipping companies can be one of the reasons resulting in positive profits and negative profits, respectively.
When it comes to the contract charter rates of Korean shipping operators, the maximum contract charter rate was 43,750 ($/day) to charter seven containerships having 10,000 TEU in November 2012, and an 8428 TEU containership at 43,500 ($/day) in October 2010, indicating higher rates compare with other shipping lines. This is one of the reasons that Hanjin suffered from financial problems and caused delays in global supply chains. Thus, two shipping lines in Korea faced difficulties due to atypical chartering rates in tight periods, and both firms fell into bankruptcy.Footnote2
Next, this paper performs regression analysis to identify determinants affecting the contract charter rate and duration for exploring more in-depth charter contract management.
5.2. Regression results: charter contract management on charter period contract
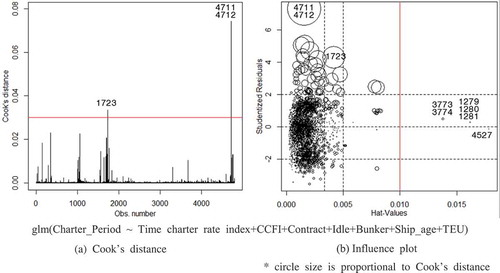
Before running the regression on the charter period, this paper detected outlying observations using deviance. Outliers often cause problems because they appear to deviate from other observations, and may strongly influence results (Rousseeuw and Hubert Citation2011). Thus, outlier filtering is necessary during the preparation step (Le Goic et al. Citation2013). One of the diagnostic tools for detecting outliers is the influence plot which displays standardized residuals, Cook’s distance, as well as hat-values. This tool provides valuable diagnostic statistics in multiple regression (Hoaglin and Welsch Citation1978). These plots consider all input variables including time charter rate index, CCFI, contract volume, idle percentage, bunker price, ship age, and TEU.
The Arabic numeral in stands for the consecutive number of each fixture record among the total of 4,801 observations. The information of each outlier is presented in . Based on Cook’s distance and hat-values, we detected nine outliers showing that excessive high rates correlate with vessel size.
Table 7. Outlier and their input variable.
Figure 5. Influence plot for detecting outlier.
Notes: Numbers in the figure refer to the serial number of the dataset.
After the outlier filtering step (n = 4792), the statistical significance of each variable in the Cox PH model was examined using the Z-test. The results from the Cox PH model are provided in . The negative sign of the coefficient in the Cox PH model indicates decreasing hazard for the duration means longer duration.
Table 8. Results comparison with each model.
Cox PH regression is utilized in the medical fields to examine longevity; thereby the Cox PH regression is called ‘survival analysis’. In the medical fields, a high hazard ratio value of more than 1 or a positive coefficient (high hazard) for longevity means leading on shortened the life. Thus, the hazard ratioFootnote3 with a value of less than zero (negative coefficient) infers that chartering duration increases. For example, the estimated hazard ratio for time charter rate index is 0.972, which yields 100 (1–0.972) = 0.028, indicating that the hazard decreases by an estimated 2.8 percent for each 1-unit increase in the time charter rate index.
This result suggests that the chartering duration will increase when the time charter rate index and CCFI increase. When the percentage of idle containership capacity increases, shipping operators tend to prefer chartering and the contract volume of chartering increases. This situation can be explained by the relationships between longer chartering period and higher idle containership capacity and volume of containership contracting.
provides the estimates of hazard coefficients by each group of regional shipping line. The negative coefficient of the time charter rate index indicates that charter duration increases as the charter rate increases, everything else being equal. A possible explanation can be found in container shipping in which carriers tend to have long-term charter contracts when markets have recovered. The estimated coefficient of the CCFI variable reveals similar results with the time charter rate index, but the effectiveness is smaller than the charter rate index.
Table 9. Estimation results for the parameters of charter duration.
Regarding the contract volume for ordering new ships, results reveal that there is no significant difference between charter duration due to the extreme degree of fluctuation in contract volume.
The negative and significant coefficients of idle percentage indicate that shipping companies are reluctant to operate their vessels due to the oversupply, and this tendency leads to the long-term charter duration between charterers and ship owners. A possible explanation includes shipping operators tend to prefer chartering instead of ordering new ships or expanding their fleet due to the negative forecasting concerning future shipping market conditions when the number of idle ships increases, and shipowners expect long-term contracts that result in stable financial profit.
The results in show a positive and significant relationship between contract charter period and bunker price in Group 1. This relation can be attributed to the fact that European shipping lines reduce risks regarding fuel costs when oil price increases by reducing the chartering period for smaller ships.
The estimated coefficient of vessel age on charter period suggests that there is a negative relationship in Group 2, and a positive relationship in Group 3. This can be explained by intermediate, and Panama vessels show a longer chartering period compared to older ships.
Finally, the estimated coefficient of vessel size is significant for Groups 2 and 3. This result is supported by in the Introduction section that shows a positive relationship between charter duration and size of the vessel.
According to these results, Korean shipping companies are more affected by higher time charter rate index compared with other regional shipping lines. This implies that they are more sensitive to the shipping market condition subject to the strategy for charter contract management.
6. Concluding remarks
Shipping firms have confronted low or even declining rates in the spot and charter markets, resulting in increasing the number of idle containerships. Nevertheless, the EBIT of most European shipping companies shows positive performance from 2012 to 2016. Of course, the EBIT is attributed to various business activities. As one of these critical components, charter contract management is selected the research focus for this paper.
In this context, this paper conducted data analysis of ten major vessel chartering operators, including the Hanjin Shipping Company, ranked by chartering volume. This study investigated the charter contract management of container shipping lines by examining the influence of fluctuation in shipping market conditions and vessel characteristics on the contract charter duration employing duration analysis.
Following the financial crisis in 2008, the global shipping industry has suffered from slow global economic growth and, as a result, low freight rates have deteriorated profitability. This is one of the risks that the industry could not control. That is to say, it is a risk that most European shipping companies face. Thus, most larger European shipping companies with positive earnings are reluctant to charter large containerships (over 10,000 TEU), since chartering involves risk in tight periods. This phenomenon was explained by Pfeffer (Citation1972) and Lun, Pang, and Panayides (Citation2010) in that shipping lines believe that utilizing internal vessels rather than chartering is less risky. On the contrary, the ratio of chartering in Asian shipping companies is higher than European companies. Especially, Asian shipping companies have chartered many large container vessels. Moreover, in terms of charter duration, Taiwan and Korean shipping companies show long-term period chartering from 2012 to 2016.
Duration analysis found the charter contract management of European shipping companies was significantly affected by time charter rate index, CCFI, contract, idle, and bunker. However, most Asian and Korean shipping companies’ charter contract management regarding chartering duration exhibit significant results concerning time charter rate index and CCFI. Although most charter contract management involves shortening the chartering period, the charter rate decreases. Korean shipping companies behave in contrast to this strategy, and this has contributed to their collapse. One of the findings from test results in this paper is that the charter periods of Hanjin was longer than other container carriers with higher rates.
The Hanjin’s bankruptcy may be attributed to the miscalculation of chartering risk as well as forecast errors and shipping market conditions. Of course, Hanjin chartered vessels with longer-term periods of charter contracts, mostly ten years, at a high rate for some large vessels compared to competitors. This chartering mismanagement and adverse conditions of the worldwide shipping market were primary causes of the Hanjin’s bankruptcy. In 2007, the ownership was changed owing to the passing of the Chief Executive Officer of the company. In the period of transition of top management, various top managers having long chartering experience resigned from the company. Although it is hard to quantify its impact on the bankruptcy of the company, it seems to have undermined the company’s ability to maneuver in the adverse shipping environment.
In addition, the collapse of Hanjin Shipping Company is attributable to the lack of effective governance. In other words, over-regulation from the Korean government that does not understand international shipping environments and the specific characteristics of shipping finance is another cause of the collapse of the Hanjin Shipping Company. In particular, there were policy conflicts among the ministers within the same government. For example, the Ministry of Oceans and Fisheries and the Ministry of Economy and Finance could not find a common rationale and justification to provide the company with financial support.
Lastly, the reason that Hyundai Merchant Marine Ltd. has survived a similar crisis is, among others, that the Korean government recognized that most of the debts of the company stemmed from the domestic financial sector, while a large portion of Hanjin Shipping Company’s debts originated in the global financial sector. Lessons from the 1997 financial crisis in Korea (Lee Citation1999) allowed the Korean government to place Hanjin under statutory management, despite the company featuring a much lower debt-to-equity ratio than Hyundai. In this regard, further research on the causality of the debt-to-equity ratio of shipping companies and the government’s maritime industry governance structure is desirable to draw the causes of the collapse of Hanjin and meaningful implications.
This paper has a couple of limitations resulting from data limitations. In the case of ocean-going shipping companies, the sample data of Group 4 (Very Large and ULCV) were not sufficient. This paper provided no econometric analysis with respect to Group 4 (Very Large and ULCV) due to the lack of sample data. In addition, chartering data for large vessels is limited and the data of contract time charter rate index for large vessels could not be obtained. Future studies should analyze the contract management of chartering larger vessels. Further study can be also conducted involving an in-depth investigation of the outlier data with respect to the causes why shipping companies engage in abnormal chartering behavior. One of the possible explanations of chartering behavior may be related to a financial aspect to disperse and mitigate risks.
Although this research was carefully conducted, it has unavoidable limitations. First, charter contract management in this paper was analyzed in a general sense, including bareboat chartering. Due to data limitations, this study utilized charter contract data without separating bareboat charter cases. Disaggregated date of the bareboat charter should be addressed in future studies to show that long-term chartering agreements, such as bareboat or regular agreements, feature different pricing strategies.
Disclosure statement
No potential conflict of interest was reported by the authors.
Notes
1. They denote that the charter rate is the price for shipping lines to charter vessels while the freight rates is the price for shippers to pay the delivery services served from carriers.
2. Hyundai M. M. was able to survive with the success of the negotiation the lower charter rate with ship owners and joined 2M Alliance (Maersk Line and Mediterranean Shipping Co.), while Hanjin failed to reach the agreement over the adjusted charter rate with their lessor.
3. ‘Hazard ratio can be also interpreted almost exactly like odds ratios in logistic regression’ (Allison Citation2010, p. 132).
References
- Adland, R., F. Bjerknes, and C. Herje. 2017. “Spatial Efficiency in the Bulk Freight Market.” Maritime Policy & Management 44 (4): 413–425. doi:10.1080/03088839.2017.1298864.
- Adland, R., P. Cariou, and F.-C. Wolff. 2016. “The Influence of Charterers and Owners on Bulk Shipping Freight Rates.” Transportation Research Part E: Logistics and Transportation Review 86: 69–82. doi:10.1016/j.tre.2015.11.014.
- Adland, R., P. Cariou, and F.-C. Wolff. 2017. “What Makes a Freight Market Index? An Empirical Analysis of Vessel Fixtures in the Offshore Market.” Transportation Research Part E: Logistics and Transportation Review 104: 150–164. doi:10.1016/j.tre.2017.06.006.
- Adland, R., and K. Cullinane. 2005. “A Time-Varying Risk Premium in the Term Structure of Bulk Shipping Freight Rates.” Journal of Transport Economics and Policy 39 (2): 191–208. http://www.jstor.org/stable/20053960.
- Adland, R., and H. Jia. 2008. “Charter Market Default Risk: A Conceptual Approach.” Transportation Research Part E: Logistics and Transportation Review 44 (1): 152–163. doi:10.1016/j.tre.2006.06.002.
- Adland, R., and S. Strandenes. 2006. “Market Efficiency in the Bulk Freight Market Revisited.” Maritime Policy & Management 33 (2): 107–117. doi:10.1080/03088830600612773.
- Alizadeh, A. H., and W. K. Talley. 2011a. “Microeconomic Determinants of Dry Bulk Shipping Freight Rates and Contract Times.” Transportation 38 (3): 561–579. doi:10.1007/s11116-010-9308-7.
- Alizadeh, A. H., and W. K. Talley. 2011b. “Vessel and Voyage Determinants of Tanker Freight Rates and Contract Times.” Transport Policy 18 (5): 665–675. doi:10.1016/j.tranpol.2011.01.001.
- Allison, P. D. 2010. Survival Analysis Using SAS: A Practical Guide. Analysis. 2nd ed. Cary, North Carolina, USA: SAS Institute.
- Barnard, B. 2015. “Container Charter Rates Rising on Rush of New Liner Services.” Journal of Commerce, May 1. https://www.joc.com/maritime-news/container-lines/container-charter-rates-rising-rush-new-liner-services_20150501.html
- Berg-Andreassen, J. A. 1998. “A Portfolio Approach to Strategic Chartering Decisions.” Maritime Policy & Management 25 (4): 375–389. doi:10.1080/03088839800000060.
- Bijwaard, G. E., and S. Knapp. 2009. “Analysis of Ship Life Cycles: The Impact of Economic Cycles and Ship Inspections.” Marine Policy 33 (2): 350–369. doi:10.1016/j.marpol.2008.08.003.
- Cariou, P., and F.-C. Wolff. 2013. “Chartering Practices in Liner Shipping.” Maritime Policy & Management 40 (4): 323–338. doi:10.1080/03088839.2013.781280.
- Glen, D., M. Owen, and R. van der Meer. 1981. “Spot and Time Charter Rates for Tankers, 1970-77.” Journal of Transport Economics and Policy 15 (1): 45–58. http://www.jstor.org/stable/20052597.
- Guo, S. 2010. Survival Analysis. Oxford: Oxford University Press.
- Hoaglin, D. C., and R. E. Welsch. 1978. “The Hat Matrix in Regression and ANOVA.” The American Statistician 32 (1): 17–22.
- Hoffmann, J. 2010. “Shipping Out of the Economic Crisis.” Brown Journal of World Affairs 16 (2): 121–130.
- Kavussanos, M. G. 1996. “Comparisons of Volatility in the Dry-Cargo Ship Sector: Spot versus Time Charters, and Smaller versus Larger Vessels.” Journal of Transport Economics and Policy 30 (1): 67–82. http://www.jstor.org/stable/20053097.
- Kavussanos, M. G., and A. H. Alizadeh-M. 2001. “Seasonality Patterns in Dry Bulk Shipping Spot and Time Charter Freight Rates.” Transportation Research Part E: Logistics and Transportation Review 37 (6): 443–467. doi:10.1016/S1366-5545(01)00004-7.
- Kavussanos, M. G., and A. H. Alizadeh-M. 2002. “The Expectations Hypothesis of the Term Structure and Risk Premiums in Dry Bulk Shipping Freight Markets.” Journal of Transport Economics and Policy 36 (2): 267–304.
- Kleinbaum, D. G., and M. Klein. 2012. Survival Analysis: A Self-Learning Text. 3rd ed. New York: Springer.
- Le Goic, G., C. A. Brown, H. Favreliere, S. Samper, and F. Formosa. 2013. “Outlier Filtering: A New Method for Improving the Quality of Surface Measurements.” Measurement Science and Technology 24 (1): 1–13. doi:10.1088/0957-0233/24/1/015001.
- Lee, P. T. W. 1999. “Restructuring of the Economy and Its Impacts on the Korean Maritime Industry.” Maritime Policy & Management 26 (4): 311–325. doi:10.1080/030888399286763.
- Lee, P. T. W., C.-W. Lin, and S.-H. Shin. 2012. “A Comparative Study on Financial Positions of Shipping Companies in Taiwan and Korea Using Entropy and Grey Relation Analysis.” Expert Systems with Applications 39 (5): 5649–5657. doi:10.1016/j.eswa.2011.11.052.
- Lun, Y. H. V., K.-H. Lai, and T. C. E. Cheng. 2010. Shipping and Logistics Management. London: Springer.
- Lun, Y. H. V., K. W. Pang, and P. M. Panayides. 2010. “Organisational Growth and Firm Performance in the International Container Shipping Industry.” International Journal of Shipping and Transport Logistics 2 (2): 206–223. doi:10.1504/IJSTL.2010.030867.
- Luo, M., S.-H. Shin, and Y.-T. Chang. 2017. “Duration Analysis for Recurrent Ship Accidents.” Maritime Policy & Management 44 (5): 603–622. doi:10.1080/03088839.2017.1319983.
- Notteboom, T. E., and B. Vernimmen. 2009. “The Effect of High Fuel Costs on Liner Service Configuration in Container Shipping.” Journal of Transport Geography 17 (5): 325–337. doi:10.1016/j.jtrangeo.2008.05.003.
- Ozer, T., and I. B. Cetin. 2012. “A Study on the Charter Type Choice of Turkish General Cargo and Drybulk Shipowners.” The Asian Journal of Shipping and Logistics 28 (2): 203–226. doi:10.1016/j.ajsl.2012.08.004.
- Pfeffer, J. 1972. “Merger as a Response to Organizational Interdependence.” Administrative Science Quarterly 17 (3): 382–394. doi:10.2307/2392151.
- Rousseeuw, P. J., and M. Hubert. 2011. “Robust Statistics for Outlier Detection.” Wiley Interdisciplinary Reviews: Data Mining and Knowledge Discovery 1 (1): 73–79. doi:10.1002/widm.2.
- Rygaard, J. M. 2009. “Valuation of Time Charter Contracts for Ships.” Maritime Policy & Management 36 (6): 525–544. doi:10.1080/03088830903346087.
- Shen, C. 2016. “Insufficient Working Capital the Cause of Hanjin Shipping’s Fallout Insufficient Working Capital the Cause of Hanjin Shipping’s Fallout.” LLoyd’s List, September 22.
- Taylor, A. J. 1981. “A Model for the Evaluation of Some Shipping Company Decisions.” Maritime Policy & Management 8 (2): 73–83. doi:10.1080/03088838100000029.
- Wang, H., S. Huang, Z. Liu, and L. Zheng. 2013. “Optimal Tanker Chartering Decisions with Spot Freight Rate Dynamics Considerations.” Transportation Research Part E: Logistics and Transportation Review 51: 109–116. doi:10.1016/j.tre.2012.12.006.
- Wang, X., K. Fagerholt, and S. W. Wallace. 2017. “Planning for Charters: A Stochastic Maritime Fleet Composition and Deployment Problem.” Omega 79: 54–66. doi:10.1016/j.omega.2017.07.007.
- Zhang, H., and Q. Zeng. 2015. “A Study of the Relationships between the Time Charter and Spot Freight Rates.” Applied Economics 47 (9): 955–965. doi:10.1080/00036846.2014.985371.