
 ?Mathematical formulae have been encoded as MathML and are displayed in this HTML version using MathJax in order to improve their display. Uncheck the box to turn MathJax off. This feature requires Javascript. Click on a formula to zoom.
ABSTRACT
The Malacca Strait, the Suez Canal and the Panama Canal play an important role in the global container shipping. To study the impact of main channel interruption on the container shipping, we analysed statistical data on all routes operated by the top 100 global container liner companies and constructed a network model. We selected four topological metrics to measure the network’s connectivity and used the network weekly total shipping capacity and average shortest shipping time to measure the network’s transportation capacity and transportation time. The interruption of the main channel is simulated, and the changes in the metrics are analysed. The results indicated that the network’s vulnerability is sensitive to main channel interruption. If the Malacca Strait is interrupted, the network’s prosperity degree fall by almost half and the network’s transportation time increase by more than a quarter if the Suez Canal is interrupted. In addition, East Asian and European container liner shipping have more than 50% dependence on the Malacca Strait and the Suez Canal. Moreover, the container transport time between ports in East Asia, Europe, and North America and the rest of the world increases by an average of 4–9 days in the main channel interruption.
1. Introduction
The Malacca Strait, the Suez Canal, and the Panama Canal are the main channels in the global container liner shipping network. They are the necessary channels for container shipping between the India Ocean and Pacific Ocean, the Mediterranean Sea and India Ocean, the Pacific Ocean and Atlantic Ocean, respectively. Most of the routes through these main channels are trans-regional routes. Such routes connect the shipping core regions (i.e. East Asia, Europe, and North America) (Liu, Wang, and Zhang Citation2018) together, and the number and capacity of these routes are extremely large. If these routes cannot run properly, the global economy will be greatly impacted (Song et al., Citation2018; Wang et al., Citation2019). So the main channels and these routes play an important role in the global container liner shipping network.
In history, the Suez Canal was closed two times because of war, and the longest closing time was eight years. From 2010 to 2014, there were 23 ship accidents and 271 pirate attacks in the Malacca Strait. There were 12 ship accidents and 1 pirate attack in the Suez Canal. There were five ship incidents in the Panama Canal (Data from the GISIS database of IMO). The above data show that the security environment of the three main channels is not optimistic. Whether it is a war or a ship accident or a terrorist attack, it may lead to a different degree of interruption of a main channel. Today, a long-term interruption of a main channel as a result of a local war or military blockade is an extreme case, but a short-term interruption of a main channel by a ship accident or terrorist attack could occur at any time. So, as the dependence of the world economy on container liner shipping constantly increases (Munim and Schramm Citation2018), research on the impact of main channel interruption on the global container liner shipping network is of great significance.
In recent years, complex network theories have been used to analyse natural and man-made networks such as in biology (Barabási and Oltvai Citation2004; Bullmore and Sporns Citation2009), transportation networks (Belkoura et al. Citation2016; Rodriguez-Nunez and Garcia-Palomares Citation2014), and the World Wide Web (Albert, Jeong, and Barabási Citation1999). Using these theories to study the container liner shipping network has become a research focus (Ducruet, Rozenblat, and Zaidi Citation2010). Several researchers have addressed the community structure (Ducruet, Rozenblat, and Zaidi Citation2010; Sun, Zheng, and Hu Citation2012), small-world property (Ducruet and Zaidi Citation2012; Caschili et al. Citation2014; Liu, Wang, and Zhang Citation2018), rich-club phenomenon (Hu and Zhu Citation2009), and connectivity (Montes, Seoane, and Laxe Citation2012) of the container liner shipping network, and considered it to be an evolving complex adaptive system (Xu et al. Citation2015). Studies on the vulnerability of the container liner shipping network have mainly included definitions of and quantification methods for container liner shipping network vulnerability (Manzano et al. Citation2014; Reggiani, Nijkamp, and Lanzi Citation2015), using targeted link disruption to investigate network vulnerability (Viljoen and Joubert Citation2016), along with port hierarchical structure analysis (Laxe, Seoane, and Montes Citation2012). Studies on network connectivity have mainly focused on ports and channels, and have included determinants of port centrality (Wang and Cullinane Citation2016), the spatial structure and regional dynamics of ports (Ducruet and Notteboom Citation2012), evaluation methods for port importance and connectivity (Bartholdi, Jarumaneeroj, and Ramudhin Citation2016; Cullinane and Wang Citation2012), the logistical gravity model for investigating the logistical connections among various ports (Wei, Sheng, and Lee Citation2018), the strategic network model for predicting the container flow pattern after significant events (Lin and Huang Citation2017), risk assessment for channel security (Finkl, Pelinovsky, and Cathcart Citation2012; Raymond Citation2006), and the effect of the Suez Canal and Panama Canal on the connectivity of marine networks (Ducruet, Citation2016; Kolzsch and Blasius Citation2011).
Although many studies have addressed the characteristics of the container liner shipping network and provided important theoretical contributions and reference values for the study of container liner shipping network vulnerability, some problems and inadequacies still require further work. For example, Ducruet and Zaidi (Citation2012), Cullinane and Wang (Citation2012), Ducruet (Citation2016), and Lin et al. (Citation2017) made research on connectivity and transportation capacity of container liner shipping network, but they seldom studied the transportation time. And the transportation capacity between a pair of ports refers to the capacity within a unit time, but they mainly considered ship capacity between ports and seldom considered the transport frequency. Ducruet and his team studied hub dependence (Ducruet, Lee, and Ng Citation2010) and the dependence of ports on the Suez Canal and the Panama Canal (Ducruet Citation2016). However, the comparative analysis of the dependence of the shipping core regions on the Malacca Strait, the Suez Canal, and the Panama Canal still require further work. Wu (Citation2017) made research on the impact of main channel interruption on the connectivity of the global container liner shipping network, but they seldom considered transportation capacity and transportation time, and the impact of main channel interruption on the shipping core regions’ container liner shipping still require further work. To study the impact of main channel interruption on the vulnerability of the global container liner shipping network and the shipping core regions’ container liner shipping comprehensively, we used the route data for the top 100 global container liner companies to construct a global container liner shipping network model that considered the factors of the weekly transportation capacity and transportation time. In this methodology, we selected the network average degree, isolated-node proportion, clustering coefficient, and average shortest-path length to measure the network connectivity. We also used the network weekly total shipping capacity (we called it prosperity degree) and average shortest shipping time, to measure the network’s transportation capacity and transportation time. Moreover, we considered the dependence of a shipping core region’s container liner shipping on a main channel (we called it dependence degree). In the analysis, the main channel interruption is simulated using a reasonable route deletion strategy, and the impacts of the main channel interruption on the global container liner shipping network and container liner shipping of East Asia, Europe, and North America were analysed by calculating the changes in the network metrics. The rationality and effectiveness of the network model and analytical method in this paper were also demonstrated.
The remainder of this paper is as follows. Section 2 describes the data and network model of global container liner shipping. The method for calculating network metrics and simulating main channel interruption are presented in Section 3. Section 4 analyses the impact of main channel interruption on network’s vulnerability and shipping core regions based on the change rates of network metrics. Finally, concluding remarks are presented in Section 5 with an alternative route and further research prospects.
2. Data and network model
2.1. Data
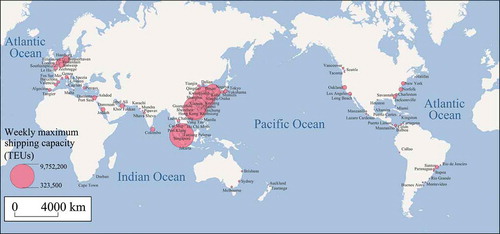
This study performed a statistical analysis of the data for the routes operated by the top 100 container liner companies in 2015, which occupied 93% of the global container liner shipping capacity. The data of a route usually include the port of call, schedule, and ship capacity. Taking NE4 service route of COSCO Container Lines as example, as shown in , this route utilises 10 ships with the capacity of 6500 TEUs, and continuously calls Ningbo, Shanghai, Hong Kong, Singapore, Rotterdam, Hamburg, Antwerp, Singapore, Yantian, Kaohsiung, Ningbo in 70 days (10 weeks). The results indicated that there were 2827 shipping routes (without overlapping lines) in the global container liner shipping network, with 654, 311, and 126 shipping routes passing through the Malacca Strait, Suez Canal, and Panama Canal, respectively, which represented 23.13%, 11.00%, and 4.46% of the global container shipping routes, respectively. The global container liner shipping network (considering different ports in the same city as a single port) contained 734 container ports, with 241, 173, and 135 ports employed by shipping routes passing through the Malacca Strait, Suez Canal, and Panama Canal, respectively, which represented 32.83%, 23.57%, and 18.39%, of the container ports, respectively. The distribution of the major container ports in the world is shown in .
Figure 1. Diagram for NE4 service route of COSCO Container Lines.
Source: realised by authors based on the website of COSCO Container Lines.
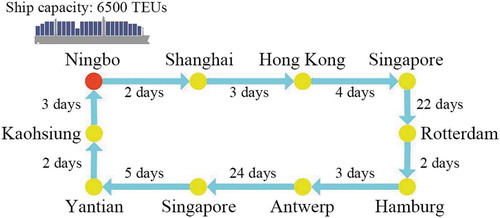
Figure 2. Distribution map of the major container ports in the world.
Source: realised by authors based on statistical data on all routes operated by the top 100 container liner companies.
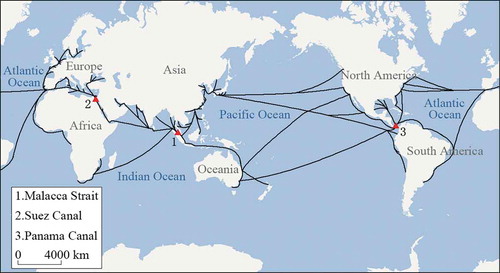
2.2. Network model
The layout of the global container liner shipping network is shown in . The global container liner shipping network is real transportation network, and it is necessary to construct a weighted network to analyse it. Therefore, the choice of link weight is particularly important. It is hard to get container flow data at the level of ports, but many scholars use other methods to define link weight. Hu and Zhu (Citation2009) assign link weight based on ‘the number of container lines traveling between port and port
’, however, this treatment ignores shipping capability of the routes and makes no distinction between a trunk route and a feeder route. Then, many studies define the weight of a link to be the total capacity of all container ships traversing that link (Caschili et al. Citation2014; Ducruet, Rozenblat, and Zaidi Citation2010; Kaluza et al. Citation2010; Viljoen and Joubert Citation2016; Xu et al. Citation2015), but they mainly considered ship capacity between ports and seldom considered the transport frequency. In practice, each route utilises a number of container ships moving between successive ports according to a fixed schedule (Kaluza et al. Citation2010), and these container ships have nearly the same capacity. In most cases, on the same day of the week, each route has a container ship arriving at the same port. So the transport frequency of most routes is once a week, and the weekly shipping capacity between a pair of ports is mainly related to the fixed capacity of a container ship in the route. In order to make link weight closer to actual shipping capacity, we define the weight of a link to be the weekly total ship capacity of all routes traversing that link.
Figure 3. Basic layout of the global container shipping network.
Source: realised by authors based on statistical data on all routes operated by the top 100 container liner companies.
In addition, we also considered shipping times between ports. Because of the role of market competition, the shipping times of the routes between a given pair of ports among different container shipping lines are almost the same. Thus, we define the shipping time of the link to be the average shipping time (considering the berthing time) of all shipping routes traversing that link.
The global container liner shipping network model could be constructed according to the above analysis as follows:
Take each port city as a node.
If node
and node
Container traffic is round-trip. Thus, the global container liner shipping network is abstracted as an undirected network.
The weekly shipping capacity between a pair of ports is considered to be the weight of the link.
The average shipping time of all direct shipping routes between ports
3. Methods
3.1. Network metrics
In order to analyse the changes in the entire network when a main channel is interrupted, based on the complex network theory (Albert, Jeong, and Barabási Citation1999; Buldyrev et al. Citation2010; Latora and Marchiori Citation2001) and studies on overall situation of container liner shipping network (Ducruet, Rozenblat, and Zaidi Citation2010; Hu and Zhu Citation2009; Kaluza et al. Citation2010; Viljoen and Joubert Citation2016; Wang et al. Citation2016), the network average degree, isolated-node proportion, clustering coefficient, and average shortest-path length were considered to measure the connectivity of the global container liner shipping network. At the same time, according to the specific characteristics of the container liner shipping network, the prosperity degree and average shortest shipping time were considered to measure the transportation capacity and transportation time of the network. In addition, the dependence degree was considered to measure the dependence of a shipping core region’s container liner shipping on a main channel.
If the Malacca Strait, Suez Canal, or Panama Canal is interrupted by a ship accident, pirate attack or local war, the metrics of the global container liner shipping network would inevitably change, and the intensity of this change could reflect the degree of the impact of main channel interruption on the network vulnerability. The calculation methods for the metrics are as follows.
3.1.1. Network average degree
Degree is the number of links that connect with a node (Wang and Cullinane Citation2016), and the network average degree is the average degree of nodes in the network. According to the theory of complex networks, a network’s average degree can be expressed as follows (Wang et al. Citation2016):
In Equation (1), denotes the network’s average degree,
denotes the degree of node
, and
denotes the total number of nodes in the network.
In practice, a port is a node of a maritime network, and the degree of a port reflects the importance of the port. Usually, hub ports have more routes, and branch ports or feeder ports have fewer routes (Ducruet, Lee, and Ng Citation2010). So the degrees of hub ports are always large, and the degrees of branch ports or feeder ports are usually small. If a main channel is interrupted, the routes that use that main channel will be blocked, and the ports of call may lose direct connection with each other. Thus, some ports’ degrees will decrease. A greater decrease in the network average degree indicates a greater sensitivity for the network’s vulnerability to the main channel. Then, the change rate of the network’s average degree when a main channel is interrupted can be stated as follows:
In Equation (2), denotes the change rate of the network’s average degree, and
and
denote the network’s average degree values before and after the main channel is interrupted, respectively.
3.1.2. Isolated-node proportion
An isolated node is a node without any connecting links. When a port becomes an isolated node, it has to stop operation because it has no route calls at the port, which will significantly affect the import and export trade of the port city. The network’s proportion of isolated nodes when operation in a main channel is interrupted can be stated as follows:
In Equation (3), denotes the network’s proportion of isolated nodes, and
and
denote the numbers of nodes in a network before and after the main channel is interrupted, respectively. A greater proportion of isolated nodes is associated with a greater sensitivity for the maritime network’s vulnerability to the main channel.
3.1.3. Clustering coefficient
The clustering coefficient is the average probability that two nodes that connect to the same node are connected (Ducruet and Zaidi Citation2012); it measures the relationship between neighbouring nodes in the network and reflects the network’s degree of aggregation (Hu and Zhu Citation2009; Soffer and Vazquez Citation2005). In the network, we define the ports that are directly connected with port as the neighbours of port
. According to the complex network theories, the local clustering coefficient
of port
can be found as follows:
In Equation (4), is the number of links between
and its neighbours, and
is the number of neighbours of port
.
The network’s clustering coefficient is the average of all the local clustering coefficients; it can be found as follows:
Then, the change rate of the network’s clustering coefficient when a main channel is interrupted can be stated as follows:
In Equation (6), denotes the change rate of the network’s clustering coefficient, and
and
denote the clustering coefficients of the network before and after, respectively, the main channel is interrupted, respectively. A larger decrease in the clustering coefficient is associated with a greater sensitivity for the maritime network’s vulnerability to the main channel.
3.1.4. Average shortest-path length
The network’s average shortest-path length is another important metric for measuring the connectivity of a network. In reality, when container liner companies beginning new routes, they consider not only the physical distance between ports but also the transportation demand, empty container allocation, transhipment costs, and transport conditions. Therefore, they prefer to use the minimum time of transhipment rather than the physical distance between two ports to measure the transport efficiency (Wang et al. Citation2016). The shortest path length between port
and port
is defined as the smallest number of links that the container passes through from port
to port
. To describe the separation degree of all the ports in the global container liner shipping network, we assume that the network’s average shortest-path length
is the average of the shortest path lengths between all ports as follows:
For the global container liner shipping network, and
; then Equation (7) can be simplified as follows:
The change rate of the network’s average shortest-path length can be stated as follows:
In Equation (9), and
denote the average shortest-path lengths of the network before and after the main channel is interrupted, respectively. A larger change rate is associated with a greater sensitivity.
3.1.5. Prosperity degree
According to the network model proposed in this paper, the network’s prosperity degree is defined as the sum of all the links’ weights. Then, in practice, the prosperity degree of the global container liner shipping network is the sum of the weekly maximum shipping capacities between all ports. We assume that denotes the weight of the link between port
and
, and the network’s prosperity degree
can be stated as follows:
Then, the change rate of the network’s prosperity degree can be stated as follows:
In Equation (11), and
denote the network’s prosperity degree values before and after the main channel is interrupted, respectively. A greater change rate
is associated with a greater impact of the main channel interruption on the global container liner shipping network shipping capacity.
3.1.6. Average shortest shipping time
In the global container liner shipping network, the average shortest shipping time is the average of the shortest transportation times between all ports. The shortest transportation time between port
and port
is defined as the shortest transportation time for a container passing through from port
to port
, and this value is almost equal to the actual transportation time. To describe the time efficiency of transportation in the global container liner shipping network, the network’s average shortest shipping time
can be stated as follows:
For the global container liner shipping network, and
; then, Equation (12) can be simplified as follows:
The change rate of the network’s average shortest shipping time can be stated as follows:
In Equation (14), and
denote the network’s average shortest shipping times before and after the main channel is interrupted, respectively. Obviously, a greater average shortest shipping time is associated with a lower time efficiency of transportation in the global container liner shipping network.
3.1.7. Dependence degree
According to the network model constructed in this study, dependence degree can be expressed by the change rate of the total weight of the ports in a study area when a main channel is interrupted. We assume that denotes the weight of port
, and
Let denote the set of the ports in a study area. Then,
denotes the total weight of the ports in a given area, and
Finally, the dependence degree can be stated as follows:
In Equation (17), and
denote the total weights of the ports in
before and after the main channel is interrupted, respectively. Obviously, a greater dependence degree is associated with a greater dependence of a shipping core region’s container liner shipping on a main channel.
3.2. Method for simulating main channel interruption
In container shipping, the routes can be divided into two categories: those connecting different regions and those transporting cargo within a region. In most cases, the departure and destination ports of a container transported by the first kind of route are not in the same region. For example, these might be East Asia–Europe, Mediterranean–South Asia, and South-east Asia–North America routes. Containers whose departure and destination ports are in the same region are often transported by intra-region routes such as the intra-Mediterranean route, intra-East Asian route, and intra-Caribbean route. Based on the geographical positions of the Malacca Strait, Suez Canal and Panama Canal, it can be seen that all of the routes that utilise these main channels belong to the first category. If a main channel is interrupted, the corresponding routes will not able to transport containers from their departure port to destination port, which means the loss of the original transportation function for a short time. For example, if the Suez Canal is interrupted, the Mediterranean–South Asia line will not able to transport containers from the Mediterranean to South Asia. Therefore, in order to accurately reflect the actual situation, this study simulated main channel interruption by removing the routes that utilised one of these main channels (Ducruet, Citation2016). Then, the impact of main channel interruption on the global container liner shipping network was analysed by calculating the change rate of each metric of the network.
4. Result
4.1. Impact of main channel interruption on network’s vulnerability
Under normal circumstances, the average degree for the global container liner shipping network is 9.2262, which means, on average, that there are nine other ports connected with each port in the network. The clustering coefficient is 0.4972 (the clustering coefficient of the same size random network is only 0.0136), which shows that the network is relatively compact and highly clustered. The average shortest path length is 3.4424. Thus, for a shipping network with 734 port nodes, a container only needs to be transhipped 2–3 times from its departure port to destination port. The prosperity degree is 85,956,700, which is the total maximum shipping capacity between all ports in the network within a week. The average shortest shipping time is 15.0123 days, which means the average time required to transport a container from any departure port to any destination port is approximately 15 days. In addition, the maximum value of the shortest transport times between all pairs of ports in the network, that is, the diameter of the global container liner shipping network, is 64.4286 days.
As listed in , if the Malacca Strait is interrupted, the change rates of the network average degree, clustering coefficient, isolated-node proportion, average shortest-path length, prosperity degree, and average shortest shipping time will be 9.9087%, 2.1798%, 3.8214%, 6.4345%, 47.9354%, and 12.9461%, respectively. If the Suez Canal is interrupted, the change rates of these metrics will be 6.8793%, 0.9536%, 1.6492%, 4.2441%, 33.3938%, and 25.6903%, respectively. If the Panama Canal is interrupted, the change rates of these metrics will be 2.8538%, 0.9537%, 0.7844%, 2.6987%, 6.2050%, and 14.7213%, respectively. Overall, if a main channel is interrupted, the network will not collapse into sub-networks. In other words, except for a few isolated nodes, most of the network will remain intact. However, according to the change rates of the four metrics, which can reflect the network’s connectivity (network average degree, isolated-node proportion, clustering coefficient, and average shortest-path length), the connectivity of the network will declines if a main channel is interrupted, with the interruption of the Malacca Strait having the most impact, followed by the Suez Canal and Panama Canal. Compared with the network’s connectivity, the transportation capacity of the network will be more affected. If the Malacca Strait is interrupted, the network’s prosperity degree will fall by nearly half, followed by the Suez Canal and Panama Canal. Meanwhile, the main channel interruption also results in a large decrease in the transportation time. The change rate of the average shortest shipping time will be more than 25% if the Suez Canal is interrupted, followed by the Panama Canal and Malacca Strait. It should be noted that the capacity and shipping time of all links are not considered in the process of calculating network average degree, isolated-node proportion, clustering coefficient, and average shortest-path length, and the weights of all links are regarded as the same. So these four metrics can only reflect the changes in network structure, but they can’t reflect the changes of network transportation function. However, in the process of calculating prosperity degree and average shortest shipping time, the capacity and shipping time of all links are considered, respectively. So these two metrics can reflect the changes of network transportation function. As the result shown, when a main channel is interrupted, the impact on network’s transportation capacity and transportation time are much greater than that of network structure. This means the transportation capacity and transportation time of the network is greatly impacted while the structure of the network is only slightly impacted. This phenomenon just indicates that the three main channels are the key nodes in the global container shipping liner network. It can be said a slight move in one part may affect the whole situation.
Table 1. Changes in metrics when the main channels are interrupted.
In addition, according to the above results, the network’s connectivity and transportation capacity will be more affected if the Malacca Strait is interrupted. In contrast, in terms of the transportation time, the Suez Canal and Panama Canal are more influential than the Malacca strait. This is because, in the global container liner shipping network, the scale of the routes that utilise the Malacca strait, including the number of routes and corresponding ship capacities, is greater than those of the other two main channels. Thus, it has the greatest impact on the network’s connectivity and transportation capacity. However, in terms of their geographic locations, the Suez Canal and Panama Canal are located between continents, whereas the Malacca Strait is only located between islands. Therefore, in comparison with the routes that utilise the Malacca Strait, the routes that originally utilised the Suez Canal or Panama Canal will have to bypass the African or South American continent if one of these two main channels is interrupted. As a result, the time efficiency of the container liner shipping will be more affected.
4.2. Impact of main channel interruption on the shipping core region
As listed in , the dependence degree values of East Asia, which has 118 ports, on the Malacca Strait, Suez Canal, and Panama Canal are 50.66%, 31.04%, and 4.55%, respectively. The dependence degree values of Europe, which has 135 ports, on the three main channels are 55.07%, 62.54%, and 2.47%, respectively. The dependence degree values of North America, which has 111 ports, on the three main channels are 9.49%, 11.65%, and 24.55%, respectively. As a whole, the container liner shipping of the shipping core regions is highly dependent on the main channels. Moreover, because of the difference in the main channels’ geographic locations, East Asian container liner shipping is most dependent on the Malacca Strait; European container liner shipping is most dependent on the Suez Canal; and North American container liner shipping is most dependent on the Panama Canal.
Table 2. Dependence degree values of shipping core regions on main channels.
In addition, this study also analysed the changes in the time efficiency of container transportation between the ports in a shipping core region and other ports around the world if any of the main channels is interrupted. As listed in , if the Malacca Strait, Suez Canal, and Panama Canal are interrupted, the transportation times between East Asian ports and other ports in the network will increase by averages of 7.39, 8.65, and 8.38 days, respectively. The transportation times between European ports and other ports in the network will increase by averages of 5.41, 8.66, and 4.46 days, respectively. The transportation times between North American ports and other ports in the network will increase by averages of 5.81, 7.31, and 6.36 days, respectively. This means that the time efficiencies of the shipping core regions’ container liner shipping obviously decrease.
Table 3. Average changes in transportation times between shipping core regions’ ports and other ports in network.
5. Conclusions
We constructed a global container liner shipping network model that considers the transportation capacity and transportation time based on a detailed analysis of the container route operation mechanism according to the route data released by the top 100 container liner companies. To comprehensively determine the impact of main channel interruption on the vulnerability of the global container liner shipping network, we selected four distinct and representative global topological metrics to measure the network’s connectivity and considered the network prosperity degree and average shortest shipping time to measure the network’s transportation capacity and transportation time. We also considered the dependence degree to measure the dependence of a shipping core region’s container liner shipping on a main channel. On this basis, we simulated main channel interruption by removing the routes that utilise the main channel, and then analysed the impact of main channel interruption on the network’s vulnerability according to the changes in the metrics. We reached the following conclusions:
According to the statistical analysis, 654, 311, and 126 shipping routes pass through the Malacca Strait, Suez Canal, and Panama Canal, respectively, which account for 23.13%, 11.00%, and 4.46% of 2827 shipping routes, respectively. In addition, 241, 173, and 135 ports employ shipping routes that pass through the Malacca Strait, Suez Canal, and Panama Canal, respectively, which account for 32.83%, 23.57%, and 18.39% of the 734 container ports, respectively. This finding indicates that the main channels serve an important role in the global container liner shipping network.
According to the calculation result of the metrics, we found that the global container liner shipping network has good connectivity under normal circumstances. In this network, which has 734 port nodes, a container only needs to be transhipped 2–3 times from its departure port to destination port, and the average transportation time is approximately 15 days. In addition, the maximum value of the shortest transport times between all ports in the network, that is, the radius of the global container liner shipping network, is 64.4286 days.
If the main channel is interrupted, the connectivity of the network will obviously decrease, among which the Malacca Strait has the most influence, followed by the Suez Canal and Panama Canal. Compared to the connectivity, the network’s transportation capacity and transportation time are more sensitive to main channel interruption. For example, if the Malacca Strait is interrupted, the network’s prosperity degree will fall by nearly half, and the network’s transportation time will increase by more than 25% if the Suez Canal is interrupted. Therefore, the impact of main channel interruption on the vulnerability of the global container liner shipping network is enormous.
The impact of main channel interruption on the shipping core regions’ container liner shipping is particularly prominent. According to the calculation, the dependence degree values of the East Asian and European container liner shipping on the Malacca Strait and Suez Canal are each more than 50%. If a main channel is interrupted, the container transportation time between East Asia, Europe, North America, and other ports in the world will increase by 4–9 days on average, which means the transportation time will obviously decrease.
Based on the analysis process and results, we found that prosperity degree, average shortest shipping time and dependence degree could effectively reflect the extent of the impact on the global transport capacity, transportation time, and regional transport capacity when a disturbance occurred. These perspectives and methods are important for achieving a thorough understanding of the transportation network system, and it is helpful for the establishment of main channel security policy.
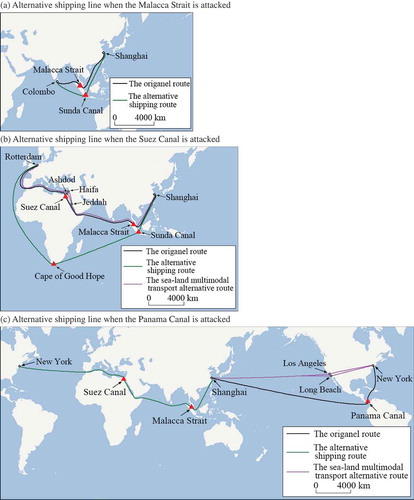
These conclusions revealed that the dependence of the global container liner shipping network on the Malacca Strait, Suez Cannel, and Panama Cannel is considerable. It should be noted that a long-term interruption of a main channel as a result of a local war or military blockade is an extreme case, but the blockage of a main channel by a terrorist or pirate attack could occur at any time. Thus, to avoid any interruption of global container liner shipping as a result of a main channel being attacked or blockaded, alternative routes should be constructed based on the existing global container liner shipping network to reduce its vulnerability and the shipping pressure on the main channels. New canals and sea-land multimodal transportation throughout East Asia, Europe, and North America should be developed to reduce the restriction of the main channels on the container liner shipping between shipping core regions and improve the network’s ability to address various types of crises. And, for shipping lines, when the Malacca Strait is interrupted, the routes that originally transport via the Malacca Strait can temporarily transport via the Sunda Strait. When the Suez Cannel is interrupted, the routes that originally pass through the Suez Cannel can temporary transport by detouring around the Cape of Good Hope or by sea-land multimodal transportation. If the alternative route transports by sea-land multimodal transportation, such as Shanghai – Rotterdam, first, it can transport containers from Shanghai to Jeddah by sea, then transport containers from Jeddah to Ashdod or Haifa by land, and last, transport containers from Ashdod or Haifa to Rotterdam by sea. When the Panama Cannel is interrupted, the original East Asia – the East Coast of North America, which passes through the Panama Cannel, can temporarily transport across the Indian Ocean, the Mediterranean and the Atlantic or eastbound by sea-land multimodal transportation. If the alternative route transports eastbound by sea-land multimodal transportation, such as Shanghai – New York, first, it can transports containers from Shanghai to Los Angeles or Long Beach by sea and second, transports containers from Los Angeles or Long Beach to New York by land. The concrete condition is shown in .
Figure 4. Alternative route when the main channels are attacked.
Source: realised by authors based on statistical data on all routes operated by the top 100 container liner companies.
In addition, in order to reduce the impact of a main channel disruption on global container liner shipping, shipping companies should consider route optimisation ahead of time, making it possible to take preventive measures. Therefore, the optimisation of container routes under the above conditions will be the next step in the study.
Acknowledgement
The authors would like to thank the anonymous reviewers for their useful commentson an earlier version of this article.
Disclosure statement
No potential conflict of interest was reported by the authors.
Additional information
Funding
References
- Albert, R., H. Jeong, and A. L. Barabási. 1999. “Internet – Diameter of the World-Wide Web.” Nature 401 (6749): 130–131. doi:10.1038/43601.
- Barabási, A. L., and Z. N. Oltvai. 2004. “Network Biology: Understanding the Cell’s Functional Organization.” Nature Reviews Genetics 5 (2): 101–U15. doi:10.1038/nrg1272.
- Bartholdi, J. J., P. Jarumaneeroj, and A. Ramudhin. 2016. “A New Connectivity Index for Container Ports.” Maritime Economics & Logistics 18 (3): 231–249. doi:10.1057/mel.2016.5.
- Belkoura, S., A. Cook, J. M. Pena, and M. Zanin. 2016. “On the Multi-Dimensionality and Sampling of Air Transport Networks.” Transportation Research Part E: Logistics and Transportation Review 94: 95–109. doi:10.1016/j.tre.2016.07.013.
- Buldyrev, S. V., R. Parshani, G. Paul, H. E. Stanley, and S. Havlin. 2010. “Catastrophic Cascade of Failures in Interdependent Networks.” Nature 464 (7291): 1025–1028. doi:10.1038/nature08932.
- Bullmore, E. T., and O. Sporns. 2009. “Complex Brain Networks: Graph Theoretical Analysis of Structural and Functional Systems.” Nature Reviews Neuroscience 10 (3): 186–198. doi:10.1038/nrn2575.
- Caschili, S., F. Medda, F. Parola, and C. Ferrari. 2014. “An Analysis of Shipping Agreements: The Cooperative Container Network.” Network & Spatial Economics 14 (3–4): 357–377. doi:10.1007/s11067-014-9230-1.
- Cullinane, K., and Y. H. Wang. 2012. “The Hierarchical Configuration of the Container Port Industry: An Application of Multiple Linkage Analysis.” Maritime Policy & Management 39 (2): 169–187. doi:10.1080/03088839.2011.650719.
- Ducruet, C. 2016. “The Polarization of Global Container Flows by Interoceanic Canals: Geographic Coverage and Network Vulnerability.” Maritime Policy & Management 43 (2): 242–260. doi:10.1080/03088839.2015.1022612.
- Ducruet, C., S. W. Lee, and A. K. Y. Ng. 2010. “Centrality and Vulnerability in Liner Shipping Networks: Revisiting the Northeast Asian Port Hierarchy.” Maritime Policy & Management 37 (1): 17–36. doi:10.1080/03088830903461175.
- Ducruet, C., and T. Notteboom. 2012. “The Worldwide Maritime Network of Container Shipping: Spatial Structure and Regional Dynamics.” Global Networks: A Journal of Transnational Affairs 12 (3): 395–423. doi:10.1111/j.1471-0374.2011.00355.x.
- Ducruet, C., C. Rozenblat, and F. Zaidi. 2010. “Ports in Multi-Level Maritime Networks: Evidence from the Atlantic (1996–2006).” Journal of Transport Geography 18 (4): 508–518. doi:10.1016/j.jtrangeo.2010.03.005.
- Ducruet, C., and F. Zaidi. 2012. “Maritime Constellations: A Complex Network Approach to Shipping and Ports.” Maritime Policy & Management 39 (2): 151–168. doi:10.1080/03088839.2011.65071.
- Finkl, C. W., E. Pelinovsky, and R. B. Cathcart. 2012. “A Review of Potential Tsunami Impacts to the Suez Canal.” Journal of Coastal Research 28 (4): 745–759. doi:10.2112/JCOASTRES-D-12A-00002.1.
- Fremont, A. 2007. “Global Maritime Networks: The Case of Maersk.” Journal of Transport Geography 15 (6): 431–442. doi:10.1016/j.jtrangeo.2007.01.005.
- Hu, Y. H., and D. L. Zhu. 2009. “Empirical Analysis of the Worldwide Maritime Transportation Network.” Physica A: Statistical Mechanics and Its Applications 388 (10): 2061–2071. doi:10.1016/j.physa.2008.12.016.
- Kaluza, P., A. Kolzsch, M. T. Gastner, and B. Blasius. 2010. “The Complex Network of Global Cargo Ship Movements.” Journal of the Royal Society Interface 7 (48): 1093–1103. doi:10.1098/rsif.2009.0495.
- Kolzsch, A., and B. Blasius. 2011. “Indications of Marine Bioinvasion from Network Theory: An Analysis of the Global Cargo Ship Network.” European Physical Journal B 84 (4): 601–612. doi:10.1140/epjb/e2011-20228-5.
- Latora, V., and M. Marchiori. 2001. “Efficient Behavior of Small-World Networks.” Physica Review Letters 87 (19): 198701. doi:10.1103/PhysRevLett.87.198701.
- Laxe, F. G., M. J. F. Seoane, and C. P. Montes. 2012. “Maritime Degree, Centrality and Vulnerability: Port Hierarchies and Emerging Areas in Containerized Transport (2008–2010).” Journal of Transport Geography 24: 33–44. doi:10.1016/j.jtrangeo.2012.06.005.
- Lin, D. Y., and K. L. Huang. 2017. “An Equilibrium-Based Network Model for International Container Flows.” Maritime Policy & Management 44 (8): 1034–1055. doi:10.1080/03088839.2017.137185.
- Liu, C. L., J. Q. Wang, and H. Zhang. 2018. “Spatial Heterogeneity of Ports in the Global Maritime Network Detected by Weighted Ego Network Analysis.” Maritime Policy & Management 45 (1): 89–104. doi:10.1080/03088839.2017.1345019.
- Manzano, M., F. Sahneh, C. Scoglio, E. Calle, and J. L. Marzo. 2014. “Robustness Surfaces of Complex Networks.” Scientific Reports 4: 6133. doi:10.1038/srep06133.
- Montes, C. P., M. J. F. Seoane, and F. G. Laxe. 2012. “General Cargo and Containership Emergent Routes: A Complex Networks Description.” Transport Policy 24: 126–140. doi:10.1016/j.tranpol.2012.06.022.
- Munim, Z. H., and H. J. Schramm. 2018. “The Impacts of Port Infrastructure and Logistics Performance on Economic Growth: The Mediating Role of Seaborne Trade.” Journal of Shipping and Trade 3 (1): 1–19. doi:10.1186/s41072-018-0027-0.
- Raymond, C. Z. 2006. “Maritime Terrorism in Southeast Asia: A Risk Assessment.” Terrorism and Political Violence 18 (2): 239–257. doi:10.1080/09546550500383225.
- Reggiani, A., P. Nijkamp, and D. Lanzi. 2015. “Transport Resilience and Vulnerability: The Role of Connectivity.” Transportation Research Part A: Policy and Practice 81: 4–15. doi:10.1016/j.tra.2014.12.012.
- Rodriguez-Nunez, E., and J. C. Garcia-Palomares. 2014. “Measuring the Vulnerability of Public Transport Networks.” Journal of Transport Geography 35: 50–63. doi:10.1016/j.jtrangeo.2014.01.008.
- Soffer, S. N., and A. Vazquez. 2005. “Network Clustering Coefficient without Degree-Correlation Biases.” Physica Review E 71 (5): 057101. doi:10.1103/PhysRevE.71.057101.
- Song, Y. T., and N. Wang. 2018. “Exploring Temporal and Spatial Evolution of Global Coal Supply-Demand and Flow Structure.” Energy. doi:10.1016/j.energy.2018.11.144.
- Sun, Z., J. F. Zheng, and H. T. Hu. 2012. “Finding Community Structure in Spatial Maritime Shipping Networks.” International Journal of Modern Physics C 23 (6): 1250044. doi:10.1142/S0129183112500441.
- Viljoen, N. M., and J. W. Joubert. 2016. “The Vulnerability of the Global Container Shipping Network to Targeted Link Disruption.” Physica A: Statistical Mechanics and Its Applications 462: 396–409. doi:10.1016/j.physa.2016.06.111.
- Wang, N., N. Wu, L. L. Dong, H. K. Yan, and D. Wu. 2016. “A Study of the Temporal Robustness of the Growing Global Container Shipping Network.” Scientific Reports 6 (34217). doi:10.1038/srep34217.
- Wang, Y. H., and K. Cullinane. 2016. “Determinants of Port Centrality in Maritime Container Transportation.” Transportation Research Part E: Logistics and Transportation Review 95: 326–340. doi:10.1016/j.tre.2016.04.002.
- Wang, Y. X., and N. Wang. 2019. “Ther Role of the Marine Industry in China’s National Economy: An Input-Output Analysis.” Marine Policy 99: 42–49. doi:10.1016/j.marpol.2018.10.019.
- Wei, H. R., Z. H. Sheng, and P. T. W. Lee. 2018. “The Role of Dry Port in Hub-And-Spoke Network under Belt and Road Initiative.” Maritime Policy & Management 45 (3): 370–387. doi:10.1080/03088839.2017.1396505.
- Wu, D., N. Wang, N. Wu, and W. N. Lin. 2017. “The Impact of Main Channel Interruption on Vulnerability of Container Shipping Network and China Container Shipping.” Geographical Research 36 (4): 719–730. doi:10.11821/dlyj201704010.
- Xu, M. Q., Z. F. Li, Y. L. Shi, X. L. Zhang, and S. F. Jiang. 2015. “Evolution of Regional Inequality in the Global Shipping Network.” Journal of Transport Geography 44: 1–12. doi:10.1016/j.jtrangeo.2015.02.003.