
 ?Mathematical formulae have been encoded as MathML and are displayed in this HTML version using MathJax in order to improve their display. Uncheck the box to turn MathJax off. This feature requires Javascript. Click on a formula to zoom.
ABSTRACT
Port State Control (PSC) inspection data is used for determining the inspection pattern of PSC in Malaysia and identifying the relationship between the inspection place, flag state, number of deficiency, detention result, and ship risk profile. Based on 8,089 inspection reports from 2015 to 2019, the mining association rule is proposed as a learning approach due to its determination pattern in the information bank. The learning of association rules of PSC inspections is performed primarily on the Apriori Algorithm, in order to produce alluring rules. Inspection patterns of Malaysian ports revealed that flag state, ship risk profile, and inspection place generally lead to no detention result, as well as zero deficiency recorded on-board. The reported quantity of detention was significantly related to the high number of deficiencies raised for ships registered under blacklisted countries. Furthermore, the analysis of deficiency discovered the pattern of inspection at Malaysian ports is frequently related to zero and a low number of deficiencies raised by inspectors. Lastly, five major ports were selected for providing a useful rule to help PSC officers in organising an effective inspection plan. A similar approach can also be used for other ports beyond Malaysia for comparative analysis.
1. Introduction
Traffic accidents in maritime transport and hazards resulting from port operations have posed major threats to ships, crew members, and the marine environment. Each country is responsible for ensuring compliance with internationally-accepted standards for vessels flying its flag (CitationInternational Maritime Organization, n.d.). Nevertheless, control measures implemented by flag states and their Recognised Organisations have failed to eliminate all substandard vessels in the industry due to the existence of ship’s open registration system, which has been a concern of the International Maritime Organisation (IMO) and port authorities around the world as discussed by (Emecen Kara and Oksas Citation2016) and (Chen et al. Citation2019). Therefore, in order to compensate for ship inspection gaps resulting from the sole dependence on flag states and their Recognised Organisations, coastal states have established a supplementary monitoring system known as the port state control (PSC) that aims to maintain the inspection and supervision of the shipping standards implementation. In other words, PSC makes it possible for government authorities to monitor foreign ships calling at their own ports through the inspections (Yang et al. Citation2018b). This allows the maritime authority to conduct inspections on foreign ships visiting its ports to ensure that IMO standards are correctly implemented (Jihong et al. Citation2018). If the ship does not pass the inspection, it will face a certain degree of detention (Yang, Yang, and Yin Citation2018a).
Every PSC inspection engenders an inspection report that comprises comprehensive data on deficiencies noted (0 for no deficiency) along with related vessel information such as the registration flag, IMO vessel number, type of vessel, year of construction, and date of inspection (Cariou, Mejia, and Wolff Citation2008). By using these inspection data, the PSC inspection pattern can be identified through association rule mining, where the scenario of the inspection is identified for the purpose of improving the inspection’s effectiveness and efficiency. In this study, data pertaining to PSC inspections conducted on international vessels at Malaysia ports from 2015 to 2018 was utilised. This study is set to contribute to the current research in the following ways. First, the raw data from the Tokyo MoU information system is obtained and cleaned to provide useful information to be analysed, followed by mining the appropriate rule to reveal underlying knowledge. Second, the results of the experiment can be used as a reference by the government authority and other stakeholders to improve the quality of the inspection.
2. Literature review
In order to ensure maritime safety and prevention of marine pollution, it is well recognised that PSC inspection is one of the most critical solutions (Wang, Yan, and Qu Citation2019). The Tokyo Memorandum of Understanding (MoU), Paris MoU, and other comparable MoUs publish comprehensive annual reports presenting the activities and development of PSC for every calendar year. A significant number of research related to improving the effectiveness and efficiency of PSC inspection have emerged from both qualitative and quantitative perspectives.
In a study conducted by (Mansell Citation2009), a qualitative analysis on the effectiveness of PSC inspections recorded by the Tokyo MoU and Paris MoU revealed numerous issues and challenges faced by the member states. Similar work had also been carried out by (Emecen Kara and Oksas Citation2016) where the authors compared the performance of nine (9) PSC regions from 2012 to 2014 and discussed in detail the various types of PSC findings and the categories of ships that had been detained and subsequently proposed an effective inspection system. (Chung et al. Citation2020) utilised the inspection data in Taiwan’s ports and applied data mining to discover the correlation between the nature of deficiencies. In this work, the Apriori algorithm is used to identify the relationship between the deficiencies to provide the inspector with useful information in order to enhance the PSC inspection. A conceptually identical work, which utilised a similar method, was proposed by (Tsou Citation2019) where the author examined the relationships between the detention deficiencies with other factors. This valuable knowledge is important for enhancing the inspection performance by providing the inspector with a particular targeted ship.
The above-mentioned results contributed to dedicated inspectors in improving the effectiveness of the PSC inspection on-board but has had minimal impact on the higher management in maritime administration towards the application of the policy for the entire department. There have been only a few recent studies on PSC inspections in the literature that investigated the relationship between the place of inspection, flag state, number of deficiencies, detention result, and ship risk profile (SRP). These parameters will help the higher management in maritime administration to design and develop strategies for inspections in their waters. In this paper, five (5) years of historical data with 8,089 initial and follow-up inspection records will be used to generate association rules to reveal valuable information such as inspection patterns that benefit the decision-makers. In addition, knowledge discovered from the rules is useful for other maritime players such as ship owners, ship managers, and ship agents for commercial purposes.
3. Method
3.1. Fundamentals of association rule: apriori algorithm
The effectiveness of association rule mining using the Apriori algorithm to find a relationship between different attribute-value pairs in different datasets for the large scale has been proven by (Rakesh, Imieliński, and Swami Citation1993). This if-then statements approach, called association rules, is widely used to show the relationship between data items on a large scale. The application of this model helps the user to discover the correlation of items in various industries.
Association rule learning is the fundamental of conditional probability that consists of a different set of an item, called itemsets. For X ⇒ Y, these itemsets are divided by two (2) categories termed as antecedent or left-hand-side (LHS) for X and consequent or right-hand-side (RHS) for Y. In order to generate an interesting rule for PSC inspection, three (3) main parameters such as Support, Confidence, and Lift need to be considered.
Support:
The first step of the Apriori algorithm is to count up the number of occurrences, called the support, for each member item separately. Support indicates the frequency of the itemsets to occur in the dataset as shown below:
and the value of support for the rule (X ⇒ Y) can be calculated as follows:
Confidence:
Confidence is the value of conditional probability that indicates the frequency of the rule that happens to be true. In short, confidence can be calculated using the following formula:
Lift:
Lift is the useful value in association rule for predicting the consequent in the future dataset. The higher value of lift represents the dependency between itemsets. In the rule {X ⇒ Y}, it shows the correlation between X and Y. Therefore, the formulas for lift are as follows:
Lift can be interpreted as the deviation of the support of the whole rule from the support expected under independence given the support of both sides of the rule. Greater lift values (≥ 1) indicate stronger associations. Measures like support, confidence and lift are commonly called curiosity measures because they aid with aiming at potentially more exciting rules (Hahsler and Chelluboina Citation2011).
The Apriori algorithm is used in this study to determine the frequent itemsets of the database illustrated in . Firstly, the support threshold is nominated to find an interesting rule. The high support value set by the user will face the difficulty in finding the rules that consist of rare items, whereas relatively low value will generate a vast number of useless frequent patterns (Bhatt and Patel Citation2015). Hence, to avoid meaningless itemsets, the best threshold is essential to be estimated. Based on this example dataset, an itemset is frequent if it appears in at least three transactions of the database; the value of 3 is the support threshold or set to be the minimal support as 40%, which is determined through a trial-and-error basis. The algorithm computes and scans the support value in S1, then generates the list of items set in L1 as the itemsets below the threshold are removed. In order to generate a list of pairs in L2, the support value in S2 is calculated and compared. The pairs {A, D}, {D, F}, {D, H} and {F, H} all meet or exceed the minimum support of 3, so they are frequent. The other pairs are not. Now, because the others are not frequent, any larger set which contains {A, F} and {A, H} cannot be frequent. In this way, frequent triples in the database can be sought, and the final result in L3 is obtained. This process is used to generate the rules to calculate the values of confidence and lift, then the outcome is visualised for debate.
Figure 1. Frequent itemsets generated from the Apriori Algorithm
3.2. Mining workflow on PSC inspection
Data mining is typically a method of analysing and summarising data from a different perspective into useful information. The main phases of data mining consist of data collection and transformation, data cleaning and integration, and followed by data selection, data mining, data evaluation, and knowledge presentation. A similar approach is applied to association rule learning for PSC inspection which includes data preparation, data cleaning, production of frequent itemsets, generation of strong association rules, and analysis of the association rules as visualised in .
Figure 2. Mining process for PSC inspection
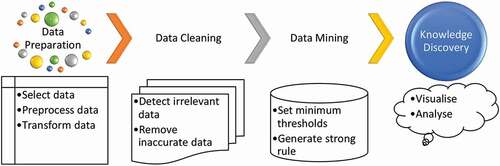
Data preparation consists of data selection, data pre-processing, and data transformation. In the data selection process, the information is extracted from the PSC database based on the requirement of the user. Data pre-processing includes eliminating noise and inconsistent data, eliminating redundant data, and converting raw data into a comprehensible format. Finally, the data transformation process converts the data into a suitable format for the target system.
The purpose of data cleaning in data mining is to identify and eradicate corrupt or inaccurate data. The amount of data obtained from the PSC database is comparatively huge, where mining association rules with this data directly is inefficient. Hence, the ship name, date of inspection, IMO number, call sign, and MMSI number are removed from the obtained data in order to facilitate the learning of association rules.
Mining the data begins with the generation of the potential frequent items in the PSC data. Next, before determining the frequent itemset, the suitable threshold value for that candidate is predicted, which will immensely affect the quality of the association rule mining (Kuo, Chao, and Chiu Citation2011). All of the unpretentious association rules are produced from repeated itemsets, and the association rules which are greater than the user-specified minimum support and confidence thresholds are nominated to form a strong association rule set.
The rule analysis begins with exploring the learned strong association rules. Then the internal relationship between the learned strong association rules and the PSC inspection is premeditated, followed by analysing the relationship of an itemset.
4. Case study
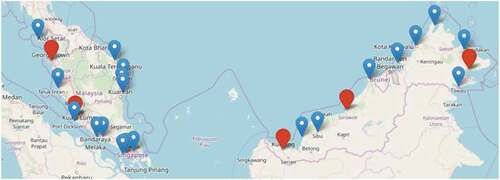
This study utilises two sets of PSC inspection data obtained from the Tokyo MoU online database. The first dataset comprises a total of 8,089 initial and follow-up inspections which were recorded for five (5) years from 2015 to 2019 in Malaysia. The second dataset consists of 6,774 initial inspections for the same period in Malaysian ports shown in . Five major ports i.e. Bintulu, Penang, Kuching, Port Kelang, and Lahad Datu are marked in red, while the remaining are marked in blue.
Figure 3. Malaysian ports
The analysis of association rules for PSC inspection in Malaysia is based on the workflow depicted in . From here onwards, the first and second datasets are referred to as ‘Initial & Follow-up Inspection’ and ‘Initial Inspection’ respectively. The Apriori algorithm is applied, and a total of 11 rules generated in this paper are based on the required information from the dataset. For instance, 8,089 inspections data from the first datasets were used to reveal the overall pattern. Likewise, the analysis of deficiency uses the same dataset, but divided into two types, i.e. without deficiency (zero deficiency) and with deficiency. Furthermore, for discovering the detention pattern, this study uses both all inspection records in the first datasets, and specific detention data from Initial Inspection dataset to analyse the relationship among criteria. Lastly, the analysis of major ports uses individual inspection data composed from the second datasets at a particular port.
Figure 4. Analysis approach for PSC inspection in Malaysian ports
The results obtained in this study are sorted according to the lift values of the first ten rules. Then, the graph of the total number of rules are generated in order to visualise the relationship among the items. This graphical representation will assist the maritime players to understand the correlation. In the graph, the support value of the rule is illustrated by the size of the circle, whereby the darker red circle indicates a higher value of lift .
5. Results and discussion
5.1. Parameter setting
In order to generate an underlying association rule, minimum support and confidence thresholds are necessary to be defined. Minimum support indicates the lowest occurrence of the itemsets happening in the dataset, while minimum confidence represents the least frequency of rule that happens to be true. The user-defined threshold depends on the PSC data and the outcome of the rules generation. The high support value set may produce fewer rules, and vice versa. However, both may not be useful for users (Cheung and Fu Citation2004). Hence, the challenge for the users in obtaining a required finding is to identify the practical threshold. The minimum support value set will directly influence the quantity and quality of the revealed pattern (Dahbi, Balouki, and Gadi Citation2018).
This study estimated a reasonable threshold by using a trial-and-error approach. A total of inspection records from the first (left) and second (right) datasets were used in predicting the preeminent limit, as shown in . Based on the graph, it indicates that reducing the support threshold creates an exponential growth of rule generation, where additional time and effort are needed to analyze the result. The spike of rules happens just after 5% of minimum support, lead this study to select 10% as a minimum threshold. This approach also reveals that the minimum confidence is proportional to support value. However, this research tends to set a high value as it indicates the reliability of the pattern generated. The analysis shows that increasing the value of confidence from 80% onward will produce fewer rules, thus grounds to be nominated as the least threshold.
Figure 5. User-defined threshold based on trial-and-error
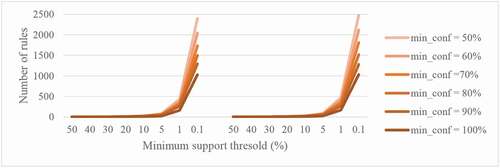
This threshold setting can be changed for individual analysis depending on the dataset used. Then, the association rules are generated with the support and confidence values higher than the threshold. Based on the maximum items in PSC datasets, the number of items appearing is limited between 1 and 4.
5.2. Overall patterns
From the 8089 Initial & Follow-up inspections data, a general overview of the PSC inspection pattern was obtained from the association rule learning as shown in and visualised in . The top ten from the 20 rules generated show that most of the ships categorised as LRS were inspected without any deficiencies in Malaysian ports with a total of 1659 appearance, verified with a lift value of 1.706.
Figure 6. Graph for overall analysis using Initial & Follow-up inspections dataset (all data)
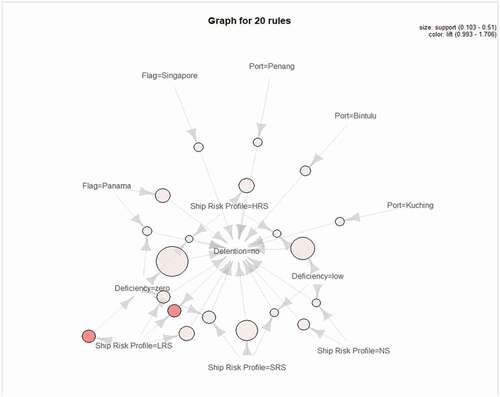
Table 1. The rule for overall analysis using Initial & Follow-up inspections dataset (all data)
The confidence value of 1.0 indicates that the itemset in LHS is equal to RHS, which means that no Singapore flag ships had been detained in the Malaysian ports for the past five years. Similar results can be observed for ships categorised as LRS, ships with zero deficiency, and Panama flag ships with zero deficiency. From the results, it can also be concluded that ships would only be detained if the inspector found any deficiencies. This is proven by the value of lift for the rule ({Detention = no}⇒{Deficiency = zero}) at 1.0. In addition, the total count number for this rule is 4126 which is equal to the total number of zero deficiency, which means the item {Detention = no} only appeared in the transition with the item {Deficiency = zero}. Apart, the finding shows that the number of inspections with no detention at Kuching port is moderately high.
Generally, association analysis in Malaysia reveals the inspection exercise mostly found zero deficiency, which leads to no detention result by the inspector. Undeniably, PSC inspectors in Malaysia have adhered to the guideline for ship detention procedure (International Maritime Organization Citation2017). Besides, it confidently predicts the seaworthiness of the LRS ship, Singapore and Panama registered ship visited Malaysia water. Hence, the number of officers and time to board those vessels will be less, as compared to the high-risk vessel, which helps the authority to allocate the inspector effectively. Also, the shipowner may ready their ship in good condition to enter Malaysian water without apprehension to the ship detention.
5.3. Detention patterns
This study intended to analyse the ship detention pattern in Malaysia. The analysis of detention used all 8,089 data to generate an association rule. Due to the low number of detentions recorded in Malaysian ports, the parameters of support and confidence were reduced to 0.1% and 10%, respectively. For this data, the parameter for RHS was set as ‘Detention = yes’ and default setting was used for LHS.
As shown in , it is obvious that ships with very high numbers of deficiencies would lead to detention of the ships. The rule {Port = Kuala Terengganu, Deficiency = very high} ⇒ Detention = yes} shows the values of confidence and lift of 0.571 and 48.149 respectively, indicating that ships calling to Kuala Terengganu with high deficiency have 57.1% confidence to be detained. In comparison, Penang Port with very high deficiency revealed a 17.7% confidence for the ships to be detained by the inspector.
Table 2. Comparison of detention patterns in Malaysian ports
In contrast, ships under the Mongolian flag (blacklisted by the Tokyo MOU) with very high deficiency have a higher possibility to be detained upon entering Malaysian ports. Another interesting finding shows that ships with very high deficiency categorised as SRS have a higher confidence value to be detained at 36.7% compared to 34.5% for ships with very high deficiency categorised as HRS.
To enhance the value of confidence in the detention analysis, 96 inspections data which affected the detention of the ships were used. The itemset for ‘Detention = yes’ was excluded and three rules were generated as shown in same table for comparison. From this analysis, a similar finding was obtained which shows the correlation and dependency of detention with number of deficiency raised during the inspection. ‘Port = Kuala Terengganu’ and ‘Port = Penang’ are related with ‘Deficiency = very high’ even though the ship is categorised as SRS.
Although the detention rate in Malaysia as low as 1.12%, it should not be ignored. The inspectors were likely to detain the vessel with a high number of deficiencies, time-consuming onboard. Regardless of HRS or SRS ship, vast findings raised will lead to detention. Therefore, an experienced officer is required to overcome those high-risk ships at a specific port in Malaysia. Furthermore, strengthening the ship targeting system is necessary to prioritize the suitable vessel for inspection, should also include in the PSC management strategy.
5.4. Deficiency patterns
The analysis of deficiency is divided into two categories; without deficiency and with deficiency. Without deficiency used all 8089 inspections data and 4126 inspections data with zero deficiency whereas with deficiency used 3963 inspections data with deficiency. Deficiency raised below five were categorized as low, whereas medium (between 6 and 10), high (between 11 and 15), and very high is assigned for more than 16 deficiencies found onboard. This analysis is used to reveal the relationship among the inspections with different numbers of deficiencies raised by the inspector. The following sub-sections were comprehensively explained and those results comparably summarized in .
Table 3. Analysis of deficiency
5.4.1. PSC inspection without deficiency—all datasets
To analyse the PSC inspection pattern for zero deficiency, we set the RHS as ‘Deficiency = zero’ and reduced the confidence parameter to 50% in order to obtain the association rules among the itemsets. As a result, seven rules were generated and reveal the dependency of the SRP to the number of deficiencies. The lift value for ships categorised as LRS is 1.706 which indicates that the ships in this category have the highest possibility of not being detained by the inspector due to zero deficiency recorded on-board. Ships in the category of SRS registered under the Panama flag (whitelisted by the Tokyo MoU) are also reported to have raised zero deficiency during the inspections.
Based on this data, more than 98% of the inspections show no detention. This is closely dependent on the deficiency where the inspector can only issue a detention when there are deficiencies found during the inspection. This is proven by the result that shows ‘Detention = no’ is related to ‘Deficiency = zero’ with 4126 counts, which is the total number of inspections without any deficiencies.
5.4.2. PSC inspection without deficiency—zero deficiency dataset
A further analysis of the PSC inspection data without deficiency was conducted on the 4126 inspection data with zero deficiency which ignored the itemsets {Deficiency} and {Detention} as they became unnecessary for this analysis. The values of minimal support and confidence were reduced to 1% and 50%, respectively. As a result, 17 rules were generated.
The finding shows that ships under the Indonesian flag (blacklisted by the Tokyo MoU) are categorised as HRS with the lift value of 3.314. This means that these ships were reported to be without any deficiencies with a confidence value of 66.7%. Furthermore, 76.9% confidence was obtained for the rule {Port = Penang, Flag = Singapore} ⇒ {Ship Risk Profile = LRS} with a count of 100. Similarly, Singapore which is ranked under the White List in the Tokyo MOU shows that their ship calling to Malaysia in the category of LRS has the confidence value of 61.7%.
The results also reveal that ships categorised as LRS for other flags such as Marshall Island, Vietnam, and Hong Kong, China were reported without deficiencies by the Malaysian PSC officer. Furthermore, ports in Malaysia such as Penang, Kuching, Lahad Datu, Bintulu, and Tawau show that most of the inspections carried out resulted in no deficiency.
5.4.3. PSC inspection with deficiency—with deficiency dataset
In this subsection, the analysis of deficiency focused on the PSC inspection data with deficiency. From the 3963 total number of inspections with deficiency recorded in the Initial & Follow-up dataset, more than 75% recorded deficiencies in the range of 1 to 5.
Based on the 3963 inspections dataset, the top ten out of 27 rules generated, which shows the correlation with ‘Deficiency = low’. It can be observed that ships registered under whitelisted flags such as Vietnam and Panama produced a high lift value when related to low deficiency. This indicates that for deficiencies in the range of 1 to 5, ships under both flags were never detained. Furthermore, the results show that ships categorised as SRS and HRS with low deficiencies would not be detained.
5.4.4. Pattern discovery
The results envision the deficiency pattern in Malaysia, disclose most the inspectors less raise the finding onboard. This may be due to the ships inspected were under the low-risk ship, or white-list registered vessel. Moreover, the implementation of the New Inspection Regime (NIR) adopted by the Tokyo MoU in 2014 contributed significantly impact to the effectiveness of PSC; as a result, Malaysia ranked among low positions for detention risk (Xiao et al. Citation2020). Hence, the government and related agencies can encourage other maritime players to deal with Malaysian port safely.
5.5. Analysis of major port
A study of essential ports emphasised the correlation among itemsets at individually. Five main ports such as Bintulu, Penang, Kuching, Port Kelang, and Lahad Datu, that contributed more than 50% of the number of inspections in Malaysia were selected to reveal the relationship in Association Rule independently. The result obtained as shown in .
Table 4. Patterns discovery at individual ports (Bintulu, Penang, Kuching, Port Kelang and Lahad Datu)
In order to discover exciting rules for the port of Bintulu, the values of support and confidence were reduced to 5% and 50%, respectively. As a result, 15 rules were generated. From the 1030 initial inspections data of Bintulu Port, the relationship between various flags, SRP, and deficiency were revealed. Ships under the Hong Kong, China flag with zero deficiency and ships under the Singapore flag were found to be in the category of LRS. Whereas ships under the Vietnam flag were reported with low deficiency and under the category of SRS. The analysis also revealed the relationship between deficiency with LRS categorised ships under the flags of Panama, Marshall Island, and Hong Kong, China at this port. Ships under the category of LRS seemed to have a higher possibility of the inspector not finding any deficiencies on-board. A slightly different pattern for Penang Port was discovered through the analysis of association rule based on the 919 initial inspections data. Three rules generated from Penang port, where it can be observed that ships in the LRS category from Singapore were frequently inspected with zero deficiency as the lift value is 1.424. Apart from that, the 0.907 value of confidence proves that LRS categorised ships calling at Penang Port were reported without deficiency by the inspector. This is similar to ships under the Singapore flag where they were reported without any deficiencies regardless of the SRP.
Then, a total of 860 initial inspections data of Kuching Port were analysed in order to generate another three rules. The generated rules show the relationship between ships of the LRS category as well as ships registered in Singapore and Panama to the number of deficiencies raised during the inspection. It can be observed that ships of the LRS category entering this port were inspected with zero deficiency, which is proven by the highest lift score. Similarly, ships registered in Singapore and Panama inspected at this port were free from any deficiencies. As for Port Kelang, the value of confidence in the analysis was reduced to 50% to gain an interesting rule. Five (5) rules were generated consist of two (2) different patterns related to ‘Deficiency = zero’ and ‘Deficiency = low’. At Port Kelang, it can be observed that ships registered in Vietnam and ships under the HRS category raised on average 1 to 5 deficiencies during inspections whereas ships under the LRS category raised zero deficiency. Similar findings can be observed for ships from Singapore and Panama calling to Port Kelang where no deficiency was raised by the inspector on-board.
Lastly, four rules were generated from this data which reveal the relationship between deficiency, SRP, and flag at Lahad Datu port. Ships under the Panama flag and categorised as LRS entering this port were most likely to be inspected without any deficiencies. Furthermore, any ships in the category of LRS calling to this port did not raise any deficiencies during the inspection. Similarly, the inspectors did not raise any deficiencies for ships registered in Panama and Marshall Island, calling at this port.
After reviewing the analysis of major ports, it can be observed that the flag, SRP, and the number of deficiencies are related. However, different ports reveal different rules. For instance, the foreign-registered ship from Hong Kong, China, Singapore, Vietnam, Panama, and Marshall Island seems to be a low-risk ship that visited this port. Whereas, Penang Port receives an LRS ship from Singapore. Therefore, recognizing the PSC inspection pattern at individual ports is crucial in enforcing maritime regulations, especially for port and harbor officers. Conveying that information will support the authority to implement an effective inspection plan.
6. Conclusions
The Tokyo MoU database is an integrated information system that consists of significant information that is useful for the analysis of PSC inspection. Performing the mining association learning for PSC inspection in order to investigate the potential relationship between the various ports of inspection, flag states, quantity of deficiencies raised, detention result, and the category of a ship under the New Inspection Regime (NIR) is important to enhance maritime safety in Malaysian waters. This work proposed to use the association rule with Apriori algorithm to analyse the practices in PSC inspections.
The inspection pattern in Malaysian ports was revealed by mining the PSC data using five years of historical data from 2015 to 2019. Maritime authorities are the primary actor in the enhancement of maritime safety in Malaysia. In this paper, interesting rules for association mining were analysed, followed by recommendations of further actions to improve maritime safety. For instance, in some cases, an experienced inspector is needed to adequately allocated at specific ports, especially in the case of a high-risk ship. An inspection team with different maritime knowledge may deem necessary to expedite the decision process onboard, mainly when dealing with a problematic situation (Ravira and Piniella Citation2016). Furthermore, knowledge discovery in this study can be utilized in enhancing the ship targeting system to help the inspector in selecting the vessel for inspection. Also, providing that treasured info to the port officer help them to strategize the inspections at their ports.
Hence, the valuable information revealed from the findings will assist the port authorities in Malaysia in controlling the ships calling at their ports as well as to improve the safety of Malaysian waters from maritime incidents and marine pollution. Maritime players such as ship owners, ship managers, and ship agents can also utilise the information to ensure their ships’ compliance with national and international requirements, which subsequently prevents the detention of their ships. However, based on the findings of this paper, the answer to the following questions remains unclear: ‘Are PSC inspections in Malaysian ports too lenient? Are the ships calling to the Malaysian water seaworthy?’.
Therefore, further improvements to this study will focus on the mining of the PSC database, taking into account the pattern of the findings raised by the PSC officer and other factors that are related to the PSC inspection. These are factors such as the age of the ship, classification society, and gross tonnage. Furthermore, this research is limited to Malaysian ports only and may not apply to other countries. Hence, a comparative study can be conducted by other state members by using this research model to discover a variety of rules and other exciting issues.
Acknowledgments
The authors gratefully thank the anonymous reviewers and editors for their comments and suggestions. However, the authors are solely responsible for all the views and analyses in the paper.
Disclosure statement
No potential conflict of interest was reported by the authors.
References
- Bhatt, U., and P. Patel. 2015. “A Novel Approach for Finding Rare Items Based on Multiple Minimum Support Framework.” Procedia Computer Science 57: 1088–1095. doi:https://doi.org/10.1016/j.procs.2015.07.391.
- Cariou, P., M. Q. Mejia, and F. C. Wolff. 2008. “On the Effectiveness of Port State Control Inspections.” Transportation Research Part E: Logistics and Transportation Review 44 (3): 491–503. doi:https://doi.org/10.1016/j.tre.2006.11.005.
- Chen, J., S. Zhang, X. Lang, Z. Wan, Y. Fei, and T. Zheng. 2019. “Identification of Key Factors of Ship Detention under Port State Control.” Marine Policy 102: 21–27. doi:https://doi.org/10.1016/j.marpol.2018.12.020.
- Cheung, Y. L., and A. W. C. Fu. 2004. “Mining Frequent Itemsets without Support Threshold: With and without Item Constraints.” IEEE Transactions on Knowledge and Data Engineering. doi:https://doi.org/10.1109/TKDE.2004.44.
- Chung, W.-H., S.-L. Kao, C.-M. Chang, and -C.-C. Yuan. 2020. “Association Rule Learning to Improve Deficiency Inspection in Port State Control.” Maritime Policy & Management 47 (3): 332–351. doi:https://doi.org/10.1080/03088839.2019.1688877.
- Dahbi, A., Y. Balouki, and T. Gadi. 2018. “Using Multiple Minimum Support to Auto-Adjust the Threshold of Support in Apriori Algorithm.” Advances in Intelligent Systems and Computing. doi:https://doi.org/10.1007/978-3-319-76357-6_11.
- Emecen Kara, E. G., and O. Oksas. 2016. “A Comparative Analysis of Regional Agreements on Port State Control.” American Scientific Research Journal for Engineering, Technology, and Sciences (ASRJETS) 18: 259–270.
- Hahsler, M., and S. Chelluboina. 2011. “Visualizing Association Rules: Introduction to the R-Extension Package ArulesViz.” R Project Module 223–238.
- International Maritime Organization. 2017. “Procedure for Port State Control, 2017.” http://www.imo.org/en/KnowledgeCentre/IndexofIMOResolutions/Assembly/Documents/A.1119%2830%29.pdf
- International Maritime Organization. “Port State Control.” http://www.imo.org/en/OurWork/MSAS/Pages/PortStateControl.aspx
- Jihong, C., W. Zhang, L. Sifan, F. Zhang, Y. Zhu, and X. Huang. 2018. “Identifying Critical Factors of Oil Spill in the Tanker Shipping Industry Worldwide.” Journal of Cleaner Production. doi:https://doi.org/10.1016/j.jclepro.2017.12.238.
- Kuo, R. J., C. M. Chao, and Y. T. Chiu. 2011. “Application of Particle Swarm Optimization to Association Rule Mining.” Applied Soft Computing Journal. doi:https://doi.org/10.1016/j.asoc.2009.11.023.
- Mansell, J. 2009. “Port State Control in the Asia-Pacific Region: Issues and Challenges.” Australian Journal of Maritime and Ocean Affairs 1 (3): 73–87. doi:https://doi.org/10.1080/18366503.2009.10815641.
- Rakesh, A., T. Imieliński, and A. Swami. 1993. “Mining Association Rules between Sets of Items in Large Databases.” In. doi:https://doi.org/10.1145/170035.170072.
- Ravira, F. J., and F. Piniella. 2016. “Evaluating the Impact of PSC Inspectors’ Professional Profile: A Case Study of the Spanish Maritime Administration.” WMU Journal of Maritime Affairs 15 (2): 221–236. doi:https://doi.org/10.1007/s13437-015-0096-y.
- Tsou, M.-C. 2019. “Big Data Analysis of Port State Control Ship Detention Database.” Journal of Marine Engineering and Technology 18 (3): 113–121. doi:https://doi.org/10.1080/20464177.2018.1505029.
- Wang, S., R. Yan, and X. Qu. 2019. “Development of a Non-Parametric Classifier: Effective Identification, Algorithm, and Applications in Port State Control for Maritime Transportation.” Transportation Research Part B: Methodological 128: 129–157. doi:https://doi.org/10.1016/j.trb.2019.07.017.
- Xiao, Y., G. Wang, K. C. Lin, Q. Guanqiu, and K. X. Li. 2020. “The Effectiveness of the New Inspection Regime for Port State Control: Application of the Tokyo MoU.” Marine Policy. doi:https://doi.org/10.1016/j.marpol.2020.103857.
- Yang, Z., Z. Yang, J. Yin, and Z. Qu. 2018a. “Realising Advanced Risk-Based Port State Control Inspection Using Data-Driven Bayesian Networks.” Transportation Research Part A: Policy and Practice 118: 477–495. doi:https://doi.org/10.1016/j.tra.2018.01.033.
- Yang, Z., Z. Yang, J. Yin, and Q. Zhuohua. 2018b. “A Risk-Based Game Model for Rational Inspections in Port State Control.” Transportation Research Part E: Logistics and Transportation Review. doi:https://doi.org/10.1016/j.tre.2018.08.001.