
ABSTRACT
Affected by climate and natural conditions, cruise activities have obvious seasonal characteristics. For a cruise ship, seasonality consists of the systematic, although not necessarily regular, movement of a cruise ship in a selected time. To examine more specifically the natural factors of the seasonal characteristics from a microscopic perspective, we construct month-temperature, quarter-season, and year-climate zone, a seasonal analysis framework in two dimensions of space and time and using a single world cruise ship named Queen Elizabeth (QE) as the case. Comparing the characteristics of the trajectory network with the seasonal factors, we find the cruise ship tend to voyage in a stable temperature range of 10°C–20°C, flee the winter and catch up with the summer and spring, and mainly stay in the temperature maritime climate zone, the subtropical monsoon humid climate zone, and the Mediterranean climate zone to form several branch network. Finally, the academic and practical implications of the research findings for seasonal management and itinerary choice are elaborated from the supply-side and demand-side.
1. Introduction
In the 1960s, the modern cruise industry was born and since then cruise tourism has become the fastest-growing segment of the global tourism industry and a symbol of global tourism (Wood Citation2000; Sun, Jiao, and Tian Citation2011). Worldwide, the cruise industry has an annual passenger compound annual growth rate of 6.63% from 1990 to 2018, see Cruise Market Watch (Citation2020). The rapid development of cruise tourism is achieved through a combination of supply and demand. Cruise passengers determine the demand for cruise products, while cruise companies and port authorities determine the supply of cruise products (Brida and Zapata-Aguirre Citation2009; Gui and Russo Citation2011). However, Seasonality is one of the main aspects affecting tourism, as mentioned by Amelung, Nicholls, and Viner (Citation2007), Cuccia and Rizzo (Citation2011). The demand and supply of the cruise industry also reflect obvious seasonality (Charlier Citation1999; Charlier and Mccalla Citation2006; Rodrigue and Notteboom Citation2013; Sun, Yip, and Lau Citation2019).
The cruise market has formed obvious the low season and high season affected by seasonality. Some markets are year-round, such as the Caribbean, the Mediterranean, and the Asian market, which are major cruise regional markets (Sun, Feng, and Gauri Citation2014; Jeronimo and Antonio Citation2017; Jeon, Duru, and Yeo Citation2019). Some markets are seasonal, including Alaska, the Northeast Atlantic, and Australia/New Zealand, etc, which are only serviced during their summer months (Rodrigue and Notteboom Citation2013; Jeronimo and Antonio Citation2019). Besides, Different markets are seasonal complementarities, because cruise ships can be moved seasonally from one cruise area to another (Charlier Citation1999; Charlier and Mccalla Citation2006; Rodrigue and Notteboom Citation2013). This is also happening in year-round markets. The seasonal factor is significant in the geography of cruising.
Seasonality is one of the most important characteristics of cruise voyage and plays a crucial role in the development of the cruise industry (Pallis Citation2015; Sun, Wu, and Feng Citation2015). Generally speaking, seasonality can be described from many angles. For example, the demand of tourists (consumer preferences, revenue, leisure time, etc), the supply of hotels (location, service, etc), which are tourism economy (Rossellò-Nadal, Riera, and Rossello Citation2004; Spencer and Holecek Citation2007). However, from the perspective of transport geography, for a single cruise ship, seasonality consists of the systematic, although not necessarily regular, movement of a cruise ship in a selected period, usually the year, which could be seen as a most direct micro-expression (Hylleberg Citation1992).
Given this, this paper attempts to analyze the seasonal characteristics of the cruise trajectory, using a single cruise ship as a case study. In our approach, the seasonality of the cruise ship is analyzed by building a multi-dimensional seasonal analysis framework, mainly in terms of natural factors, in the transport geography analysis paradigm. To a certain extent, this can expand the research perspective and method of transport geography, also can be viewed as a microscopic examination of the nature and contents of the cruise movement.
This paper is structured as follows. Following on from the Introduction, Section 2 presents a literature review that covers the usage of trajectory. The cruise seasonal framework is described in Section 3, as well as the principle of case selection. In Section 4, the results of the analysis for a case, which includes the structural properties of the cruise trajectory network and the spatial-temporal seasonality characteristics, are presented. Concluding remarks are given in the final section.
2. Literature review
The trajectory data represent the original ship’s trajectory data which cover the time and space domains. Research-based on trajectory data has traditionally been the preserve of transportation geography and the transportation engineering fields and enables an analysis of the ship’s navigation path. It provides a good reference for revealing socio-economic activities and the laws which control human travel. In the context of transportation, trajectory data are used to analyze movement patterns in subway systems, taxi journeys, air transportation, and navigation. Similar research has also been performed by Huang et al. (Citation2018), Burghouwt and Hakfoort (Citation2001), Liu et al. (Citation2012), Notteboom (Citation2004). Much progress has been made, but some deficiencies ignore the differences and dynamic variability of individual units. Based on an analysis of the ship’s trajectories in maritime shipping, there have been studies on container ships. But the operations research is more ‘detailed’ when focusing on vessel trajectories compared with social sciences that focus on aggregated flows, Notteboom, for instance, is more ‘social sciences’ and does not look at individual trajectories (Notteboom Citation2004). Ducruet and Notteboom (Citation2012) analyzed the global container shipping network and confirm the impact of global trade and logistics transfers on the port hierarchy. At the same time, research shows that such changes are mainly geographical. Fraser, Notteboom, and Ducruet (Citation2016) analyzed changes in the peripheral and remote levels of the South African container port system as part of the global container shipping network. They pay more attention to the port scale, which belongs to the analysis of the nodes of trajectory.
The dynamics of the cruise industry are reflected in the literature related to cruise ships, and we have seen a rapid growth of cruise-related research between 1983 and 2009 (Papathanassis and Beckmann Citation2011). The literature on cruise ships between 2010 and 2014 increased at a rate of approximately 10 publications per year (Marcussen Citation2016). In cruise research, the trajectory has been widely used. Most works of literature come from social sciences rather than geographic science, especially the field of economic management.
(1) Analyzing different cruise itineraries and economic benefits by trajectories. A cruise itinerary is a part of the cruise movement trajectory, but not whole. Lee and Ramdeen (Citation2013) analyzed 15 different cruise lines operating in the Caribbean, Bahamas, Bermuda, etc. They found that the travel route has a significant impact on cruise occupancy. Li and Kwortnik (Citation2016) proposed a new classification method that used consumers’ perception of their travel experience to classify cruise lines. Young, Suhyung, and Hyosoo (Citation2017) analyzed the efficiency of cruise routes based on the data envelopment analysis (DEA) model network.
(2) To evaluate the scope of the cruise market and the connections between the markets. From a geographical perspective, the cruise market tends to exist in certain areas where the cruise trajectories are densely distributed. Therefore, the trajectory is the basis for the study of the cruise market. the global nature of cruise tourism and the contact between cruise markets, even the development of the cruise market could be verified and answered by the cruise trajectory (Charlier and Mccalla Citation2006; Robbins Citation2009; Rodrigue and Notteboom Citation2013).
(3) Describing the seasonal characteristics. Charlier and Mccalla (Citation2006) found the seasonal factor was crucial in the geography of cruising when comparing the first and third quarters. Rodrigue and Notteboom (Citation2013) provided a conceptual framework on ship schedules, and offered an analysis of existing itineraries in the Caribbean and the Mediterranean cruise markets, found that the two round-year cruise markets are not functioning independently but are interconnected. This indicates that the two markets are not strictly year-round markets. The movement of cruise ships is to cope with variations in seasonal demand among the regional markets. Jeronimo and Antonio (Citation2019) yield many destination regions were interconnected in the deployment of vessels throughout the year and found the seasonality pattern of cruise destinations was conditioned by the seasonality patterns of other neighboring destination regions. These are important to understand the seasonal geographical patterns of the world cruise industry but less microanalysis.
In summary, based on the ship’s trajectory, many pieces of research can be addressed, but this literature review shows that researches concerning cruise trajectories are incomplete, more micro studies in economics or management, while less in geography. Besides, seasonal factor is crucial in the geography of cruising, but the major seasonality studies concern to the influence of seasonality on the cruise market and industry, and fewer pay attention to the internal relationship between the moving trajectory of cruise ships and natural factors, including temperature, climate, etc. There may be for the following reasons. First, it is difficult to quantify so many seasonal factors. Second, the movement of cruise ships is very flexible and lacks data.
3. Research design
3.1. A seasonal framework of cruise geography
Different causes of seasonality are in the cruise industry. In general, compared with cultural, institutional, and other social factors, the seasonal impact of natural causes is more prominent, which are beyond the control of decision-makers, and brings about difficulties for consumers, business operators, and the settings in which they operate (Cuccia and Rizzo Citation2011; Chen and Pearce Citation2012). So many natural causes are significantly dependent on climate and nature conditions, including sunlight, rainfall, wind, etc, which are harder to measure because of the contingency of different periods (Sun, Yip, and Lau Citation2019). In contrast, the temperature (average temperature) of a region, the alternations of seasons, and the climatic zones are relatively stable and fixed. They can be used to reflect the spatial nature of the region.
In economy, management, and tourism research, month or quarter, as well as the year, are important units of time observation (Chang et al. Citation2016; Valadkhani, Smyth, and Worthington Citation2017; Rossello and Sanso Citation2017). Meanwhile, in geography study, they are seen as very significant scale differences of time (Marti Citation2004; McCalla and Charlier Citation2006).
Based on spatial seasonal factors and time scale differentiation, we construct a primary seasonal analysis framework of cruise geography. As shown in , the cruise port is the basis for connecting spatial and temporal dimensions. Among them, the temperature is quantified every month, the season is considered mainly in the quarter, and the climate zone is concerned in the year. Under this, we can study the cruise trajectory and seasonal law from three levels.
Figure 1. A seasonal framework of cruise geography
3.2. Principle of case selection
The seasonal study concerns the analysis of the trajectory of a cruise ship. Thus, the first consideration in the selection of a sample cruise ship, and the screening of this sample should be scientifically sound. Based on the characteristics and trends of the global ocean cruise industry and the annual evaluation data in the ‘Belize Cruise Guide’, ship selection for this study was based on four considerations: stability, integrality, globality, and diversity (Wood Citation2000; Rodrigue and Notteboom Citation2013).
Integrality: Emphasizing a cycle on a time scale. The cruise trajectory should be within a limited time interval that is a full cycle, such as one year. Generally speaking, for cruise trajectory, a full cycle is usually not January to December in one year, instead, April–May of one year to April-May of the following year (McCalla and Charlier Citation2006; Pallis Citation2015).
Stability: It is emphasized that a cruise ship has formed a relatively stable traditional voyage which is relatively mature after a long time, although the itinerary choice of the cruise ship is very flexible (Marti Citation2004; Pallis Citation2015).
Globality: It is emphasized the space scope, more regions, and more cruise ports. The cruise trajectory should be on a large spatial scale. In other words, the cruise trajectory can’t be just one region, while should be as global as possible so that cruise ships can sail in more different space regions, using more cruise ports, which is conducive to analyze the change of trajectory network and spatial seasonal factors. Therefore, this kind of cruise should be the world cruises that sailing round-the-world. Charlier and Mccalla (Citation2006) also insisted that deploying cruise ships on a global basis is very much an art, rather than a science. This indicates the unique charm of the world cruise.
Diversity: Highlighting the spatial differentiation of the region. The regions that the cruise track should be different, such as different regional markets in different longitudes and dimensions, or in the southern and northern hemispheres (Marti Citation1990).
4. Case studies
4.1. Trajectory network
Based on these principles, firstly, we identify cruise lines and cruise ships that have been engaged in the world cruising from 2010 to 2019, and these include Princess Cruises, Cunard Cruises, Regent Seven Seas Cruises, P&O Cruises, Seabourn Cruises, Azamara Cruises, and Silversea Cruises, of which 26 cruise ships are available for selection. Further, comparing the attributes and itineraries between the cruise ships, Queen Elizabeth (hereafter referred to as ‘QE’) of Cunard Cruises, a company with a history of 178 years in the shipping business, is chosen as the sample. Among these cruises, the QE cruises officially replaced Queen Elizabeth 2 in 2010 and became the first cruise ship to carry out continuous maritime navigation for longer than 360 days. The QE cruise itinerary has been relatively stable over the past 8 years. The general cruise cycle for QE begins in April–May of each year and ends in the following April-May. Therefore, the time for this study was also 12 months and the period was between April 2019 and April 2020.
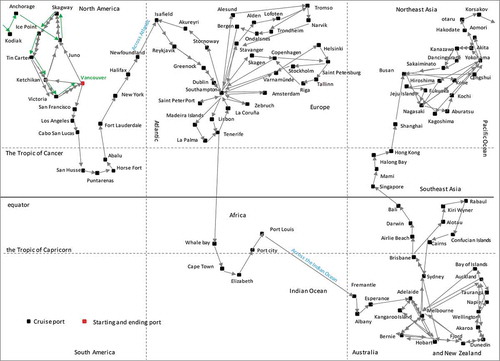
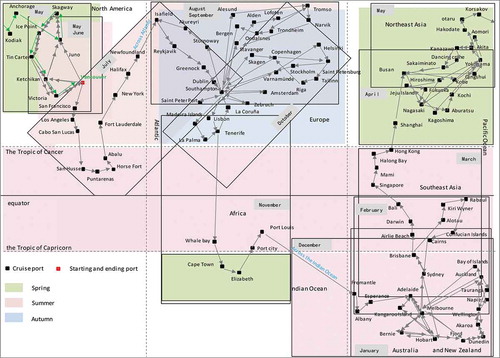
shows the unbroken trajectory network of QE. (1) From the perspective of the cruise port, the QE starts from the homeport of Vancouver, undertakes the year-long voyage around the world visiting 107 ports, and arriving back at Vancouver the following year. There are 31 ports in the Southern Hemisphere, and 76 ports in the Northern hemisphere. The ratio of ports in the Southern hemisphere to that in the Northern hemisphere is 1:2.5. This indicates that more cruise ports are used in the Northern hemisphere. (2) Concerning the cruise market region, the QE connects North America, Europe, Africa, Oceania, Asia, the Atlantic Ocean, the Indian Ocean, and the Pacific Ocean via coastal ports, covers Northwest Europe, North America, the Caribbean, Australia, New Zealand, Northeast Asia, and Southeast Asia market regions, but does not involve the Mediterranean, South America, the Middle East, and Polar regions. The cruise trajectory covers 29 itineraries, including Alaska itinerary, Nordic-Baltic itinerary, Australia-New Zealand itinerary, etc. This reflects the globalization and diversification of voyaging.
Figure 2. The trajectory of the QE
4.1.1. Trunk network
The trajectory network of QE can be divided into trunk network and branch network (Marti Citation2004; McCalla and Charlier Citation2006). As shown in . The trunk network for the QE consists of 53 ports, 15 in the Southern hemisphere, and 38 in the Northern hemisphere, with the ratio of ports in the northern and southern hemisphere being about 1:2.5. In terms of the spatial evolution of the cruise trajectory, the cruise trajectory is from west to east, which is consistent with the direction of the earth’s rotation. However, from the longitude and latitude changes corresponding to the trajectory evolution, the trunk trajectory network for the cruise corresponded to a type of alternating ‘V’ shape, spanning 69°N ~ 45°S, rather than simply heading in one direction. Such a zigzag moving route, compared with a straight line, is a manifestation of the diversity of cruise trajectory.
Figure 3. The trunk network of cruise trajectory
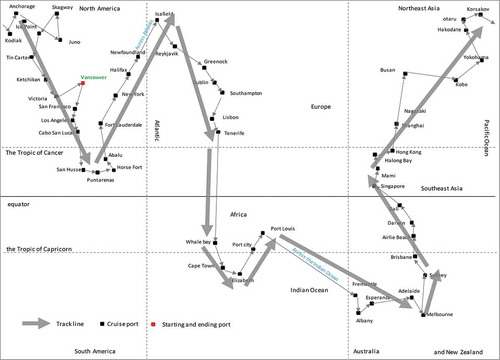
Figure 4. The branch network of cruise trajectory
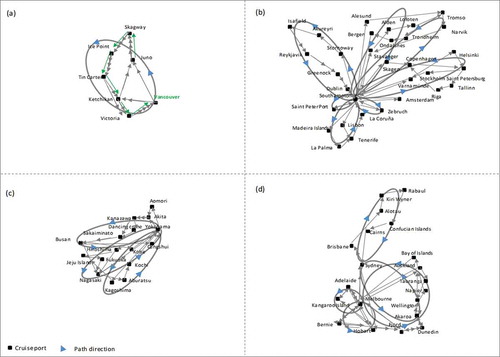
4.1.2. Branch network
As shown in , this study has identified four branch networks in the cruise trajectory network. Three of the four regional branch networks are distributed in the northern hemisphere and only one in the southern hemisphere, but the characteristics and organizational patterns of them are different. This adequately indicates the diversity of trajectory in different regions.
Single-cycle network: It is a cycle trajectory formed by a single homeport as the center. The North American network is a single-cycle network that is primarily located in the Alaska itinerary area of North American. The cruise ship starts from the homeport of Vancouver, voyages north by using 7 ports of call, and returns to Vancouver again at last. The duration of the round-trip itinerary is about 7 days and the cruise keeps voyaging here for 40 days.
Single-core radiating network: With a homeport as the center, plenty of ports of call are used by the QE to form several cycle trajectories. The trajectory of the QE forms the complex network in the European market area, which centers on the homeport of Southampton, England, forms nine round-trip itineraries that are different from each other by using 31 regional ports of call. The average duration of every itinerary is about five days, but the cruise stayed in Europe for 87 days.
Single-core fan network: It is a loop network that is formed by a cruise ship centered on a homeport in a non-geographic center in the region and extending outwards. The Northeast Asian network with Yokohama as the homeport is a single-core fan network. It includes 16 ports of call and forming 6 round-trip itineraries networks and of duration 35 days. In Northeast Asia, the port of Yokohama is located on the east coast of Honshu Island, Japan, and links with other cruise ports in a northwest or southwest direction.
Multi-core extension network: It refers to a cruise ship that relies on several homeports in the region and uses the surrounding ports of call to form several loop trajectory networks. The trajectory of QE in Australia presents a multi-core regional network based on Sydney, Melbourne, Perth, Brisbane, and Auckland serving as homeports. The multi-core extension network in Australia has a duration of 81 days, including 17 round-trip itineraries.
4.2. Average monthly temperature
In this section, we first analyze the cruise trajectory based on a monthly time basis and note the number of ports in the different months and the longitude and dimensions of the port. Then we use the monthly benchmark to calculate the minimum and maximum temperatures at the various cruise ports every month and calculate the average temperature to examine the time and space characteristics of the cruise trajectory. The seasonal characteristics of the cruise trajectory every monthly are illustrated in .
Figure 5. Distribution characteristics of dimensionality and temperature for the trajectory network
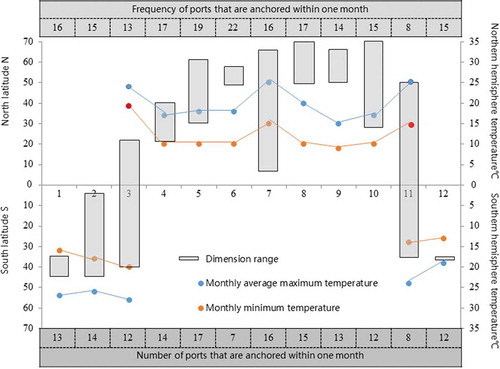
(1) The QE sails in the Northern hemisphere from April to October, and sails in the Southern hemisphere from December to March in the following year. The ratio of sailing time between the Southern hemisphere and the Northern hemisphere is 1:1.4, which indicates that the QE sails in the Northern hemisphere for more of the time. In different months, the locations of the cruise trajectory and the temperature of the corresponding areas are different. In May and June, the cruise trajectory is concentrated around 30°N–60°N and 122°W–150°W, mainly in the Alaska region of North America. The average monthly temperature is between 10°C and 18°C. The cruise trajectory is concentrated in the range 28°N–170°N and 10°E–124°W from August to October, especially in the British Isles, Northern Europe, and Western Europe. The average monthly temperature is between 9°C and 20°C. The cruise trajectory is concentrated in the range 4°N–145°S, 144°E–175°E from December to March, in Australia and New Zealand and the South Pacific regions. At this time, the average monthly temperature is between 13°C and 28°C. The cruise trajectory converges to 22°N–160°N and 126°E–140°E in April and May, mainly in Japan and South Korea in Northeast Asia, with an average monthly temperature between 10°C and 18°C.
(2) In March and November, the QE sails in the Atlantic Ocean, the Indian Ocean, and the Pacific Ocean. The QE passes the Panama Canal in July and then sails across the Atlantic Ocean via the Caribbean to the European homeport of Southampton. In November, the QE sails directly south from Southampton, crossing the equator and then on to ports in southern Africa, before crossing the southern Indian Ocean and arriving in December at Fremantle, a port in western Australia. In March, the QE returns to the Northern Hemisphere and docks at the ports in South East Asia, including Bali and Singapore. In this time, the ship of QE uses fewer ports, which is mainly distributed in tropical regions, so the temperature of the port area is generally above 20°C.
In general, the QE sails in different areas in different months, but from the temperature of the cruise port location, when these ports are used, the average temperature concentrates in the range of 10°C–20°C.
4.3. Season evolution
The seasonal characteristics of the cruise trajectory as described above are based on a monthly timescale. To reflect on the characteristics and laws of motion for the cruise on a larger timescale, we do the analysis on a season scale.
(1) As shown in , the trajectory of the QE has clear seasonal changes. Whether in the northern or the southern hemisphere, the cruise is in spring, summer, and autumn, forming the seasonal evolution of spring–summer–autumn–summer–spring–summer–spring, without winter. Clearly, the season change reflects the cruise ship fleeing the winter and catching up with the spring and summer.
Figure 6. Seasonal differentiation of cruise network trajectories
(2) The QE has different voyage durations in different seasons. The voyage duration in summer is the longest. The time spent sailing in the summer accounts for more than 50% of the total sailing time, and sailing in the southern and the northern hemisphere shipping areas are at least 3 months respectively. Although sailing near the equator always corresponds to summer, the cruise does not stay in this area for a long time. The location of the cruise trajectory in spring and autumn shows that the ship will temporarily dock at Port Elizabeth (South Africa) in the spring. The other trajectories are located in the northern hemisphere, between 30°N and 60°N, and concentrated in Alaska, Europe, and Northeast Asia.
(3) Considering the seasonal attribute of the main cruise market regions, the QE only sails in the summer months in Australia. After that, it sails to the Northeast Asia area in the late spring and early summer, while the Alaska area and the Northeast Atlantic area are mainly in the summer. In Europe, it sails in summer and autumn. Therefore, the seasonal evolution of the cruise trajectory is related to the nature of the regional market. Alaska, the Northeast Atlantic area, and Australia are seasonal markets, only service in summer. Europe, especially the Mediterranean and its adjoining seas, service all year round, but summer and autumn (May-October) are high seasons (Rodrigue and Notteboom Citation2013; Pallis Citation2015). The QE tends to sail in a certain region during high season or before, and the same as the next region, indicating that the seasonal organization and evolution of the cruise trajectory in different regions is based on high season.
4.4. Global climate zone
The seasonal characteristics of the cruise trajectory network reflect the laws of motion for the single cruise at different timescales. In fact, within a certain region, despite all ports experiencing the same season, the climate types may be different because of regional differences. As a result of this, the study classifies each cruise port into the appropriate climatic zone according to the distribution of the global climatic zones to investigate the seasonal differences for each region.
shows the distribution of climate zones for the cruise trajectory network. Based on the geographical distribution of the ports where the QE docks, the cruise voyages through 10 major climatic zones, including the temperate maritime zone, the Mediterranean climate zone, the temperate continental climate zone, the temperate monsoon climate zone, the subtropical monsoon humid zone, the tropical rainforest climate zone, the tropical monsoon climate zone, the savanna climate zone, the tropical desert climate zone, and the polar climate zone.
Figure 7. The cruise network trajectory and the distribution of global climate zones
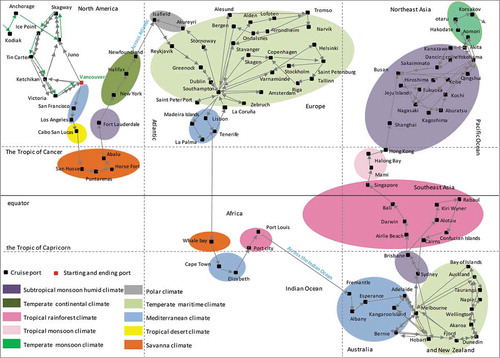
(1) The number of cruise ports in the various climatic zones is different. The number of cruise ports in the temperate maritime climate zone is 45, which is the largest, accounting for 42.1% of the total. Twenty ports are the subtropical monsoon humid climate zone, accounting for 8.7% of the total. There are 14 ports in the Mediterranean climate zone, representing 13.1% of the total. The cruise ports covered by these four climatic zones account for 63.9% of the total number of ports.
(2) Although the trajectory of the cruise passes through 10 different climatic zones, five climatic zones belong to the temperate climatic zone, that is, the temperate maritime zone, the Mediterranean climate zone, the temperate continental climate zone, the temperate monsoon climate zone, and the subtropical monsoon humid zone. In these climatic zones, the number of ports accounts for 81.3% of the total. Four climatic zones are belonging to the tropical climate zone, including the tropical rainforest climate zone, the tropical monsoon climate zone, the savanna climate zone, and the tropical desert climate zone. The number of ports, within these climatic zones, account for 17.8% of the total. Only two cruise ports in the polar climate zone. This analysis shows that although the trajectory of the QE involved the crossing of multi-climate zones, the cruise trajectory is mainly concentrated in the temperate climate zone, followed by the tropical climate zone.
Based on the comparison, we continue to summarize the types of climatic zones at different scales. shows the corresponding relationships among climatic zone, season, and month, and three types of the climatic zone can be divided:
Table 1. Climate zones and seasonal attributes for the cruise trajectory network
Major climatic zone: The temperate maritime climate, the subtropical monsoon humid climate, and the Mediterranean climate zone are the major types, especially the temperate maritime climate, which is generally mild and moist all year round. The QE spends more time in these climatic zones. these climatic zones, accounting for 70% of the time and including spring, summer, and autumn, also forming four different branch networks.
Secondary climate zone: These climatic zones mainly are tropical and frigid climate zones, which involves the tropical monsoon climate zone, the savanna climate zone, the polar climate zone, the tropical desert climate zone, the temperate monsoon climate zone, and the temperate continental climate zone. The number of ports of call within each climatic zone is typically 2–3. Cruise ship voyage through here mostly in the summer and the duration is shorter.
Transitional climate zone: This climate type is mainly the tropical rainforest climate zone in Indonesia. Here is a high temperature, changeable weather and all year round in summer. The cruise ship is bound to pass through this climate zone when voyage between the northern and southern hemispheres, but it doesn’t choose to stay for a long time. Therefore it is regarded as the type of interim that is necessary.
5. Conclusions and discussion
The seasonality of the cruise industry can be presented from a variety of perspectives. The goal of this study was to survey the seasonality of natural factors by the trajectory of a single cruise ship. Therefore, we construct a seasonal analysis framework influenced by natural factors in two dimensions of space and time and choose the Queen Elizabeth world cruise as a case sample.
In our case study, it clearly shows that the average monthly temperature indicates no matter which region the ship voyage, the local temperature is maintained at 10°C–20°C, which is the temperature range for passengers to feel comfortable. There are instances when the temperatures experienced are lower than 10°C or higher than 29°C, but these are relatively less. For the seasons, the cruise only voyages in spring, summer, and autumn in a region. In the summers and springs of the southern and northern hemispheres, the QE offers over 80% of flights in a cycle (usually one year), and the time sailing in the part of summer takes up more than 50%, forming four main branch networks. From the perspective of climate zone, the trajectory of the cruise ship passes through 10 climatic zones, and the temperate climatic zones are the major ones, especially the temperature maritime climate zone, the subtropical monsoon humid climate zone, and the Mediterranean climate zone, which are also the concentrated distribution areas of the branch network.
5.1. Seasonality and cruise supply
Cruise trajectory is the geographical location of cruise operation, which reflects the seasonal laws under the perspective of cruise supply. The QE cruising in different seasonal factors is the result of pursuing maximization profits for a company. Also, the specific location of the QE shows two different characteristics in supply shown in .
Figure 8. Seasonal influence mechanism from the perspective of supply and demand
From a regional perspective, the QE takes a longer time to voyage in the major climatic zones, including the temperature maritime climate zone, the subtropical monsoon humid climate zone, and the Mediterranean climate zone, to organize the itineraries and flights, in summer or spring, forming the branch network. Summer or spring in these climates is a high season for travel. Besides, in these climatic zones, physical and human resources are superior, including dense distribution of ports, numerous cruise homeports, rich port cities, high level of economic development, developed shipping industry, large source market, and rich tourism resources in the port hinterland, etc. In these seasons and climatic zones, the QE offers 76% of short itineraries. The characteristic of these itineraries is that the duration is shorter, generally around 7 days, and the number of round-trip itineraries is more. The homeports are Southampton, Vancouver, Yokohama, Sydney, etc.
For a world cruise ship, cruising in different areas is a race against the seasons, because it is constantly chasing summer, spring, and get rid of winter to be always in high seasons. Meanwhile, due to the spatial distribution of the major climate zones, the cruise ship often needs to voyage through a secondary or transitional climate zone when it travels from one major climate zone to another. Most ports of the trunk network are distinctive and exotic destinations, in different climatic zones and seasons. The homeports are New York, Fort Lauderdale, Singapore, Shanghai, etc. However, the cost of organizing the itinerary is higher, because the voyage distance between different ports is large. The itinerary of duration is longer, generally more than 14 days, and most of them are one-way. To attract more passengers, Long itineraries usually be divided. Besides, the cruise line will also offer discounts, including higher quality service and a variety of activities onboard (Sun, Wu, and Feng Citation2015). However, more spending on board and return airfare will increase the costs of passengers.
5.2. Seasonality and cruise demand
The cruise industry appears fundamentally to be driven by supply, and the cruise ship operators successfully follow a supply push strategy (McCalla and Charlier Citation2006; Rodrigue and Notteboom Citation2013). However, the differentiated operation of cruise lines also indicates the diversified demands of cruise passengers. The QE ship belongs to Cunard Line, a British-American cruise shipping company which chooses a high-end, luxury niche market by offering royal white star service and is primarily aimed at the high-consumption crowd who are at the top of the global cruise pyramid, see PR Newswire (Citation2018). Its source is mainly American and European customers, especially the British, American, Australian, German, French, etc., see Review of Cunard (Citation2020). Customers usually embark or disembark from homeports in Southampton, New York, Fort Lauderdale, Yokohama, Sydney, Vancouver, and more, who are mainly couples from their late 30s to retirees. However, there is enough buzz about it as to attract some young passengers, singles/friends, and families, see Review of Cunard (Citation2020) and U.S. News Best Cruises (Citation2020).
Passengers, choose to travel in the same area and season, have short leisure time. Therefore, they tend to enjoy shorter and round-trip itineraries, most of which are less than 7 days, and some of which are more than a week, but generally less than 14 days. Most may be experiencing cruise ships for the first time, preferring to enjoy voyaging in a stable climate, without changeable weather, and frequently exploring ports in different countries, see Lender Travel (Citation2020).
Passengers who choose to cruise in different areas and seasons not only have high consumption-ability but also have longer leisure time. Most are experienced, loyal, and love sailing, because of may enjoy the cruise more than once (Marianna Citation2017). Comparatively speaking, they are less interested in frequent embarkation and disembarkation to explore different ports. On the contrary, they prefer to spend long leisure time at sea and enjoy high-quality activities and services on board, see Lingard (Citation2002). As a result, they prefer to travel long distances across oceans or even around the world, to experience the unknown and changeable climate of the sea (McCalla and Charlier Citation2006).
5.3. Discussions
The voyage of a world cruise ship is a very complicated process. An overriding macro geographical factor is the world’s climate (McCalla and Charlier Citation2006). The seasonal characteristic and evolution of trajectory reflect the spatial organization characteristics of operation.
(1) Comparing destination tourism, the cruise offers a way of trip tourism, because a cruise is being viewed as floating resorts with restaurants, bars, sports facilities, shopping centers, entertainment venues, communication centers, etc. (Dowling Citation2006). When the people board the cruise ship, the journey is announced, and most time of passenger is spent on the cruise than various activities on land. For world cruises, special servicing is long itineraries. They usually float on the ocean for several days, dock once every few days, especially when sailing across oceans. In this way, Passengers can deeply enjoy the travel experience of leisure and entertainment while sailing.
(2) Cruising is a local warm season experience (McCalla and Charlier Citation2006). As a world cruise ship, the local voyage is only part of the circumnavigation of the globe. However, no matter how it moves, the cruise always voyages in relatively warm waters and stay longer time in ports within temperate climates. Generally, a tourism destination will show the obvious seasonal variations in tourism demand (low season and high season), because of the regional physical and human geography (Rossello and Sanso Citation2017). As a flexible, mobile destination, the cruise can choose to sail in peak seasons of different regions (usually warm) while escaping from the upcoming off-season (usually cold) in these regions. This is the reason why the cruise trajectory shows the seasonal spatial pattern, (temperature, season, climate zone) on a global scale.
(3) Indeed, the trajectory of world cruises are both global and regional (Li, Wang, and Ducruet Citation2020). Before deploying cruise ships in a region, cruise lines consider the factor of customer demand. In other words, even if a region has a suitable temperature and climate, it is difficult to form a large-scale cruise demand without a customer base, and cruise lines will not deploy ships in this region. This could explain why the QE’s trajectory is concentrated in Europe, North America, East Asia, and Australia-New Zealand in different months or seasons.
(4) The cruise trajectory is different from the itinerary, the latter can reflect the change in passengers’ embarkation or disembark from the cruise homeport. Actually, the very long itineraries offered by world cruises are usually divided into several shorter segments in time and space to satisfy the diverse passenger preferences (Charlier and Mccalla Citation2006). Typically, on a world cruise ship, short-trip and long-trip passengers, from different countries, income, age, etc., will cruise together. Therefore, it is necessary for cruise lines to exceed the expectations of each segment equally to satisfy the trip experiences of different passengers, a particularly challenging corporate aspiration (Charlier and Mccalla Citation2006).
(5) Although the space deployment of a world cruise is dominated by the supplier (cruise line), the impact of customer demand is crucial, besides the physical geographical factors, from the perspective of the seasonal spatial distribution of the trajectory. It decided where the ship might go in the next period. In other words, the seasonal complementarity of cruising is oriented by the demand of customers. For example, ships leaving Australia-New Zealand usually voyage to Southeast Asia in March, from Europe will voyage to South Africa or South American in November or December, and from the Mediterranean can voyage to the Caribbean or the Middle East in January, etc. Therefore, the correct judgment of regional cruise demand in different seasons is an important basis for cruise lines to build a global cruise network.
Acknowledgments
The authors would like to thank three reviewers and editor for providing us with constructive comments and suggestions to improve this manuscript.
Disclosure statement
No potential conflict of interest was reported by the author.
Additional information
Funding
References
- Amelung, B., S. Nicholls, and D. Viner. 2007. “Implications of Global Climate Change for Tourism Flows and Seasonality.” Journal of Travel Research 4 (53): 285–296. doi:10.1177/0047287506295937.
- Brida, J. G., and S. Zapata-Aguirre. 2009. “Cruise Tourism: Economic, Socio-Cultural and Environmental Impacts.” International Journal of Leisure and Tourism Marketing 1 (3): 205–226. doi:10.1504/IJLTM.2010.029585.
- Burghouwt, G., and J. Hakfoort. 2001. “The Evolution of the European Aviation Network, 1990—1998.” Journal of Air Transport Management 7 (5): 311–318. doi:10.1016/S0969-6997(01)00024-2.
- Chang, Y. T., H. Park, S. M. Liu, S. M. Liu, and Y. Roh. 2016. “Economic Impact of Cruise Industry Using Regional Input-output Analysis: A Case Study of Incheon.” Maritime Policy & Management 43 (1): 1–18. doi:10.1080/03088839.2015.1086837.
- Charlier, J. 1999. “The Seasonal Factor in the Geography of Cruise Shipping.” The Dock and Harbour Authority 79 (3): 2214–2219.
- Charlier, J. J., and R. J. McCalla. 2006. “A Geographical Overview of the World Cruise Market and Its Seasonal Complementarities.“ Cruise Ship Tourism, 18-30. Wallingford: CABI.
- Chen, T., and P. L. Pearce. 2012. “Research Note: Seasonality Patterns in Asian Tourism.” Tourism Economics 18 (5): 1105–1115. doi:10.5367/te.2012.0163.
- Cruise Market Watch. 2020. “Growth of the Ocean Cruise Line Industry”. Accessed 1 June 2020. https://cruisemarketwatch.com/growth/
- Cuccia, T., and I. Rizzo. 2011. “Tourism Seasonality in Cultural Destinations: Empirical Evidence from Sicily.” Tourism Management 32 (3): 589–595. doi:10.1016/j.tourman.2010.05.008.
- Dowling, R. K. 2006. “The Cruise Industry.” Cruise Ship Tourism, 3-17. Wallingford: CABI.
- Ducruet, C., and T. Notteboom. 2012. “The Worldwide Maritime Network of Container Shipping: Spatial Structure and Regional Dynamics.” Global Networks 12 (3): 395–423. doi:10.1111/j.1471-0374.2011.00355.x.
- Fraser, D. R., T. Notteboom, and C. Ducruet. 2016. “Peripherality in the Global Container Shipping Network: The Case of the Southern African Container Port System.” Geo Journal 81 (1): 139–151. doi:10.1007/s10708-014-9610-6.
- Gui, L., and A. P. Russo. 2011. “Cruise Ports: A Strategic Nexus between Regions and Global Lines—evidence from the Mediterranean.” Maritime Policy & Management 38 (2): 129–150. doi:10.1080/03088839.2011.556678.
- Huang, J., D. Levinson, J. E. Wang, J. P. Zhou, and Z. J. Wang. 2018. “Tracking Job and Housing Dynamics with Smartcard Data.” Proceedings of the National Academy of Sciences 115 (50): 12710–12715. doi:10.1073/pnas.1815928115.
- Hylleberg, S. 1992. Modeling Seasonality. Oxford, UK: Oxford University Press.
- Jeon, J. W., O. Duru, and G. T. Yeo. 2019. “Cruise Port Centrality and Spatial Patterns of Cruise Shipping in the Asian Market.” Maritime Policy & Management 46 (3): 257–276. doi:10.1080/03088839.2019.1570370.
- Jeronimo, E. P., and G. S. Antonio. 2017. “Characteristics and Consequences of the Cruise Traffic Seasonality on Ports: The Spanish Mediterranean Case.” Maritime Policy & Management 44 (3): 358–372. doi:10.1080/03088839.2017.1295326.
- Jeronimo, E. P., and G. S. Antonio. 2019. “Determination of Seasonality Patterns in the Transport of Cruise Travelers through Clustering Techniques.” Journal of Navigation 72 (6): 1417–1434. doi:10.1017/S0373463319000237.
- Lee, S., and C. Ramdeen. 2013. “Cruise Ship Itineraries and Occupancy Rates.” Tourism Management 34 (1): 236–237. doi:10.1016/j.tourman.2012.03.009.
- Lender Travel. 2020. “Repositioning Cruise.” Accessed 2 October 2020. http://www.lindaletravel.com/repositioning.htm
- Li, X. M., C. J. Wang, and C. Ducruet. 2020. “Globalization and Regionalization: Empirical Evidence from Itinerary Structure and Port Organization of World Cruise of Cunard.” Sustainability 12 (19): 7893. doi:10.3390/su12197893.
- Li, Y. W., and R. Kwortnik. 2016. “Categorizing Cruise Lines by Passenger Perceived Experience.” Journal of Travel Research 56 (7): 941–956. doi:10.1177/0047287516674602.
- Lingard, N. 2002. “The Route Less Traveled: Fred Olsen Lines Keeps It Interesting.” International Cruise and Ferry Review, 193.
- Liu, Y., C. Kang, S. Gao, Y. Xiao, and Y. Tian. 2012. “Understanding Intraurban Trip Patterns from Taxi Trajectory Data.” Journal of Geographical Systems 14 (4): 463–483. doi:10.1007/s10109-012-0166-z.
- Marcussen, C. H. 2016. “Quantitative Analyses in Cruise Tourism Studies.“ Cruise Business Development: Safety, Product Design and Human Capital, 251-278. Bremenhaven: Springer.
- Marianna, S. 2017. “Cruise Itinerary Planning.“ Cruise Ship Tourism, 524-545. Wallingford: CABI.
- Marti, B. 1990. “Geography and the Cruise Ship Port Selection Process.” Maritime Policy & Management 17 (3): 157–164. doi:10.1080/03088839000000023.
- Marti, B. E. 2004. “Trends in the World and Extended-length Cruising (1985–2002).” Maritime Policy 28 (3): 199–211. doi:10.1016/j.marpol.2003.09.004.
- MaCalla, R. J., and J. J. Charlier. 2006. “Round-the-world Cruising: A Geography Created by Geography?“ Cruise Ship Tourism, 206-222. Wallingford: CABI.
- Notteboom, T. E. 2004. “Container Shipping and Ports: An Overview.” Review of Network Economics 3 (2): 86–106. doi:10.2202/1446-9022.1045.
- Pallis, T., 2015. “Cruise Shipping and Urban Development: State of the Art of the Industry and Cruise Ports.” International Transport Forum Discussion Papers. OECD Publishing: Paris, France.
- Papathanassis, A., and I. Beckmann. 2011. “Assessing the ‘Poverty of Cruise Theory’ Hypothesis.” Annals of Tourism Research 38 (1): 153–174. doi:10.1016/j.annals.2010.07.015.
- PR Newswire. 2018, “Cunard Cruise Debuted in 2018, an Authentic British Cruise Experience.” Accessed 28 October 2020. https://www.prnasia.com/story/226221-1.shtml
- Review of Cunard. 2020. “Cunard Line’s Cruising Experience.” Accessed 2 October 2020. https://www.cruisemapper.com/cruise-lines/Cunard-31
- Robbins, D. 2009. “Cruising in the Global Economy: Profits, Pleasure and Work at Sea.” Tourism Management 30 (5): 775–777. doi:10.1016/j.tourman.2008.11.001.
- Rodrigue, J. P., and T. Notteboom. 2013. “The Geography of Cruises: Itineraries, Not Destinations.” Applied Geography 38 (3): 31–42. doi:10.1016/j.apgeog.2012.11.011.
- Rossello, J., and A. Sanso. 2017. “Yearly, Monthly and Weekly Seasonality of Tourism Demand: A Decomposition Analysis.” Tourism Management 60: 379–389. doi:10.1016/j.tourman.2016.12.019.
- Rossellò-Nadal, J., F. A. Riera, and A. Rossello. 2004. “The Economic Determinants of Seasonal Patterns.” Annals of Tourism Research 31: 697–711. doi:10.1016/j.annals.2004.02.001.
- Spencer, D. M., and D. F. Holecek. 2007. “Basic Characteristics of the Fall Tourism Market.” Tourism Management 28 (2): 491–504. doi:10.1016/j.tourman.2006.03.005.
- Sun, X., Y. Jiao, and P. Tian. 2011. “Marketing Research and Revenue Optimization for the Cruise Industry: A Concise Review.” International Journal of Hospitality Management 30 (3): 746–755. doi:10.1016/j.ijhm.2010.11.007.
- Sun, X. D., T. L. Yip, and Y. Y. Lau. 2019. “Location Characteristics of Cruise Terminals in China: A Lesson from Hong Kong and Shanghai.” Sustainability 11: 50–56. doi:10.3390/su11185056.
- Sun, X. D., X. Feng, and D. K. Gauri. 2014. “The Cruise Industry in China: Efforts, Progress and Challenges.” International Journal of Hospitality Management 42: 71–84. doi:10.1016/j.ijhm.2014.05.009.
- Sun, X. D., X. R. Wu, and X. G. Feng. 2015. “Cruise Tourism Seasonality: An Empirical Study on the North American Market.” Tourism Tribune 30 (5): 117–126. doi:10.3969/j..1002-5006.2015.05.012.
- U.S. News Best Cruises. 2020. “Traveler Reviews.” Accessed 2 October 2020. https://travel.usnews.com/cruises/cunard-line-292/queen-elizabeth-429/passenger-reviews/
- Valadkhani, A., R. Smyth, and A. Worthington. 2017. “Regional Seasonality in Australian House and Apartment Price Returns.” Regional Studies 51 (10): 1553–1567. doi:10.1080/00343404.2016.1192718.
- Wood, R. E. 2000. “Caribbean Cruise Tourism: Globalization at Sea.” Annals of Tourism Research 27 (2): 345–370. doi:10.1016/S0160-7383(99)00073-0.
- Young, T. C., L. Suhyung, and K. P. Hyosoo. 2017. “Efficiency Analysis of Major Cruise Lines.” Tourism Management 58 (1): 78–88. doi:10.1016/j.tourman.2016.10.012.