
 ?Mathematical formulae have been encoded as MathML and are displayed in this HTML version using MathJax in order to improve their display. Uncheck the box to turn MathJax off. This feature requires Javascript. Click on a formula to zoom.
ABSTRACT
21st Century Maritime Silk Road (MSR) is of significant importance for world freight transport. The ports along the MSR present a key element of the involved shipping networks to support the connectivity of the MSR. Therefore, it is crucial to carry an effective safety assessment of the ports to ensure the robustness and sustainability of the growing MSR. However, traditional quantitative risk analysis approaches (QRA) used in ports face many challenges when being applied within the context of the MSR, such as risk data incompleteness and ambiguity, and operational and environmental uncertainties. This paper proposes a novel safety evaluation approach to address these issues encountered during the risk analysis process in the MSR ports. The fuzzy set theory (FST), an evidential reasoning (ER) approach, and the expected utility theory are integrated in a holistic way in the proposed methodology. The proposed methodology is used to analyse five key ports along the MSR. The results provide decision-makers with useful insights on enhancing port safety, effective route planning as well as improving operational efficiency.
1. Introduction
The 21st Century Maritime Silk Road (MSR), initiated by China in 2013, connects more than 65 countries which jointly account for over 62% of the world’s population, about 30% of the world’s GDP and around 24% of the household consumption (CITI (China International Trade Institute) Citation2015). There are over 600 ports along the MSR, with the number of major ports from Africa, Asia, and Europe amounting to 228 (CGTN (China Global Television Network) Citation2019). The MSR emphasises on transportation connectivity and economic cooperation among the involved countries. It aims to enhance cooperation in the fields of economic interests, international trade, and shipping transportation. With the initiative of the 21st MSR, the demand for international shipping is increasing which leads to the growing throughput of ports along it in one hand and higher risk concern and safety stake in the other. Ports not only play an important role in economic activities but also possess a critical social function. The development of ports has stimulated trade activities and job opportunities, thus aids to boost the port states’ economy and social stability. The MSR provides an opportunity for the development of international ports as well as a challenge for the industry to reform and meet the increasing demands. Being the critical key nodes along the MSR that connect sea and land, ports need a robust safety evaluation framework to guide rational risk-based decision. However, ports are highly vulnerable to potential threats and uncertainties due to their critical locations, complex service systems, and social-economic functions (Alyami et al. Citation2019). The ports along the MSR are characterised with different features and backgrounds influenced by various cultures. A new safety evaluation framework that can provide a common standard for risk analysis along the MSR ports will facilitate the coordination and cooperation of safety resources at a global/macro level for safe ship network configuration.
Port safety is attracting increasing attention given the occurred accidents in recent decades. For example, the lock-out of the American West Coast Port in 2002 cost 20 USD billion in 10 days; the Typhoon Maemi caused significate loss of Port of Busan in 2003, and it toppled 8 giant cargo cranes and damaged other 3, which cost the government over 15 months for their recovery; the earthquake occurred off the coast of Japan in 2011 generated a tsunami which had resulted in 15,899 deaths and 2,529 people missing; the Fukushima nuclear disaster had forced more than 100,000 people to evacuate because of radionuclides to the environment; and the explosion of Tianjin Port in 2015 killed 173 people and injured hundreds. To ensure the stabilization and connectivity of the MSR, it is necessary and beneficial to develop a generic risk assessment model that is able to assess different types of risks in the port management and operation.
Many authorities and organizations have also proposed a number of maritime safety measures via regulations (port state control and formal safety assessment) for safe port operations (Yang et al. Citation2018; Alyami et al. Citation2019). At large, the implementation of the measures, particularly those on a voluntary basis, requires appropriate risk assessment for its justification. It has been a challenge to assess the safety of ports using traditional risk assessment approaches when new operational environments (e.g. MSR) and emerging risk types (e.g. pirate attacks) are involved. Traditional risk assessment approaches such as Event Tree Analysis (ETA), Fault Tree Analysis (FTA), and Failure Mode and Effects Analysis (FMEA) have been criticized with two major deficiencies, 1) relying too much on failure data and hence exposing the inability to process data with a high level of uncertainty; and 2) the insufficient ability to synthesis different types of data, qualitative and quantitative (Yang et al. Citation2009; Cao and Lam Citation2019). As a result, new uncertainty methods have been proposed to address the above deficiencies, such as fuzzy set theory (FST), Bayesian Network (BN), evidential reasoning (ER), and Markov models.
Selection of an appropriate risk analysis method depends on the feature of the system to model. Safety evaluation of the MSR ports is characterised by (1) the different data formations of safety indicators in different countries (Mokhtari et al. Citation2012), (2) the scarcity in historical statistical data in terms of port accidents (Yang et al. Citation2009). ER when combined with FST can accommodate both qualitative and quantitative indicators and synthesise port safety performance against different indicators to a system level for an overall safety evaluation. The involvement of the indicators can be adjusted by their weights in the ER model to reflect the reality of the investigated ports in a particular region. This paper applies the FST and ER approach to assess the safety of a few selected ports along the MSR in which FST is used to cope with the uncertainty in data and ER for the synthesis of different types of information from multiple risk factors. The novelty of this work lies in the presentation of a generic framework that can aid the analysis of different types of risks in the same framework and create a standardised safety process for the ports from different geographies along the MSR corridor.
The remainder of this study is organized as follows. Section 2 reviews the literature focusing on port safety evaluation, followed by the detailed description of the proposed risk assessment framework in Section 3. A case study regarding MSR port safety evaluation is applied to demonstrate the feasibility of the methodology in Section 4 and risk implications of the selected MSR ports in Section 5. Section 6 presents the conclusion and future work.
2. Literature review
2.1. Review of port safety assessment
Although port safety assessment is crucial to ensure the robustness and sustainability of the associated shipping routes (e.g. MSR), a careful literature review indicates a lack of robust safety analysis of ports compared to other port management research, such as port competition and cooperation (e.g. Song, Tang, and Zhao Citation2018; Ishii et al. Citation2013), port efficiency (e.g. Serebrisky et al. Citation2016; Suárez-Alemán et al. Citation2016; Yuen, Zhang, and Cheung Citation2013), port performance (Chen et al. Citation2016), green port development (e.g. Aregall, Bergqvist, and Monios Citation2018; Wan et al. Citation2018), regional ports evaluation and economy development (e.g. Deng, Lu, and Xiao Citation2013; Svindland, Monios, and Hjelle Citation2019; Pallis, Vitsounis, and Langen Citation2010), and port governance (e.g. Zhang et al. Citation2019). The ones that are associated with port safety have been focusing on a particular type of risk, such as catastrophic events, (e.g. major explosions) (Cao and Lam Citation2019), facility security issues (Yang, Ng, and Wang Citation2014), security policy issues (Yeo, Pak, and Yang Citation2013), (security has been considered as a part of safety in Yang, Wang, and Li (Citation2013)), and operation failures (Alyami et al. Citation2014). It is therefore needed to develop a generic risk assessment model that is able to assess different types of risks to fulfil the research gap.
In the past decade, studies have been conducted in the attempt to assess port safety from both qualitative and quantitative perspectives, among which FMEA is one of the most widely used methods. The traditional FMEA uses three indicators (namely occurrence likelihood, consequence severity, and probability being undetected) to assess safety (Braglia, Frosolini, and Montanari Citation2003). In order to facilitate the applications of FMEA, uncertainty modelling methods are incorporated. For Alyami et al. (Citation2014), (Citation2019)) presented new approaches based on a Fuzzy Rule-Based BN and ER respectively to facilitate the process of FMEA in container port safety evaluation. The proposed approaches had the capability of dealing with uncertainties thus allowing dynamic risk-based decisions in port safety. However, the approaches had only been applied in individual container terminals and its feasibility in other ports of different geographical, size and economic features is yet verified, required more empirical evidence to found. Cao and Lam (Citation2019) developed a fast reaction-based port model that embedded a fuzzy ER approach and the fuzzy TOPSIS to assess seaport vulnerability. The proposed approach allowed the quantification of ex-post port vulnerability with a state of ‘black box’. However, it analysed the catastrophes that feature high negative impacts and low frequency and other types of hazards beyond the consideration of the analysis.
To undertake port risk analysis in a systematic manner, we collected and analysed the papers on risk analysis of ports from academic journals written in English. The keywords used to search the papers contained ‘seaports’ and ‘risk/safety analysis/assessment’. The data sources include web of science, science direct, Wiley InterScience, and engineering village. Seventy-nine papers were founded from the paper screening. By reading the titles and abstracts, 71 papers were selected, and then, 20 papers are found relevant after reading their full contents. Among the 20 papers, those of duplicated abstracts and methods, and review papers were excluded. Finally, 5 papers retain and are analysed as follows. Mokhtari et al. (Citation2011) proposed a risk management framework incorporating FTA and ETA to evaluate the safety of seaports and offshore terminals. The FST and possibilistic approaches were applied to deal with incompleteness and vagueness of data. Although the key findings enabled port managers to design and implement their own safety management, it did not incorporate incompleteness in subjective evaluation and only focused on operational risk that was evaluated to complete the risk assessment. Similarly, Mokhtari et al. (Citation2012) and John et al. (Citation2014) also focused on the operational management of ports without considering the impact of other risk factors on ports. More specifically, Mokhtari et al. (Citation2012) proposed a decision support framework based on the fuzzy set to manage port risk. The integrated methodology and model were tested by a case study that showed its applicability for the risk assessment of ports and terminals in various situations. John et al. (Citation2014) introduced a fuzzy set theory-based risk assessment approach to facilitate the treatment of uncertainties and modelling of the safety systems in seaport operations. Yang, Ng, and Wang (Citation2014) carried out a quantitative analysis of port security assessment by using a novel fuzzy ER method. This work yet focused on port facility security such as terrorist attacks and suicide hijackings, which could generate impacts on port facilities thus disrupt the normal operation of the investigated ports. Lee et al. (Citation2018) had undertaken a review of the Silk Road Economic Belt and the 21st Century MSR. The study revealed that ports was one of the key structural elements of the MSR, and identified the expected impacts of port safety on global trade. However, none of the above studies had investigated a generic framework that can standardise the safety assessment process of various ports of diversified features along the same freight corridor, which requires the cooperation among the investigated ports.
2.2. The fuzzy set with a belief structure
When objective failure data is absent, risk assessment mainly depends on the knowledge of domain experts and their subject judgements where a large number of uncertainties are often involved. Subjective risk analysis had been widely applied to cope with emerging risks and/or systems involving new features/environments. Nevertheless, with the development of complex networks (e.g. maritime transportation), the risk assessment process becomes more complex due to the increasing risk factors. It is difficult for analysts to apply simple subjective approaches such as Risk Priority Number (RPN) in FEMA to accurately judge the impact of risk factors, hence requiring the assistance of advanced modelling techniques.
As an extension of a classical set, a fuzzy set was introduced by Zadeh (Citation1975) to deal with the fuzziness of subjective data. Fuzzy logic-based approaches are powerful to analyse complex or ill-defined systems when the available information is qualitative and imprecise (Liu et al. Citation2004). The fuzzy rule base with a belief structure has been demonstrated as a useful application in practice in terms of dealing with a non-linear dynamical system (Liu et al. Citation2005). FST with a belief structure can provide a better way to represent expert knowledge when experts are not 100% certain about their judgements (Yang et al. Citation2009). It has been used in engineering system reliability analysis but not yet in port safety evaluation. The application of a fuzzy set designed on the basis of a belief structure in engineering systems could capture uncertainty and non-linear relationships between risk factors with various types and safety levels (Liu et al. Citation2004, Citation2005; Yang and Wang Citation2015). In the maritime risk study areas, the fuzzy logic techniques have been used in waterway transportation systems (Zhang et al. Citation2016), seaports and terminals (Mokhtari et al. Citation2012; John et al. Citation2014), maritime supply chain (Wan et al. Citation2019a, Citation2019b) and port infrastructure (Yang, Ng, and Wang Citation2014). However, up to the authors’ best knowledge, the current relevant literature witnesses few studies on fuzzy rule based with a belief structure on port safety studies as well as on the analysis of the risks from different perspectives (e.g. technical and operational) relating to seaports in the same framework.
2.3. ER approach and applications in port risk analysis
ER was developed based on the Dempster Shafer theory. It has been interpreted and presented by different algorithms on the basis of decision theory and the D-S theory of evidence. The one widely used in dealing with uncertainty and incompleteness in risk assessment was introduced by Yang (Citation2001). The major advantages of using Yang’s ER approach include (Liu et al. Citation2005):
(1) It can provide an alternative way of dealing with both quantitative and qualitative information systematically.
(2) It has the ability to represent the incomplete, uncertain, and vague data as well as complete and precise data by using the belief structures.
(3) It is capable of synthesizing the information in a rational way.
(4) It can present the risk result against different criteria at the different levels of the hierarchy.
The applications of ER in risk analysis are mainly in general engineering areas (i.e. 147 results from WoS when using ‘evidential reasoning’ and ‘risk analysis’ as the keywords to search). Its use in the maritime industry becomes increasing as evidenced by 19 out of the 30 articles (when using ‘evidential reasoning’, ‘risk analysis’ and ‘maritime’ as the keywords to search on WoS) are from the recent five years. Comparatively, the use of ER in port risk analysis is much less, only having 7 papers since 1970 that dealt with different risks across different types of terminals, including the aforementioned Alyami et al. (Citation2019), Cao and Lam (Citation2019), John et al. (Citation2014), Yang, Ng, and Wang (Citation2014), Mokhtari et al. (Citation2012) and Liu et al. (Citation2004). Investigation of ER use in the analysis of multiple risks across multiple ports from intercontinental countries along the same shipping route/trade corridor is new, compared to the previous port safety studies most of which are from west European countries. It is also expected that the finding can generate more experimental evidence on the feasibility of ER in port risk analysis for its generalisation in theory and popularity in port safety management in practice. From the MSR research viewpoint, the case will investigate the ports along the MSR, the findings will be unique and implications will provide useful insights for the safety cooperation of the upper stream and downstream ports in a transport chain as they are expressed in the same universe.
3. Framework and methodology
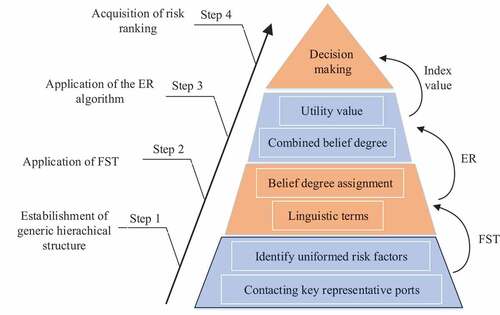
The proposed risk assessment framework is shown in . It consists of four main steps including, 1) Establish a risk assessment hierarchy structure for an MSR port, where the unique risk factors and their hierarchical structure characterising the MSR are identified; 2) Evaluate the identified risk factors by a new approach in which the probability of occurrence and severity of consequence of each risk factor are defined and measured using FST and a belief degree concept; 3) Synthesis the evaluation results of all the risk factors using an ER algorithm, and 4) Obtain crisp numbers for risk prioritization which can be used as a reference for rational safety resource allocation.
Figure 1. The proposed generic framework for the risk assessment of the ports along the MSR.
3.1. Step 1. identification of risk factors and the establishment of a port risk assessment hierarchy
In this step, all the relevant factors influencing port disruptions are carefully investigated and identified. This can be achieved through the consultancy from industrial and academic experts and literature review (Mokhtari et al. Citation2012; John et al. Citation2014; Pak et al. Citation2015; Zhang et al. Citation2016; John et al. Citation2016; Alyami et al. Citation2019). Necessary changes have been made on the basis of the factors previously identified in port risk assessment in the literature by tracking into account the characteristics of MSR from the domain experts. Zhang et al. (Citation2016) identified four sub-factors including human, vessel, environment, and management associated with port safety evaluations. Mokhtari et al. (Citation2012) had added security risk factors into the risk management of seaports and terminals. Since some ports along the MSR have suffered severe threats from pirates and/or terrorist attacks, the security risk factors are also incorporated in this paper. With the development of the MSR, an increasing number of vessels will be involved in freight transport which could lead to more vessel accidents and congestion. In addition, the MSR project has contributed to the new investment of many ports to improve their infrastructure for improved efficiency. The factors associated with equipment failures have therefore been taken into account in the hierarchical structure. The detailed factors in the hierarchical structures are presented in Section 4. These factors can sever as the baseline for MSR ports to develop their specifically tailored risk factor hierarchies.
3.2. Step 2. application of FST with a belief structure
After the risk factor identification and hierarchical structure construction in Section 3.1, the second step is to conduct basic risk assessment (ABS (American Bureau of Shipping) Citation2003). Li and Liao (Citation2007) and ABS (American Bureau of Shipping) (Citation2003) suggested that the probability of occurrence (P) and severity of consequence (S) affect risk in a simple multiply way. The risk can be presented using the following equation:
where R represents the risk level of an identified factor, P is the probability of occurrence of the risk factor, S denotes the severity of consequence of the factor, symbolizes fuzzy multiplication. The probability of occurrence of a risk is measured by the number of occurrences per unit time, and the severity of consequence defines the scale of the risk event that has a negative effect on ports. To be more specific, the consequence severity of a risk factor can be measured by the number of people affected, the amount of cargo damaged, the time of transportation delayed, the property of the system loosed, the area of operation affected, and other negative impacts (ABS (American Bureau of Shipping) Citation2003; Wan et al. Citation2019a). As the guidance of risk assessment, the definition has been widely used in many industries such as environmental system (Bereskie et al. Citation2017), metropolitan construction projects (Kuo and Lu Citation2013), manufacturing sector (Djapan et al. Citation2019), oil and gas offshore (Lavasani et al. Citation2011; Baladeh, Cheraghi, and Khakzad Citation2019), municipal infrastructure (Shahata and Zayed Citation2016). Since the P and S will be defined by using fuzzy sets, R will also be presented by fuzzy numbers according to the EquationEq. (1)
(1)
(1) . Therefore, the fuzzy risks can be calculated using the following formula:
where represents the risk level in a fuzzy set,
and
are the probability of occurrence and the severity of consequence in a fuzzy form, respectively. In the next sub-sections after introducing the fuzzy sets and numbers, it will be described how to use the fuzzy sets with belief structures.
3.2.1. Definition of the probability of occurrence and the severity of consequence
In risk assessment, it is hard for analysts to quantify the risk associated with high uncertainty. Analysts sometimes cannot give exact values for evaluating risks in many practical situations. Therefore, they usually prefer to assessing risks using linguistics terms/levels, such as high, low, rather than specific numerical values. Therefore, the linguistic terms, rather than specific values, are adopted to describe the uncertainties by incorporating an extension of crisp sets.
Miller (Citation1956) indicated that the number of linguistic terms should be between 4 and 7. Usually, too few terms will limit the expression of analysts, while too many terms will impose significant costs on the assessment process. After review the previous studies on maritime risk assessment (Lavasani et al. Citation2011; Mokhtari et al. Citation2012; John et al. Citation2014), five levels are selected for experts to represent the probability of occurrence and the severity of consequence. Regarding their fuzzy membership, the straight-line membership functions, such as triangular membership functions are used due to its simplicity and wide applications in the field of risk assessment (Yang et al. Citation2009; Mokhtari et al. Citation2012; John et al. Citation2014; Cao and Lam Citation2019). The FST with subjective linguistic terms is applied to define risk and its parameters. The linguistic definitions and fuzzy membership functions for P and S are carefully examined and verified by domain experts to fit with MSR context based on previous studies in subjective risk modelling (Mokhtari et al. Citation2012; John et al. Citation2014). The overlapping triangular membership functions are verified by experts as shown in , 2 and .
Table 1. The linguistic terms and fuzzy membership function for P.
Table 2. The linguistic terms and fuzzy membership function for S.
Figure 2. Example of transforming (fuzzy rating) to
(belief structure).
The definition of P is presented in . As for S, it can be divided into three aspects including ‘Damage to economic (SEC)’, ‘Loss of life (SLI)’, and ‘Damage to environment (SEN)’ with the guidance of previous works about the development of the MSR and risk assessment (ABS (American Bureau of Shipping) Citation2003; CGTN (China Global Television Network) Citation2019; Lee et al. Citation2018). SEC is measured by the percentage of the value of goods affected by various risks; SLI expresses the loss of lives or injures after a disruption; SEN represents the degree of damage to the environment caused by a disruption, which is expressed by the percentage. The overall consequence for S is then calculated by synthesizing the three consequences through fuzzy averaging.
3.2.2. Application of a belief structure in FST
The risk level of port disruption is the multiplication of the probability of occurrence and the severity of consequence as it was presented in EquationEq. (2)(2)
(2) . At the same time, the fuzzy risk level of port disruption can be calculated by
and
as follows:
where H can be expressed by five grades in this paper (e.g. {Very low, Low, Medium, High, Very high}). For example, if a risk based on experts’ judgement has a probability of occurrence (P) of high (0.50, 0.75, 1.00) and severity of consequence (S) of medium (0.25, 0.50, 0.75), the corresponding risk will be
(0.125, 0.375, 0.75). Then, the
will be transformed into a fuzzy risk to conduct the following steps of risk assessment. The process of transformation contains 5 steps according to Sadiq, Saint-Martin, and Kleiner (Citation2008). The detailed of these steps are illustrated in and and explained as follows within the context of this study:
Table 3. Example of transforming to fuzzy risk H*.
1. Map over
(five grades defined i.e. VL, L, M, H, VH triangles shown in ). The
is drawn in dotted lines, and the
is drawn in solid lines.
2. Determine the points where intersects with the membership of each linguistic term of
in . The points are described by solid black circles.
3. Use a maximum figure if and a linguistic term of
intersect at more than one points. (e.g. There are two intersection points with medium if the lower boundary moves from 0.75 to 0.8 in , and the maximum value of the interacted figure points will be selected.)
4. Build a set of intersecting points to define a non-standardized five grades using a fuzzy set (i.e. five selected points in , result in [0.25, 0.75, 0.80, 0.4, 0], shown in ).
5. Standardize to obtain
that represents the belief structure (i.e. every value of membership
of
(i=1, 2, 3, 4, 5) is converted to
by the cardinality C (the sum of all the value of
) as EquationEq. (4)
(4)
(4) ). The result of standardization is shown in .
3.3. Step 3. application of an ER approach
Since each risk factor contributes differently to the port risk level, it is necessary to take their weights into account to show their relative significance in the risk assessment process. The relative weights of the risk factors are determined using an Analytic Hierarchy Process (AHP) method (Saaty Citation1998) through the discussion among domain experts. The detailed process of determination is illustrated in Section 4. Once the weights and belief structure of all risk factors are determined, the ER algorithm is applied to synthesize all the information and generated the overall risk results at the whole port system levels.
According to Section 3.2, the grades for risk factors are defined by EquationEq. (5)(5)
(5) . The generation of a risk factor
using a belief structure is expressed by
in EquationEq. (6)
(6)
(6) . The conversion of the degree
into basic probability is shown in EquationEqs. (7
(7)
(7) )—(12)
—the degree to which the risk factor
belongs the assessment grade
with
and
. If
, the risk assessments from analysts stand for complete; otherwise, it exists ignorance.
—basic probability mass to which the ith risk factor
supports the conclusion,
—the relevant importance of ith risk factor
,
—unassigned probability mass to any grades,
—unassigned probability mass account for the relative importance of risk factors,
—unassigned probability mass account for the incompleteness of the assessment.
Then, the sub-risk factors of can be assessed by repeating the above steps (Yang Citation2001). For example, we define the
as the subset of
,
is a basic probability mass to which the ith risk factor
supports the conclusion,
is the unassigned probability mass to any grades,
is the unassigned probability mass account for the relative importance of sub-risk factors,
is the unassigned probability mass account for incompleteness of the assessment. Let
and
with
and
. Next, the above basic probability masses are aggregated by using EquationEqs. (13
(13)
(13) )—(19) (Yang Citation2001).
where, and
mean the belief degrees to which the sub-risk factors support the grade
and
, respectively. The formula
has been proved by Yang (Citation2001) and Yang and Xu (Citation2002). The final risk level of the ith risk factor can be given as follows:
3.4. Step 4. obtaining crisp risk numbers for ranking
The risk assessment results shown in EquationEq. (21)(21)
(21) present the risk level of the ith risk factor of the investigated port. It can provide decision-makers with a whole view about the risk level of the investigated port, from which they can understand what belief degrees are assigned to the grades, and which grades the selected ports are assessed to. However, it is not helpful for decision-makers to understand the risk ranking among the ports along the MSR. Therefore, we have introduced the concept of expected utility to obtain numerical values for a risk ranking purpose. Define the utility value of an assessment grade
is
, and the definition of the expected utility of the general assessment in kth port
is presented in EquationEq. (22)
(22)
(22) :
where denotes the lower bound of the probability that the kth investigated selected port is assessed to
, and the upper bound of the probability is
(Yang Citation2001; Yang et al. Citation2009), which means if the risk assessment is incomplete (
), there is a utility interval
. According to the assessment grade in Section 3.2, the most preferred linguistic term is very low, which means the lowest utility denoted by
. The least preferred linguistic term is very high, which means the highest utility denoted by
. The maximum, minimum and average utilities of
are determined using EquationEqs. (23
(23)
(23) )—(25) (e.g. Yang et al. Citation2009):
The above formulas disclose that if , then
. At the same time, if the risk assessment is complete, then
and
. In addition, one should note that the above utilities can be only applied for characterizing a distributed assessment and cannot be used in the process of aggregating risk factors. When it comes to ranking safety levels between two ports, the detailed process based on their utility intervals can be listed as follows. If
,
is better than
; if
and
,
is said to be equal to
. Otherwise, the preference of
over
can be calculated using EquationEq. (26
(26)
(26) ) (Wang, Yang, and Xu Citation2005):
It is obvious that and
when
. If
, then
is said to be better to
to the degree of
, presented by
; if
, then
is said to be equal to
, presented by
; if
, then
is said to be subordinate to
to the degree of
, presented by
.
4. Case study
In order to demonstrate the feasibility of the proposed methodology and evaluate the significance of the analysis results in terms of their representation practice, we selected ports along the MSR based on their annual throughput and annual number of ship calls. The top 10 ports along the MSR in terms of both throughput and ship callsFootnote1 are invited to participate in this study. Only five ports are actively responsive with valid data to conduct the case analysis. The above five ports numbered as Port 1–5 are finally selected to support the case study. It is conducted under a fuzzy environment and decision-makers’ preference to show the capability to assess the safety of the ports using the proposed approach.
Based on the methodology illustrated in Section 3 and available information in Section 2, a hierarchical port risk assessment structure is constructed in Section 4.1 and the application of the fuzzy ER approach is shown in Section 4.2.
4.1. Identify risk factors and develop a hierarchical structure
Based on the literature review in Section 2 and the identification process in Section 3.1, we identify the safety risk factors and present them in .
Figure 3. A hierarchy for the risk factors of an MSR port.
The above process is conducted by the consultancy with the domain experts who have a wealth of expertise in port safety and security and are very familiar with the MSR port operation. The profile of the selected three experts is shown in . The experience and qualifications of the three experts were carefully evaluated for data robustness during the selection procedure, the selected experts are capable of assessing the issues studied, partially supported by the consistency of their raw evaluations.
Table 4. Expert profile.
4.2. Obtain belief degrees of the risk grades used to describe P and S
Fuzzy ratings of the selected port are collected from the three experts in Section 4.1. These experts are investigated to give fuzzy ratings for the P and S related linguistic terms of each risk factor displayed in based on the defined fuzzy membership functions presented in and . The fuzzy ratings of P are given by experts directly, and the fuzzy ratings of S are synthesized by the three consequences shown in . The results of for the case of Port 1 are shown in based on the calculation using EquationEq. (4)
(4)
(4) . The risk levels in the form of
displayed in are transformed to the H through the process discussed in Section 3.2.3 shown in . The detailed fuzzy ratings of the other two experts are shown in Appendix A-D. Since the relative weights of all experts are given equally, the aggregated assessment results of three experts are obtained by averaging and shown in . The aggregated fuzzy ratings by three experts for the other four ports are presented in Appendix E.
Table 5. Fuzzy ratings, case of Port 1 from expert 1.
Table 6. Transformed ratings, case of Port 1 from expert 1.
Table 7. Aggregated linguistic terms of three experts, case of Port 1.
4.3. Apply an ER algorithm to aggregate the risk assessment from a risk factor to port level
Before applying an ER algorithm to aggregate the risk assessment of the risk factors, the weights of the risk factors are calculated by AHP. Three experts are invited to give the pairwise comparisons in the same level of the hierarchical structure. The input data on weights of the first level are averaged from the three experts as shown in . Similarly, the relative weights of all other risk factors of the second level are assigned in . Having obtained the weights and belief degree against the defined linguistic terms of P and S, the ER approach is applied to perform the risk assessment of an MSR port.
Table 8. Pairwise comparisons in term of risk factor at the first level.
Table 9. Weights of all risk factors at the second level.
In the case of Port 1, the risk assessment is obtained by using EquationEqs. (6(6)
(6) )—(21). Firstly, the risk factors of the second level are aggregated to generate results for the risk factors at the first level. Secondly, the risk factors of the first level are aggregated to generate an overall result for Port 1. These results are displayed in and .
Table 10. The aggregated distributed results, Case of Port 1.
Figure 4. Risk estimates of Port 1 case.
As shown in , the result for Port 1 is obtained as {(23.73%, VL), (45.05%, L), (25.24%, M), (5.74%, H), (0.24%, VH)}. It can be understood that the risk level of Port 1 is estimated as Very Low with a belief degree of 0.2373, Low with a belief degree of 0.4505, Medium with a belief degree of 0.2524, High with a belief degree of 0.0574, and Very High with a belief degree of 0.0024. The results of the other four ports are presented in Appendix F-G, respectively. It is worth noting that all the results in this paper are based on the synthesis of the selected experts’ assessment.
In general, it is interesting to know that for each investigated port, the risk level at the goal level has the highest belief degree assigned to the ‘Low’ grade and the lowest belief degree to ‘Very high’ grade. Such a result reveals that the five ports have relatively good practice on their safety management. However, there is still some hidden risks needing more attention according to the results presented above. Furthermore, it is important to compare the overall risk of the five ports for rational safety resource allocation from an MSR network perspective. Therefore, the decision-makers’ preference information is applied to obtain crisp numbers for a port risk ranking purpose in Section 4.4.
4.4. Obtain crisp numbers for port risk ranking
Port risk ranking information is important for various stakeholders. For instance, for cargo/ship owners, they consider the use of the safest ports in their regions along the MSR, while for port operators, port risk ranking based on different risk factors is probably a more sensitive tool to improve their ports’ safety and hence competitiveness. Therefore, to obtain crisp numbers for both port level overall ranking and risk factor-based ranking, the preference information associated with each linguistic term is required. The linear utility function shown in is first assigned (e.g. Yang et al. Citation2009; Yang, Wang, and Li Citation2013) in this paper for an illustration purpose to present risk ranking. From , the utility value to each linguistic term is generated as (0, 0.25, 0.5, 0.75, 1). The utility value represents that the lower the utility value is, the better the safety level a port has. Thus, based on and EquationEqs. (22(22)
(22) )—(25), the calculated ranking value (RV) for the case of Port 1 is 0.2843. In the case of Port 1, the aggregated result
and
(i.e. the assessment is complete), and there is not a belief interval involved. The detailed calculated results of ranking value (RV) for the cases of the other four ports are shown in .
Table 11. Overall Ranking value (RV), cases of five ports.
Figure 5. Utility function.
0.2843
As shown in , Port 5 has the lowest values with 0.2635, followed by Port 4 (0.2686), Port 2 (0.2793), port 1 (0.2843), and Port 3 has the highest values with 0.3192. The result indicates that Port 5 is the safest port.
In terms of the risk factor level analysis, as shown in , the ranking of the first level factors is mostly consistent with the overall ranking in . To be more specific, Port 5 has the lowest value in terms of the risk factors in the safety and security risk categories. Port 2 represents its advantage regard of the management risk category. Although Port 4 does not show an obvious advantage in the ranking of an individual risk factor, its overall ranking can reach second place due to its relatively high safety performance across all the three categories. On the contrary, Port 3 is ranked last in the overall ranking value, largely due to its poor performance at the safety and security risk categories.
Table 12. Ranking value of the first level, cases of five ports.
The ranking of the second level factors as shown in can provide insightful information on making tangible control measures. Port 5 ranks first against R12, R13, R21, R22, and R31, which shows the advantages of Port 5 in the above risk factors. Port 3 has the worst rank in terms of the most risk factors. Port 3 should make effort to implement more corresponding control measures to improve its port overall safety by using benchmarking and learning from the best practice of the leader (i.e. Port 5) from the investigated MSR ports.
Table 13. Ranking value of the second level, cases of five ports.
In order to further verify the reliability of the results, a sensitivity analysis approach by adjusting the weights of the risk factors is employed in this study. A minor decline or increment of the weights for the risk factors will result in a decrease or an increase of the outputs data i.e. rankings correspondingly. In order to carry out the validation, we increase 20% of the weight of the experts’ knowledge for one expert (randomly selected) against one first level risk factor (i.e. management risk). The amended new results are shown in . The new ranking result of the five ports is shown in . It is seen that the ranking result changes accordingly. To be more specific, because Port 2 has the best performance in terms of management risk factors, its ranking improves the most when the weight of R3 is increased. In contrast, Port 5 having the worst performance against the management risk category drops the most in the ranking. It partially validates the model and result since both of them well reflects the reality simulated in the sensitivity analysis.
Table 14. Re-calculated weights for sensitivity analysis.
Table 15. Comparisons of ranking results between different weights.
Furthermore, to test the effect of the linearly assigned utility values (i.e. (0, 0.25, 0.5, 0.75, 1)) on the final port risk ranking, this section conducts a benchmark study by applying another established defuzzification utility value distribution method (e.g. Wan, Yang, and Sen Citation1996). From , the defuzzied values of the five linguistics terms of the risk level can be calculated using a centroid method (e.g. Yang and Wang Citation2015) as (0.083, 0.25, 0.5, 0.75, 0.917)). The revised ranking of the five ports based on the new utility values is obtained and presented in . The two sets of results in and 16 are in a good harmony, which supports the robustness of the model and the result in the paper.
Table 16. Overall Ranking value (RV) using a centroid method, cases of five ports.
5. Discussion and research implications
The development of the MSR stimulates the paradigm-shift of port safety research from individual analysis using different standards at a local node level to integrated diagnosis based on the same framework at a global level. This research contributes to the safety evaluation of ports along the MSR from a global perspective under uncertainties. In this study, the selected representative ports were carefully investigated in order to propose a common framework for safety evaluation research of ports along the MSR. The research implications are drawn from both theoretical and practical perspective as follows.
As for the theoretical research implications, this is a new study taking into account the superiority of the ER approach model using quantitative and qualitative factors to develop a generic risk assessment at a global level for safe transportation along the MSR. As qualitative data are often ambiguous to use in a scientific way, and quantitative risk data are often difficult to obtain, the use of ER in this paper helps address both quantitative and qualitative information in a meaningful way and provides decision-makers with a powerful tool to realise a more comprehensive evaluation of MSR port safety.
The research findings of this paper contribute to managerial practices and policy suggestions in the port safety evaluation along the MSR. Firstly, this study provides maritime stakeholders with a standard tool to facilitate the coordination and cooperation of safety resources at a global/macro level for safe ship network configuration. It can help maritime stakeholders to make rational safety decisions based on a comparative analysis of other relative ports. Specifically, cargo/ship owners can use it to choose the safest port in their service regions, while port operators can use it to figure out their strengths and weaknesses in terms of safety management. Furthermore, it is possible for the underperformed ports to learn the best safety practice from the cooperative ports who have shown safety strengths against their weaknesses. Secondly, this paper shows all the risk factors through a careful investigation in a transparent way and hence port managers can use the risk factor hierarchy as a safety KPI dashboard for risk self-assessment, monitoring and improvement. Furthermore, it enables port managers to better understand and value the experience and practices from the other ports and offers diagnostic tools for maritime stakeholder relations management. Finally, this paper asserts the safety performance of the key ports along the MSR, and helps gain useful insights for port stakeholders on their strategic investment in future. It could help trigger a new wave of MSR port safety evaluation when it is popularised and used by policy makers for justifying financial investment reference in future. In this respect, this study evaluates the safety of the five major ports, as a pioneering pilot, to propose a generic framework that can aid to assess different types of risks. The comparative analysis on the performance of the five ports against ‘Level 2’ and ‘Level 1’ factors can be used to identify where decision-makers should enhance their safety resources in view of improving port robustness and efficiency in the most cost-effective manner, using the benchmark approach and lessons learnt from the leading ports against the selected factor(s) where their ports have exposed poor performance. For instance, in Section 4, the results in suggest that Port 5 ranks first against the risk factors of cargo spillage, equipment failure, piracy, terrorist attack, and congestion. This indicates that port managers could adjust their strategies by referencing the experience and practice in terms of the best factors for the overall port safety along the MSR.
6. Conclusion
This study proposed a novel methodology integrating FST and ER approaches to evaluate the safety levels of the key ports along the MSR. The risk-based fuzzy modelling can effectively deal with experts’ judgments (i.e. complete or incomplete) by a belief degree structure, and allow risk analysts to present information (i.e. crisp data, uncertainty, and subjective judgment) in a unified and reliable manner. By using an ER algorithm, the assessment information of the five key ports was aggregated to generate their final safety ranking. The ranking values of the five key ports were calculated to compare their safety in a systematic way by using the utility theory. Compared to the traditional safety evaluation approaches, the new methodology in this paper provides transparent and reliable results that can be tailored and used in other MSR ports, with the capability of addressing uncertainty and incomplete data in complex systems in a systematic, flexible, and reliable way.
The fuzzy ER approach used in this paper is in nature a kind of multiple attribute decision making method. The ER approach can not only model port risk factors in a belief decision matrix but also generate reliable results using its powerful function of the risk aggregation process. Moreover, it is easy to operate and can provide decision-makers with useful insights in a transparent, comprehensible, and reliable manner for risk management. All of such characteristics are in a great need of addressing the challenges in assessing port safety along the MSR. As a result, the findings can aid the MSR ports to assess their safety and allow them to learn effective solutions from the leading ports with the best performance against certain selected risk factors where the target ports have poor performance for an overall safety performance improvement by cross-referencing within the context of the MSR. In future, the data the ports of different sizes and locations along the MSR are needed to see how the model can be adapted for its applicability across the whole MSR port universe, including the weights of the risk factors. It will also be valuable to develop a database to record the best practice against different risk factors for future MSR port safety improvement without the need of disclosing the identity of the associated leading ports against different risk factors.
Disclosure statement
No potential conflict of interest was reported by the authors.
Additional information
Funding
Notes
1. There is no conflict of the top 10 MSR ports in terms of throughput and ship calls.
References
- ABS (American Bureau of Shipping). 2003. “A Guide for Risk Evaluation for the Classification of Marine-related Facilities.” ABS Plaza, 16855 Northchase Drive Houston, TX 77060, USA
- Alyami, H., P. Lee, Z. L. Yang, R. Ramin, S. Bonsall, and J. Wang. 2014. “An Advanced Risk Analysis Approach for Container Port Safety Evaluation.” Maritime Policy & Management 41 (7): 634–650. doi:10.1080/03088839.2014.960498.
- Alyami, H., Z. L. Yang, R. Riahi, S. Bonsall, and J. Wang. 2019. “Advanced Uncertainty Modelling for Container Port Risk Analysis.” Accident Analysis & Prevention 123: 411–421. doi:10.1016/j.aap.2016.08.007.
- Aregall, M. G., R. Bergqvist, and J. Monios. 2018. “A Global Review of the Hinterland Dimension of Green Port Strategies.” Transportation Research Part D: Transport and Environment 59: 23–34. doi:10.1016/j.trd.2017.12.013.
- Baladeh, A. E., M. Cheraghi, and N. Khakzad. 2019. “A Multi-objective Model to Optimal Selection of Safety Measures in Oil and Gas Facilities.” Process Safety and Environmental Protection 125: 71–82. doi:10.1016/j.psep.2019.02.024.
- Bereskie, T., H. Haider, M. J. Rodriguez, and R. Sadiq. 2017. “Small Drinking Water Systems under Spatiotemporal Water Quality Variability: A Risk-based Performance Benchmarking Framework.” Environmental Monitoring and Assessment 189 (9): 464. doi:10.1007/s10661-017-6176-z.
- Braglia, M., M. Frosolini, and R. Montanari. 2003. “Fuzzy Criticality Assessment Model for Failure Modes and Effects Analysis.” International Journal of Quality & Reliability Management 20 (4): 503–524. doi:10.1108/02656710310468687.
- Cao, X., and J. S. L. Lam. 2019. “A Fast Reaction-based Port Vulnerability Assessment: Case of Tianjin Port Explosion.” Transportation Research Part A: Policy and Practice 128: 11–33. doi:10.1016/j.tra.2019.05.019.
- CGTN (China Global Television Network). 2019. “Data Tells: Ports Light up the 21st Century Maritime Silk Road.” https://news.cgtn.com/news/3d3d774d3149444d34457a6333566d54/index.html.
- Chen, L., D. Zhang, X. Ma, L. Wang, S. Li, Z. Wu, and G. Pan. 2016. “Container Port Performance Measurement and Comparison Leveraging Ship GPS Traces and Maritime Open Data.” IEEE Transactions on Intelligent Transportation Systems 17 (5): 1–16. doi:10.1109/TITS.2015.2498409.
- CITI (China International Trade Institute). 2015. “Industrial Cooperation between Countries along the Belt and Road.” 1005-06, Heng Sang North Point Building, 341 King's Road, Hong Kong, China.
- Deng, P., S. Lu, and H. Xiao. 2013. “Evaluation of the Relevance Measure between Ports and Regional Economy Using Structural Equation Modelling.” Transport Policy 27: 123–133. doi:10.1016/j.tranpol.2013.01.008.
- Djapan, M., I. Macuzic, D. Tadic, and G. Baldissone. 2019. “An Innovative Prognostic Risk Assessment Tool for Manufacturing Sectorbased on the Management of the Human, Organizational and Technical/technological Factors.” Safety Science 119: 280–291. doi:10.1016/j.ssci.2018.02.032.
- Ishii, M., P. T. Lee, K. Tezuka, and Y. Chang. 2013. “A Game Theoretical Analysis of Port Competition.” Transportation Research Part E: Logistics and Transportation Review 49 (1): 92–106. doi:10.1016/j.tre.2012.07.007.
- John, A., D. Paraskevadakis, A. Bury, Z. L. Yang, R. Riahi, and J. Wang. 2014. “An Integrated Fuzzy Risk Assessment for Seaport Operations.” Safety Science 68: 180–194. doi:10.1016/j.ssci.2014.04.001.
- John, A., Z. Yang, R. Riahi, and J. Wang. 2016. “A Risk Assessment Approach to Improve the Resilience of A Seaport System Using Bayesian Networks.” Ocean Engineering 111: 136–147. doi:10.1016/j.oceaneng.2015.10.048.
- Kuo, Y. C., and S. T. Lu. 2013. “Using Fuzzy Multiple Criteria Decision Making Approach to Enhance Risk Assessment for Metropolitan Construction Projects.” International Journal of Project Management 31 (4): 602–614. doi:10.1016/j.ijproman.2012.10.003.
- Lavasani, S. M., Z. Yang, J. Finlay, and J. Wang. 2011. “Fuzzy Risk Assessment of Oil and Gas Offshore Wells.” Process Safety and Environmental Protection 89 (5): 277–294. doi:10.1016/j.psep.2011.06.006.
- Lee, P. T. W., Z. Hu, S. Lee, K. Choi, and S. Shin. 2018. “Research Trends and Agenda on the Belt and Road (B&R) Initiative with a Focus on Maritime Transport.” Maritime Policy & Management 45 (3): 282–300. doi:10.1080/03088839.2017.1400189.
- Li, Y., and X. Liao. 2007. “Decision Support for Risk Analysis on Dynamic Alliance.” Decision Support Systems 42 (4): 2043–2059. doi:10.1016/j.dss.2004.11.008.
- Liu, J., J. B. Yang, J. Wang, H. S. Sii, and Y. M. Wang. 2004. “Fuzzy Rule-Based Evidential Reasoning Approach for Safety Analysis.” International Journal of General Systems 33 (2–3): 183–204. doi:10.1080/03081070310001633536.
- Liu, J., J. N. Yang, J. Wang, and H. S. Sii. 2005. “Engineering System Safety Analysis and Synthesis Using the Fuzzy Rule-Based Evidential Reasoning Approach.” Quality and Reliability Engineering International 21 (4): 387–411. doi:10.1002/qre.668.
- Miller, G. A. 1956. “The Magical Number Seven Plus or Minus Two: Some Limit on Our Capacity for Processing Information.” The Psychological Review 63 (2): 81–97. doi:10.1037/0033-295x.101.2.343.
- Mokhtari, K., J. Ren, C. Roberts, and J. Wang. 2011. “Application of a Generic Bow-tie Based Risk Analysis Framework on Risk Management of Sea Ports and Offshore Terminals.” Journal of Hazardous Materials 192 (2): 465–475. doi:10.1016/j.jhazmat.2011.05.035.
- Mokhtari, K., J. Ren, C. Roberts, and J. Wang. 2012. “Decision Support Framework for Risk Management on Sea Ports and Terminals Using Fuzzy Set Theory and Evidential Reasoning Approach.” Expert Systems with Applications 39 (5): 5087–5103. doi:10.1016/j.eswa.2011.11.030.
- Pak, J. Y., G. T. Yeo, S. W. Oh, and Z. L. Yang. 2015. “Port Safety Evaluation from a Captain’s Perspective: The Korean Experience.” Safety Science 72: 172–181. doi:10.1016/j.ssci.2014.09.007.
- Pallis, A. A., T. K. Vitsounis, and P. W. D. Langen. 2010. “Port Economics, Policy and Management: Review of an Emerging Research Field.” Transport Reviews 30 (1): 115–161. doi:10.1080/01441640902843208.
- Saaty, T. L. 1998. The Analytic Hierarchy Process. Pittsburgh, PA: University of Pittsburgh.
- Sadiq, R., E. Saint-Martin, and Y. Kleiner. 2008. “Predicting Risk of Water Quality Failure in Distribution Networks under Uncertainties Using Fault-tree Analysis.” Urban Water Journal 5 (4): 287–304. doi:10.1080/15730620802213504.
- Serebrisky, T., J. M. Sarriera, A. Suárez-Alemán, G. Araya, C. Briceño-Garmendía, and J. Schwartz. 2016. “Exploring the Drivers of Port Efficiency in Latin America and the Caribbean.” Transport Policy 45: 31–45. doi:10.1016/j.tranpol.2015.09.004.
- Shahata, K., and T. Zayed. 2016. “Integrated Risk-Assessment Framework for Municipal Infrastructure.” Journal of Construction Engineering and Management 142 (1): 04015052. doi:10.1061/(ASCE)CO.1943-7862.0001028.
- Song, Z., W. Tang, and R. Zhao. 2018. “Cooperation Mode for a Liner Company with Heterogeneous Ports: Business Cooperation Vs. Port Investment.” Transportation Research Part E: Logistics and Transportation Review 118: 513–533. doi:10.1016/j.tre.2018.09.004.
- Suárez-Alemán, A., J. M. Sarriera, T. Serebrisky, and L. Trujillo. 2016. “When It Comes to Container Port Efficiency, are All Developing Regions Equal?.” Transportation Research Part A: Policy and Practice 86: 56–77. doi:10.1016/j.tra.2016.01.018.
- Svindland, M., J. Monios, and H. M. Hjelle. 2019. “Port Rationalization and the Evolution of Regional Port Systems: The Case of Norway.” Maritime Policy & Management 46 (5): 613–629. doi:10.1080/03088839.2019.1574988.
- Wan, C., X. Yan, D. Zhang, Z. Qu, and Z. Yang. 2019b. “An Advanced Fuzzy Bayesian-based FMEA Approach for Assessing Maritime Supply Chain Risks.” Transportation Research Part E: Logistics and Transportation Review 125: 222–240. doi:10.1016/j.tre.2019.03.011.
- Wan, C., X. Yan, D. Zhang, and Z. Yang. 2019a. “Analysis of Risk Factors Influencing the Safety of Maritime Container Supply Chains.” International Journal of Shipping and Transport Logistics 11 (6): 476–507. doi:10.1504/IJSTL.2019.103872.
- Wan, C., D. Zhang, X. Yan, and Z. Yang. 2018. “A Novel Model for the Quantitative Evaluation of Green Port Development – A Case Study of Major Ports in China.” Transportation Research Part D: Transport and Environment 61 (B): 431–443. doi:10.1016/j.trd.2017.06.021.
- Wan, J., J. Yang, and P. Sen. 1996. “Multi-person and Multi-attribute Design Evaluations Using Evidential Reasoning Based on Subjective Safety and Cost Analyses.” Reliability Engineering & System Safety 52 (2): 113–128. doi:10.1016/0951-8320(96)00003-8.
- Wang, Y. M., J. B. Yang, and D. L. Xu. 2005. “A Preference Aggregation Method through the Estimation of Utility Intervals.” Computers & Operations Research 32 (8): 2027–2049. doi:10.1016/j.cor.2004.01.005.
- Yang, J. 2001. “Rule and Utility-Based Evidential Reasoning Approach for Multi Attribute Decision Analysis under Uncertainties.” European Journal of Operational Research 131 (1): 31–61. doi:10.1016/S0377-2217(99)00441-5.
- Yang, J. B., and D. L. Xu. 2002. “On the Evidential Reasoning Algorithm for Multiattribute Decision Analysis under Uncertainty.” IEEE Transactions on Systems, Man, and Cybernetics Part A: Systems and Humans 32 (3): 289–304. doi:10.1109/TSMCA.2002.802746.
- Yang, Z. L., A. K. Y. Ng, and J. Wang. 2014. “A New Risk Quantification Approach in Port Facility Security Assessment.” Transportation Research Part A: Policy and Practice 59: 72–90. doi:10.1016/j.tra.2013.10.025.
- Yang, Z. L., and J. Wang. 2015. “Use of Fuzzy Risk Assessment in FMEA of Offshore Engineering Systems.” Ocean Engineering 95: 195–204. doi:10.1016/j.oceaneng.2014.11.037.
- Yang, Z. L., J. Wang, S. Bonsall, and Q. G. Fang. 2009. “Use of Fuzzy Evidential Reasoning in Maritime Security Assessment.” Risk Analysis 29 (1): 95–120. doi:10.1111/j.1539-6924.2008.01158.x.
- Yang, Z. L., J. Wang, and K. X. Li. 2013. “Maritime Safety Analysis in Retrospect.” Maritime Policy & Management 40 (3): 261–277. doi:10.1080/03088839.2013.782952.
- Yang, Z. S., Z. L. Yang, J. B. Yin, and Z. H. Qu. 2018. “A Risk-based Game Model for Rational Inspections in Port State Control.” Transportation Research Part E: Logistics and Transportation Review 118: 477–495. doi:10.1016/j.tre.2018.08.001.
- Yeo, G., J. Pak, and Z. L. Yang. 2013. “Analysis of Dynamic Effects on Seaports Adopting Port Security Policy.” Transportation Research Part A: Policy and Practice 49: 285–301. doi:10.1016/j.tra.2013.01.039.
- Yuen, A. C., A. Zhang, and W. Cheung. 2013. “Foreign Participation and Competition: A Way to Improve the Container Port Efficiency in China?.” Transportation Research Part A: Policy and Practice 49: 220–231. doi:10.1016/j.tra.2013.01.026.
- Zadeh, L. A. 1975. “Introduction to Theory of Fuzzy Sets.” International Journal of General Systems 2 (1): 120–121. doi:10.1080/03081077508960848.
- Zhang, D., X. Yan, J. Zhang, Z. Yang, and J. Wang. 2016. “Use of Fuzzy Rule-based Evidential Reasoning Approach in the Navigational Risk Assessment of Inland Waterway Transportation Systems.” Safety Science 82: 260–352. doi:10.1016/j.ssci.2015.10.004.
- Zhang, Q., S. Zheng, H. Geerlings, and A. E. Makhloufi. 2019. “Port Governance Revisited: How to Govern and for What Purpose?.” Transport Policy 77: 46–57. doi:10.1016/j.tranpol.2019.03.001.
Appendix A. Fuzzy ratings, case of Port 1 from expert 2
Table
Appendix B. Transformed ratings, case of Port 1 from expert 2
Table
Appendix C. Fuzzy ratings, case of Port 1 from expert 3
Table
Appendix D. Transformed ratings, case of Port 1 from expert 3
Table