
 ?Mathematical formulae have been encoded as MathML and are displayed in this HTML version using MathJax in order to improve their display. Uncheck the box to turn MathJax off. This feature requires Javascript. Click on a formula to zoom.
ABSTRACT
The evolution of the single-hub container system in Southeast Asia into a multi-hub system, with several emerging container ports serving deep-sea container vessels and forming their feeder service network, may result in intense competition in the region and a transformation in the ports’ roles. Thus, major ports in the region have sought to enhance their competitiveness by offering improved cargo handling capabilities, well-developed infrastructure, and modernised facilities as well as increased service coverage and connectivity to more countries both directly and indirectly. Several major container ports in the area have taken full advantage of competitiveness to become new hub-ports in the area. To understand the dynamics of competition in this rapidly developing region more clearly, this paper presents an evaluation of connectivity of major ports. In addition, the competitiveness of the top ten Southeast Asian container ports is evaluated using the TOPSIS method and K-mean cluster analysis. The results indicate that the top ten ports are categorised into three groups, and while Singapore (Group 1) takes the most advantage of its connectivity, ports in Groups 2 and 3 may be able to enhance competitiveness by developing cargo handling facilities and infrastructure.
1. Introduction
In recent years, growth in the supply of container shipping has surpassed growth in demand (UNCTAD Citation2019), while several container ports have been modernised and are sufficiently flexible to serve larger container ships (Alix, Slack, and Comtois Citation1999; Gadhia, Kotzab, and Prockl Citation2011). Consequently, competition between container ports in attracting customers and improving their container throughput (or gaining market share) has increased dramatically, and a number of container ports have adopted strategies to improve their operating efficiency in the context of increasingly fierce competition (Woo et al. Citation2011; Woo, Pettit, and Beresford Citation2013).
One of the indexes of container port operational performance is the container throughput handled annually. This index depends on various factors such as the natural environment, hinterland economy, level of service at the seaport, seaport management policies, port facilities, and competition among neighbouring seaports or liner shipping networks (Cui, Huang, and Wang Citation2015; De Oliveira and Cariou Citation2015; Kang and Woo Citation2017; Yang, Chin, and Chen Citation2014).
Shipping line networks can influence a container port’s competitiveness through the ability of ports to connect with other each other within a region and worldwide. Southeast Asia is strategically located at the crossing of the Indian and Pacific Oceans. Thus, this region has certain advantages over other regions in terms of maritime connectivity. With almost 63,000 port calls in 2018, this port system has become a chokepoint in global shipping routes. Malaysia and Singapore are prominent within this system, with major container ports that can accommodate large container vessels with a carrying capacity of up to 21,413 twenty-foot equivalent units (TEU) (see ).
Table 1. Port call and performance statistics of regions in Southeast Asia.
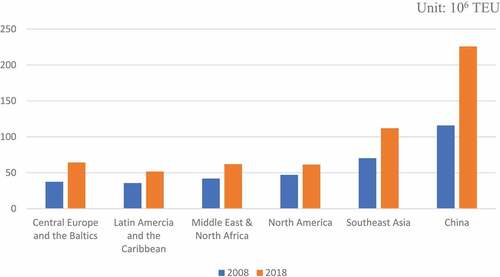
The Southeast Asian container port system has demonstrated significant growth and development for over a decade, playing a pivotal role in international trade and shipping. With a container throughput of over 110 million TEU in 2018 (accounting for approximately 14.6% of the global volume), it is one of the busiest container port systems in the world. The container volume of this region increased by over 40 million TEU over a period of ten years, which is considerably higher than the growth of other regions, except for China (see ). Maritime transport is an essential mode of transportation, carrying a massive volume of cargo in international trade. Southeast Asia has favourable geographical conditions for connectivity to the global market, and a majority of maritime shipping routes pass through the major ports in this region. The Port of Singapore is the second-largest container seaport in the world; it is a hub port dominating container throughput in the region. Besides Singapore, seven container ports (located in Malaysia, Thailand, Vietnam, Indonesia, and the Philippines) are listed among the top 50 global container ports. Some major container ports such as Port Klang, Tanjung Pelepas, Laem Chabang, and Saigon Newport are emerging as new competitors to Singapore and could become new hub ports (Boontaveeyuwat and Hanaoka Citation2010; Lam, Lee, and Yap Citation2008).
Figure 1. Container throughput by region in 2008 and 2018.
Specifically, the Port of Singapore, Port Klang and Tanjung Pelepas of Malaysia in the Strait of Malacca are the primary and secondary chokepoints in both core and secondary maritime shipping routes in this region. These are the top container ports in Southeast Asia, all with well-developed infrastructure. A port, regardless of its size, still needs to increase investment and expands its capacity to optimise its position. Further investment in more efficient operating capabilities and improved service quality are strategies that are widely adopted by many ports in this region to significantly improve their connectivity. The provision of efficient port services prompted major shipping lines (such as Maersk and Evergreen) to introduce new shipping routes that call at these ports (Yap and Notteboom Citation2011). For example, Port Klang and Tanjung Pelepas upgraded their existing facilities, infrastructure and scale by building new berths and container yards to handle over 20.8 million TEU in 2018 (UNCTAD Citation2019). Saigon Newport currently operates 18 terminals, and with state-of-the-art facilities it is the largest container port in Vietnam and the 25th largest port in the world.
Southeast Asia is one of the world’s most dynamic regions, and its ports are in continuous competition to connect to the global market. Therefore, a comparison of connectivity among the primary container ports in Southeast Asia using social network analysis (SNA) will provide a detailed insight into their competitiveness. Container throughput and port facilities can also affect competitiveness; therefore, as well as comparing the connectivity of major ports in Southeast Asia the study will examine the association of connectivity with container throughput and port facilities. Connectivity is evaluated using common indexes such as degree, betweenness, closeness, and hub centralities. The competitiveness level of ports is calculated using the Technique for Order of Preference by Similarity to Ideal Solution (TOPSIS) method.
The rest of the paper is structured as follows. Section 2 briefly reviews the literature on SNA used in seaport and port competitiveness studies. Section 3 presents the methodology used in this study and provides an explanation of some indexes that reflect the connectivity of ports, while also presenting the TOPSIS method. Section 4 presents evidence of the connectivity of container ports in the Southeast Asia region. The competitiveness of Southeast Asia’s container port system is discussed in Section 5. Finally, Section 6 concludes the paper.
2. Literature review
A container port can enhance its efficiency and attractiveness by identifying the importance of critical factors related to its competitiveness. Several studies have demonstrated geographic location, port facility, port cost, cargo volume, service level, price, and financial or port reputation to be key factors affecting a port’s competitiveness (Chang, Lee, and Tongzon Citation2008; Steven and Corsi Citation2012). Growth in container throughput is a potential factor that affects the choice of port, and its impact on port competition is studied by Lirn et al. (Citation2004). Moreover, the high rate of growth for cargo volume is a primary factor in bridging the container throughput gap among ports in the region. Well-developed infrastructure (in terms of berth length, number of cranes, total area, and depth) is critical to a container port for gaining market share. This allows the port to handle a greater volume of cargo, limit port congestion or overcapacity, and accommodate larger ships. Besides, the geographical location of a container port has a significant effect on the number of port calls because a propitious location can attract more shipping lines and lead to improved connectivity. Container ports with good connectivity are at an advantage compared with their competitors. The use of SNA can demonstrate the level of port connectivity in a network. Port connectivity is evaluated by Freeman’s indexes such as degree, closeness, and betweenness centrality (Wang and Cullinane Citation2016). Other indexes (such as the hub and authority indexes) are used to evaluate the level of port centrality.
It is also possible to use SNA to investigate social structures; for example, it has been used to study various disciplines such as mapping networks (Monaghan, Lavelle, and Gunnigle Citation2017), medical networks (Luke and Harris Citation2007), public transport networks (Shanmukhappa, Ho, and Tse Citation2018), and supply chain networks (Galaskiewicz Citation2011). Some studies have applied this method in the field of sea transportation to evaluate the efficiency of transportation, the importance or competition of container ports, and even the extent of cooperation in seaport research. For example, Woo, Kang and Martin (Citation2013) used SNA to examine a number of seaport studies published in international journals from 1980 to 2009 and explored the relationship between research collaboration and productivity in publishing international papers. The success of a port supply chain strongly depends on the degree of coordination and cohesion between the network members and its connectivity to other supply chains. Accordingly, SNA has been used to illuminate the research trend in port competition.
‘Port competition’ and ‘competitiveness’ are major keywords in studies during the period 1980 to 1999, while studies in the 2000s focus on keywords such as ‘container port’, ‘port competition’, and ‘China’. Further, more recent seaport research has focused on ‘port competition’, ‘cooperation’, and ‘supply chain’ (Jeon, Wang, and Yeo Citation2016). Analysing the data of 7,127 container services of the top 19 liner shipping lines operating at 20 major container ports from 2006 to 2011, Kang and Woo (Citation2017) found a relationship between container throughput and macroeconomic variables such as GDP and number of port berths, demonstrating that throughput is affected by the centrality of ports in networks. However, to achieve economy of scale, almost all shipping lines optimise their maritime shipping routes by only calling at a certain number of hub ports in each area. Therefore, gaining port centrality in a network is a significant challenge for small- and medium-sized ports. Using SNA to examine the connectivity of the Port of Incheon in South Korea with other container ports, Lu et al. (Citation2018) concluded that neighbouring ports strongly influence the throughput of small- and medium sized-ports, and that the strategy for these ports is to link to others close by. Furthermore, the level of port centrality depends on development policies in maintaining, improving, and expanding their infrastructure, or the ability of ports to attract more shippers and shipping lines (Ducruet, Lee, and Ng Citation2010).
The ultimate purpose of a port is to acquire competitive advantage and to gain market share from competitors. Accordingly, improving port competitiveness is an important strategy in port operation and management. Competitive advantage allows ports to attract more shippers and shipping companies (Woo et al. 2018). An analysis of port competitiveness would highlight the advantages and disadvantages of each container port. Besides, by ranking port competitiveness, port managers can identify the main factors impacting the choice of shipping companies. The TOPSIS method can indicate the specific rank of ports based on their competitive factors. Moreover, the entropy weight method identifies the importance of each factor. A mix of entropy weight method and TOPSIS is applied in this study to evaluate and rank port competitiveness.
3. Methods and data
3.1. Social Network Analysis
The use of SNA offers a traditional method with several advantages; for example, it enables one to visualise the entire network (Lovrić et al. Citation2018). This method reveals significant differences in position and power between the entities of a network. To examine the gap between nodes or to measure the level of connectivity of a node to other nodes in a network, Freeman (Citation1977) described three indexes: degree, closeness, and betweenness centrality. Because these indexes have limits in determining whether a node is at the centre of a network, they are supplemented with the hub and authority indexes to evaluate the degree of centrality of each node in a network (Kleinberg Citation1999a). The node with the highest hub and authority indexes is at the centre of the network and can strongly affect other nodes. In this paper, a node in the network is a port in the maritime shipping route.
3.1.1. Degree centrality
Degree centrality provides the structure of a network by indicating the number of port connections in the maritime shipping network (Tran and Haasis Citation2014). A port with a high degree centrality index is in the centre of the network. Degree centrality refers to the connectivity of a port to other ports and of other ports to this port. The degree centrality index can be calculated as shown in EquationEquations (1)(1)
(1) and (Equation2
(2)
(2) ).
Where are the in-degree and out-degree centrality of port i in binary ties, respectively,
give the connectivity from port j to port i and from port i to port j, respectively;
if port i is connected to port j;
if port i is not connected to port j,
is the degree centrality index of the ith port in the port network,
n is to the number of ports in the network, and
n-1 is the maximum number of ports a port can connect to.
3.1.2. Closeness centrality
Another useful index which is used to identify the central port in a complex shipping network is closeness centrality. This index evaluates the accessibility of a port in the network (Li, Xu, and Shi Citation2014). When a port is close to all the other ports in the shipping network, it can gain much more information, has more authority, and has a significant influence over other ports. The closeness centrality of a port is the ratio of the maximum number of ports that a port can link to and the sum of the shortest distances from a port to other ports in the network. The closeness index value ranges from 0 to 1. A closeness centrality value of 1 indicates that this port is closer to more ports than other ports, or vice versa. The formula of closeness centrality is defined as follows:
Where is the closeness centrality index of the ith port in the port network,
n gives the number of ports in the network,
n-1 is the maximum number of ports that a port can link to, and
dij is the number of legs in the shortest path connecting port i and port j.
3.1.3. Betweenness centrality
The ports in a network can be directly connected or connected via other ports. In the port system, betweenness centrality reflects the intermediary role of a port. To measure the accessibility of a port in the network, it compares the number of legs in the shortest route connecting two specific ports with the number of legs in the shortest route connecting the two ports via an appointed port (Hadas, Gnecco, and Sanguineti Citation2017). This index is calculated using the following equations:
Where
is the betweenness centrality of port i on binary ties,
n gives the number of ports in the network,
gijk is the number of legs of the shortest route connecting port j and port k that must call at port i,
gjk is the number of legs of the shortest route connecting port j and port k, and is the betweenness centrality index of port i.
3.1.4. Hub and authority indexes
The centrality level of each port can be reflected by other two indexes, namely the hub score and the authority score. Each port’s authority score is the sum of the hub scores of all ports that point to it, while each port’s hub score is the sum of the authority scores of all ports that it points to. Therefore, a high hub index indicates a port with good authority while a port is a good authority if good hub ports point to it (Kleinberg Citation1999b). In this study, high hub and authority centrality indexes refer to port centrality in the network.
3.2. Entropy weight method and TOPSIS
The TOPSIS was originally developed by Hwang and Yoon (Citation1981) and is one of the most popular methods in multi-criteria decision-making, due to its advantages of simplicity, rationality, comprehensibility, good computational efficiency and ability to measure the relative performance for each alternative in a simple mathematical form. The method has a wide area of application, including energy management, supply chain and logistics, water and waste resource management, manufacturing and design engineering, and business and industrial management. Moreover, it can be used to calculate and rank the competitiveness of container ports. To do this, it is important to identify the weight of factors that affect port competitiveness. Therefore, weight entropy is combined with TOPSIS to rank the port competitiveness. If m ports and n criteria affect the competitiveness of ports, xij is the jth value of port i (i from 1 to m and j from 1 to n). Thus, the index matrix is X = [xij]m×n.
3.2.1. Entropy weight method
The criteria weight is calculated as follows:
Step 1: Standardisation of data
The criteria are calculated from EquationEquation (6)(6)
(6) if they are beneficial. The cost indexes are determined from EquationEquation (7)
(7)
(7) (Li et al. Citation2011).
The new index matrix after standardising is X’ = [x’ij]m×n.
Step 2: Calculation of index entropy
Step 3: Calculation of index weight
3.2.2. TOPSIS method
The alternatives can be ranked by comparing the distances from them to the positive ideal solution (PIS) and the negative ideal solution (NIS) using TOPSIS. In this study, major ports in Southeast Asia are alternatives, and TOPSIS ranks the competitiveness of these ports. The best alternative is the solution closest to the PIS and furthest from the NIS (Pavić and Novoselac Citation2013). The TOPSIS steps are as follows:
Step 1: Normalisation of data:
The normalised matrix is R = [rij]m×n.
Step 2: Calculation of weighted normalised matrix:
The weighted normalised matrix is calculated by multiplying the normalised matrix with the index weight; and wi is calculated by entropy weight method.
Step 3: Determination of the PIS and the NIS:
PIS:
where
NIS:
where
Step 4: Calculation of the distance for each alternative:
The distance from the PIS is
The distance from the NIS is
Step 5: Calculation of the relative closeness to the ideal solution:
Step 6: Ranking the preference:
The alternatives are ranked based on the relative closeness to the ideal solution, where a higher evaluation alternative is better.
3.3. Data
The top ten liner shipping companies account for more than 81% of the world’s total capacity (https://alphaliner.axsmarine.com/PublicTop100), with over 19.3 million TEU; therefore, their maritime shipping routes have a strong effect on the connectivity of ports. In this study, the data from 825 maritime shipping routes of the top ten liner shipping companies and several other shipping lines operating in Southeast Asia’s container port system in 2019 is examined. The top ten liner shipping companies operate 664 service routes in this region (see ), with the remainder of the routes managed by smaller shipping companies such as Wan Hai Lines, SITC, KMTC, and the Orient Overseas Container Line (OOCL). The number of port calls is not mentioned in this dataset; accordingly, the connectivity between any two ports is considered as 1.
Table 2. The top ten shipping companies in 2019.
The competitiveness is calculated and ranked using TOPSIS. The competitiveness level is estimated based on three criteria: cargo volume (container throughput and growth of throughput), port facility (berth length, number of cranes, total area, depth), and centrality indexes (see ).
Figure 2. Port competitiveness factors for TOPSIS analysis.
The data on port facilities are collected from port websites and are presented in . The container throughput and throughput growth of these ports from 2008 to 2018 are provided in Appendix A.
Table 3. Facilities of the top ten container ports in Southeast Asia.
4. Analysis results
This study analyses the connectivity of port networks to identify the importance of ports in the network, as reflected by the degree, closeness, betweenness, hub, and authority centrality indexes. These indexes describe the structural position of each port in the network as determined by Netminer 4.4.3b. presents the degree, closeness, betweenness, hub, and authority centrality indexes of the top ten container ports in Southeast Asia.
Table 4. The connectivity index of the top ten container ports in Southeast Asia.
4.1. Degree centrality
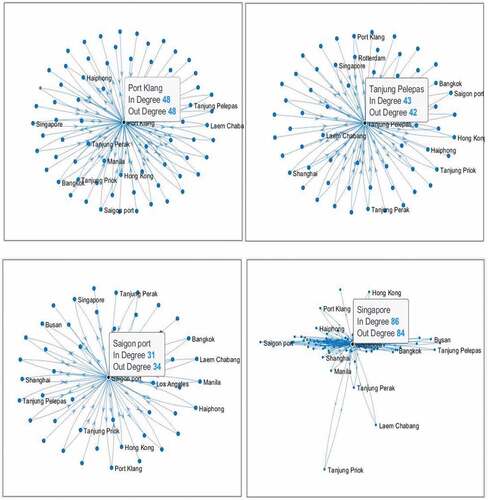
The data indicates that the top ten container ports in Southeast Asia can directly or indirectly connect to 257 ports. Almost all of these ports can directly connect to hub ports, such as Shanghai and Hong Kong. This illustrates the role of Southeast Asia’s container port system in connecting to ports in the area. The connectivity of the top ten container ports in the region is measured with significant differences. shows the connectivity of four container ports, where the level of connectivity of these port is higher than other ports. The selected Association of Southeast Asian Nations (ASEAN) ports are divided into three groups by degree centrality. The first group includes Singapore; which directly connects to 84 ports (out-degree), while 86 ports are connected to it (in-degree). Almost all maritime shipping routes call at this port. The second group includes Port Klang, Tanjung Pelepas, and Saigon Newport. The in-degree and out-degree of this group range from over 30 to nearly 50 ports. The in-degree and out-degree of the third group are both under 20 ports, indicating a significant gap between the third group and Singapore in terms of connectivity. The first and second groups are similar in terms of in-degree and out-degree centrality indexes. Thus, these ports are central nodes linking other ports. Haiphong and Tanjung Perak ports have limited connectivity to other ports because their in-degree centrality index is significantly lower than their out-degree centrality index.
Figure 3. Degree centrality on binary ties of some container ports in Southeast Asia.
4.2. Closeness centrality
The closeness centrality index analyses the centralisation of a port by reversing the sum of legs from this port to all the other ports. Therefore, the closer a port is to the centre of the network, the lower is its total distance to all other ports, or the higher is the closeness centrality index. This index is useful for comparing the closeness of ports located in other areas. This explains why the closeness centrality indexes of ten ports in Southeast Asia do not demonstrate a significant gap.
4.3. Betweenness centrality
The betweenness index values shown in illustrate the number of maritime shipping routes connecting the departure and destination ports via an appointed port. As with the degree centrality and closeness centrality indexes, the top four ports in terms of betweenness centrality indexes are Singapore, Port Klang, Tanjung Pelepas, and Saigon Newport; however, the betweenness centrality indexes of the ports from the second port onward are comparatively low. With a score of over 0.5 in the betweenness centrality index, Singapore is ranked first in the region, and is identified as the centre of Southeast Asia’s port system. This is because a number of shipping routes call at Singapore before proceeding to other ports. In addition, Singapore is the bridge between ports in the global maritime shipping network, which might control or affect other ports in the network. Singapore, Tanjung Pelepas, and Port Klang are on the Strait of Malacca, which provides easier access to European, Middle-East Mediterranean, American, and African markets than other ports in the area. Compared to Port Klang and Tanjung Pelepas, Singapore’s advantages make it the primary option for almost all shipping companies when they have to tranship. Although Singapore stands to retain dominant transhipment volume in the region, it is experiencing difficulties because of the formation and development of deep-sea ports in some other countries. More maritime shipping routes now call directly at ports in Malaysia, Vietnam, Indonesia, Thailand instead of Singapore.
4.4. Hub and authority index
Hub and authority centrality indexes are used to analyse the impact of ports on the network. The hub and authority centrality indexes of a port depend on whether that port is connected to or receives connectivity from high-impact ports. Therefore, a low in-degree and betweenness centrality index does not mean that the hub and authority centrality indexes are low. This is illustrated by the case of Saigon Newport. The degree, closeness, and betweenness centrality analyses of this port ranked it fourth (see ), although its hub and authority indexes are greater than those of Port Klang and Tanjung Pelepas. Saigon Newport’s hub and authority indexes ranked second in the region. This high hub and authority centrality means that Saigon Newport connects to high-impact ports. Singapore is dominant in the region with hub and authority centrality indexes ranked first with values of 0.328545 and 0.328023, respectively.
5. Analysis of the competitiveness of Southeast Asia’s port system
5.1. Shift from a single-hub to multi-hub system
Geographic advantage can enable a port to become an international hub because it can connect to other markets through its various shipping routes. Nguyen et al. (Citation2020) examined the ten largest container ports in Southeast Asia from 2007 to 2017, focusing on their relationship in the market, their competition, and efficiency. They found that Singapore is still the leading port in the region, despite competition from Port Klang, Tanjung Pelepas, and Saigon Newport. These ports are supported by their foreign partners and investors in attracting more calls from shipping companies. From their centrality indexes, the top ten container ports in Southeast Asia can be divided into three groups using K-Means clustering (see ). A higher level of connectivity with regional container ports and greater volume of container throughput are prerequisites for a port to become a hub port (Nam and Song Citation2011).
Figure 4. Categorisation of the top ten container ports in Southeast Asia based on connectivity.
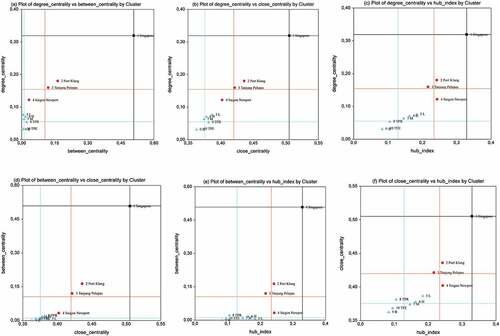
However, shows a dramatic difference in degree and betweenness centrality indexes between Singapore and the other ports in the region, indicating that Singapore holds an advantageous position in the shipping network. Compared to its competitors in the port system, Singapore has a more significant impact on both direct and indirect connection and intermediary roles. The difference in closeness centrality and hub and authority indexes is less between Singapore and the group 2 ports (including Port Klang, Tanjung Pelepas, and Saigon Newport). This suggests that the ports in group 2 and Singapore can easily access other markets. In particular, high hub and authority indexes indicate that these ports are linked to high-influence ports acting as connector hubs in the region and worldwide. Ports in group 2 may not be able to compete directly with Singapore; however, connectivity scores suggest that their connectivity is improving. This is also evidenced by some previous studies. By studying the port connectivity of the top 20 container ports, Kang (Citation2013) proved that Singapore is one of the most important hub ports both regionally and globally because the port connectivity index of Singapore ranked first in the top 20 largest container ports in both 2009 and 2011. However, centrality indexes of Port Klang and Tanjung Pelepas increased more rapidly than Singapore.
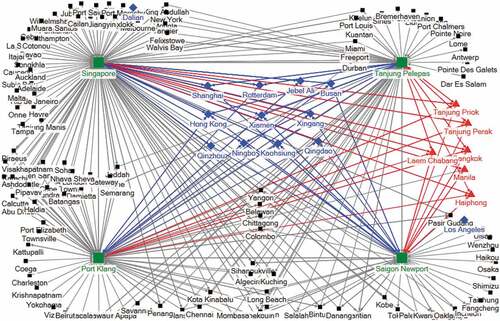
illustrates the direct connectivity of Singapore, Port Klang, Tanjung Pelepas, and Saigon Newport to other hub ports (including Shanghai, Hong Kong, Rotterdam, Ningbo, Qingdao, Qinchou, Kaoshiung, Xingxang, and Xiamen). These ports also have direct linkages to other major container ports in the region. Improvement in connectivity (by attracting an increasing number of shipping companies to call at their ports) can create a favourable condition for these ports in growing volumes of the container. Although the current container throughput of these ports is relatively small compared to Singapore, their growth rate in container volume is higher than Singapore. In addition, these ports are still investing and upgrading their infrastructure and facilities. All these factors have enabled Port Klang, Tanjung Pelepas, and Saigon Newport to become new hub ports in the region. Thus, it is suggested that the structure of Southeast Asia’s container port system is changing from a single-hub to a multi-hub port.
Figure 5. Connectivity of Singapore, Port Klang, Tanjung Pelepas, and Saigon Newport.
5.2. Competitiveness of Southeast Asia’s port system
The centrality indicators show that Singapore still dominates Southeast Asia’s port system, with all indicators ranking it first; its main competitors are Port Klang, Tanjung Pelepas, and Saigon Newport, all of which demonstrate a relatively large gap with Singapore. Increased connectivity enables ports to collect and exchange international shipping information and to attract very large transhipment cargo volumes. With favourable connectivity, the transhipment cargo volumes of Port Klang and Tanjung Pelepas are high. In 2018, of the 12.316 million TEU handled by Port Klang, 7.557 million TEU was transhipment cargo. The rate of transhipment cargo in Tanjung Pelepas is even higher, at 8.402 million TEU (of a total 8.960 million TEU). Therefore, ports can improve their competitiveness by raising their connectivity level.
However, the competitiveness of these ports varies when their cargo volume and port facilities are considered. presents the competitiveness level of major ports in the region by linking their centrality indexes with their port facility and container throughput. Throughput, facilities and connectivity scores are calculated using the entropy weight method and TOPSIS. Throughput score is defined by volume cargo and growth rate, while the calculation of facilities score is based on berth length, number of cranes, total area and depth of port. Centrality indexes are applied to compute the connectivity score. Then, these scores are used to determine the degree of competitiveness for 10 major container ports in Southeast Asia. By using the connectivity and competitive scores, the K-Mean algorithm divides the ten ports into three groups such that the Euclidean distance from each port to the centre of the group is minimum. Group 1 (including the Port of Singapore) is dominant for both indicators, while ports in group 3 are less dominant in both indicators. Connectivity and competition scores for the ports in group 2 are moderate and are higher than the figure for group 3 and lower than the figure for group 1.
Table 6. Competitiveness analysis results using the TOPSIS method.
A TOPSIS analysis of container throughput, port facility, and port connectivity shows that the Port of Singapore is the most important hub connecting the main hub ports in other regions and the Southeast Asia region, and is evaluated as the most competitive in every aspect. Singapore ranks first in all factors, with a competitiveness score significantly higher than that of other ports. This could be due to its market share dominance and high connectivity to the maritime shipping routes. Through a comparison of the hub port selection criteria, Kavirathna, Kawasaki, and Hanaoka (Citation2018) show that Singapore is more competitive than Port Klang, Tanjung Pelepas, and Colombo port in the Strait of Malacca. However, Port Klang and Tanjung Pelepas are implementing strategies to reduce the domination of Singapore in the region. Along with the expanding scale and investment in the facility, these container ports have plans to deepen their draught, which will allow the accommodation of larger container vessels.
The second group includes three ports: Port Klang, Saigon Newport, and Tanjung Pelepas (see )). With regard to connectivity and competitiveness, connectivity scores range from 0.3650 to 0.4819, demonstrating that these ports demonstrate high connectivity. Located in the Strait of Malacca, Port Klang has connectivity to the other ports; this is one of the advantages of this port. In addition, implementation of the port development and investment project in Jakarta area has enabled Port Klang to handle an annual capacity of up to 18 million TEU and accommodate container ships with size up to 18,000 TEU (Jayanthi and Damayanti Citation2015). Thus, the port facility and connectivity scores of Port Klang are high, making this port the second-most competitive port of the Southeast Asia region. With a container throughput score of 0.4399, Port Klang shows a rebound in container throughput after losing business to Singapore at the Strait of Malacca. Although Saigon Newport has no particular advantage in container throughput, port facilities and connectivity, the balance in these indexes increases its ranking to third for competitiveness. Regular shipping calls enable Saigon Newport to expand its container volumes. The average growth in throughput for this port from 2009 to 2018 was the highest recorded in the region, at 7.83% (see Appendix A). By cooperating with more than 100 shipping companies and agents worldwide and connecting to over 110 ports, Saigon Newport could raise its connectivity score to 0.365 to rank 5th in the region (see ). Saigon Newport can become one of the most important hubs of the region by linking to the different ports in the region and the globe’s biggest economies. A number of shipping companies’ newly introduced maritime services call at Saigon Newport; for example, Yangming, OOCL, and Regional Container Lines with their China-Ho Chi Minh express service, South Korean SM Line with its Thailand–Vietnam service, and American President Lines (APL) with its Japan–Malaysia–Vietnam service. Tanjung Pelepas is the third-largest container port in the region, but its competitiveness score is ranked fifth in the region. Thus, the result from competitive factor scores indicates that the port’s facility should be improved.
Figure 6. Categorisation of major container ports in Southeast Asia based on connectivity, facilities, and competitiveness.
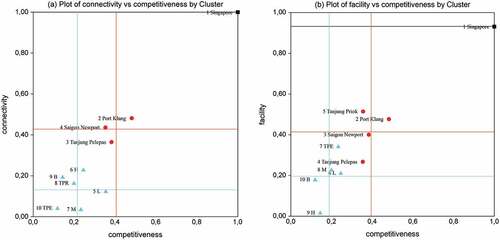
The other ports are much less competitive than those in groups 1 and 2, particularly Bangkok and Haiphong. Laem Chabang port has an advantage in container throughput, and is ranked second; however, the competitive score of this port is relatively low, ranking sixth in the region with a score of 0.2453. From its facilities and competitiveness, Tanjung Priok port can be considered a special case because it is located in group 2 (see ). The competitiveness score of this port ranks fourth in the region, its competitive edge mainly due to its port facility score of 0.5143 (ranked second). However, this port’s highly competitive score does not reflect its current situation. Tanjung Priok has a high port facility score because it operates in overcapacity. However, this results in many port users complaining about costly delays and lack of container capacity. Tanjung Priok port is trying to improve its infrastructure and increase its capacity, but still cannot meet the rapidly increasing demand for container shipping services. The Tanjung Priok development plan has three container terminals, although only one (with a capacity of 1.5 million TEU) has been commissioned.
6. Conclusion
This study investigates the connectivity of ten major container ports in Southeast Asia by analysing several relevant indexes, such as degree centrality, closeness centrality, betweenness centrality, and hub and authority indexes. The study also applies the TOPSIS method to rank the competitiveness of these ports based on cargo volume, port facility, and connectivity score. Connectivity and competitiveness analyses show that the top ten container port in Southeast Asia can be divided into three groups: (1) Singapore; (2) Tanjung Pelepas, Port Klang, and Saigon Newport; and (3) Tanjung Priok, Laem Chabang, Manila, Haiphong, and Bangkok. Singapore is a hub port, the most vital port in Southeast Asia, and Port Klang, Tanjung Pelepas, and Saigon Newport are also important container ports of the region. Connectivity, port facilities and cargo volume are the main factors in positioning Singapore as the most competitive container port in the region. Ports in the second group are potential competitors to Singapore, with varied competitive edges. Ports in the third group are much less competitive in almost all criteria compared to ports in the other groups.
This result also demonstrates that for ports located in a favourable position (such as Singapore and Port Klang), port connectivity is an advantage. However, other ports (not located in a strategical location) can improve their competitiveness by raising their port facility and cargo volume scores. Although a wide gap in competition still exists between Singapore and the ports in group two, these ports can exploit their advantages to become new hub ports in the region. The fierce competition between Singapore and the ports in group 2 has upgraded Southeast Asia’s container port system from a single-hub to a multi-hub port system.
This study contributes significantly to the literature by not only identifying connectivity of major container ports in Southeast Asia but also by combining connectivity with other factors to evaluate port competitiveness. The scope of this study may be extended by adding other factors, such as port management, port cost, service level, and port hinterland. This would evaluate the competitiveness of Southeast Asia’s container ports more precisely.
Disclosure statement
No potential conflict of interest was reported by the authors.
Additional information
Funding
References
- Alix, Y., B. Slack, and C. Comtois. 1999. “Alliance or Acquisition? Strategies for Growth in the Container Shipping Industry, the Case of CP Ships.” Journal of Transport Geography 7 (3): 203–208. doi:10.1016/S0966-6923(98)00048-9.
- Boontaveeyuwat, P., and S. Hanaoka. 2010. “Analysing the Optimal Location of a Hub Port in Southeast Asia.” International Journal of Logistics Systems and Management 6 (4): 458–475. doi:10.1504/IJLSM.2010.032948.
- Chang, Y. T., S. Y. Lee, and J. Tongzon. 2008. “Port Selection Factors by Shipping Lines: Different Perspectives between Trunk Liners and Feeder Service Providers.” Marine Policy 32 (6): 877–885. doi:10.1016/j.marpol.2008.01.003.
- Cui, W., L. Huang, and Y. Wang. 2015. “Port Throughput Influence Factors Based on Neighborhood Rough Sets: An Exploratory Study.” Journal of Industrial Engineering and Management 8 (5): 1396–1408. doi:10.3926/jiem.1483.
- De Oliveira, G. F., and P. Cariou. 2015. “The Impact of Competition on Container Port (In)efficiency.” Transportation Research Part A: Policy and Practice 78: 124–133. doi:10.1016/j.tra.2015.04.034.
- Ducruet, C., S. W. Lee, and A. K. Y. Ng. 2010. “Centrality and Vulnerability in Liner Shipping Networks: Revisiting the Northeast Asian Port Hierarchy.” Maritime Policy & Management 37 (1): 17–36. doi:10.1080/03088830903461175.
- Freeman, L. 1977. “A Set of Measures of Centrality Based on Betweenness.” Sociometry 40 (1): 35–41. doi:10.2307/3033543.
- Gadhia, H., H. Kotzab, and G. Prockl. 2011. “Levels of Internationalization in the Container Shipping Industry: An Assessment of the Port Networks of the Large Container Shipping Companies.” Journal of Transport Geography 19 (6): 1431–1442. doi:10.1016/j.jtrangeo.2011.07.016.
- Galaskiewicz, J. 2011. “Studying Supply Chains from a Social Network Perspective.” Journal of Supply Chain Management 47 (1): 4–8. doi:10.1111/j.1745-493X.2010.03209.x.
- Hadas, Y., G. Gnecco, and M. Sanguineti. 2017. “An Approach to Transportation Network Analysis via Transferable Utility Games.” Transportation Research Part B: Methodological 105 (C): 120–143. doi:10.1016/j.trb.2017.08.029.
- Hwang, C.-L., and K. Yoon. 1981. “Methods for Multiple Attribute Decision Making.” In Lecture notes in Economics and Mathematical Systems. Springer, Berlin, Heidelberg, 58-191.
- Jayanthi, G. D., and S. M. Damayanti. 2015. “Feasibility Analysis of New Priok Port Project Phase 2 of Indonesia Port Corporation Ii.” Journal of Business and Management 4 (5): 594–605.
- Jeon, J. W., Y. Wang, and G. T. Yeo. 2016. “SNA Approach for Analyzing the Research Trend of International Port Competition.” Asian Journal of Shipping and Logistics 32 (3): 165–172. doi:10.1016/j.ajsl.2016.09.005.
- Kang, D. J. 2013. A Study on the Impact of Liner Shipping Network Index on Port Competitiveness. Chung-Ang University.
- Kang, D. J., and S. H. Woo. 2017. “Liner Shipping Networks, Port Characteristics and the Impact on Port Performance.” Maritime Economics and Logistics 19 (2): 274–295. Palgrave Macmillan UK. doi:10.1057/s41278-016-0056-2.
- Kavirathna, C. A., T. Kawasaki, and S. Hanaoka. 2018. “Transshipment Hub Port Competitiveness of the Port of Colombo against the Major Southeast Asian Hub Ports*.” Asian Journal of Shipping and Logistics 34 (2): 71–82. Elsevier B.V. doi:10.1016/j.ajsl.2018.06.004.
- Kleinberg, J. M. 1999a. “Hubs, Authorities, and Communities.” ACM Computing Surveys 31 (4es): 5. doi:10.1145/345966.345982.
- Kleinberg, J. M. 1999b. “Authoritative Sources in a Hyperlinked Environment.” Journal of the ACM 46 (5): 604–632. doi:10.1145/324133.324140.
- Lam, J., S. Lee, and W. Y. Yap. 2008. “Competition for Transhipment Containers by Major Ports in Southeast Asia: Slot Capacity Analysis.” Maritime Policy & Management 35 (1): 89–101. doi:10.1080/03088830701849043.
- Li, X., K. Wang, L. Liuz, J. Xin, H. Yang, and C. Gao. 2011. “Application of the Entropy Weight and TOPSIS Method in Safety Evaluation of Coal Mines.” Procedia Engineering 26: 2085–2091. doi:10.1016/j.proeng.2011.11.2410.
- Li, Z., M. Xu, and Y. Shi. 2014. “Centrality in Global Shipping Network Basing on Worldwide Shipping Areas.” GeoJournal 80 (1): 47–60. doi:10.1007/s10708-014-9524-3.
- Lirn, T. C., H. Thanopoulou, M. J. Beynon, and A. Beresford. 2004. “An Application of AHP on Transhipment Port Selection: A Global Perspective.” Maritime Economics and Logistics 6 (1): 70–91. doi:10.1057/palgrave.mel.9100093.
- Lovrić, M., R. Da Re, E. Vidale, D. Pettenella, and R. Mavsar. 2018. “Submission of an Original Research Paper: Social Network Analysis as a Tool for the Analysis of International Trade of Wood and Non-Wood Forest Products.” Forest Policy and Economics 86: 45–66. doi:10.1016/j.forpol.2017.10.006.
- Lu, W., S. H. Park, J. G. Oh, and G. T. Yeo. 2018. “Network Connection Strategy for Small and Medium-Sized Ports (Smps).” Asian Journal of Shipping and Logistics 34 (1): 19–26. doi:10.1016/j.ajsl.2018.03.003.
- Luke, D., and J. K. Harris. 2007. “Network Analysis in Public Health: History, Methods, and Applications.” Annual Review of Public Health 28 (1): 69–93. doi:10.1146/annurev.publhealth.28.021406.144132.
- Monaghan, S., J. Lavelle, and P. Gunnigle. 2017. “Mapping Networks: Exploring the Utility of Social Network Analysis in Management Research and Practice.” Journal of Business Research 76: 136–144. doi:10.1016/j.jbusres.2017.03.020.
- Nam, H. S., and D. W. Song. 2011. “Defining Maritime Logistics Hub and Its Implication for Container Port.” Maritime Policy & Management 38 (3): 269–292. doi:10.1080/03088839.2011.572705.
- Nguyen, P. N., S. H. Woo, A. Beresford, and S. Pettit. 2020. “Competition, Market Concentration, and Relative Efficiency of Major Container Ports in Southeast Asia.” Journal of Transport Geography 83 (83): 102653. Elsevier. doi:10.1016/j.jtrangeo.2020.102653.
- Pavić, Z., and V. Novoselac. 2013. “Notes on TOPSIS Method.” International Journal of Research in Engineering and Science 1 (2): 5–12.
- Shanmukhappa, T., I. W. H. Ho, and C. K. Tse. 2018. “Spatial Analysis of Bus Transport Networks Using Network Theory.” Physica A: Statistical Mechanics and Its Applications 502: 295–314. doi:10.1016/j.physa.2018.02.111.
- Steven, A., and T. Corsi. 2012. “Choosing a Port: An Analysis of Containerized Imports into the US.” Transportation Research Part E: Logistics and Transportation Review 48 (4): 881–895. doi:10.1016/j.tre.2012.02.003.
- Tran, N. K., and H. D. Haasis. 2014. “Empirical Analysis of the Container Liner Shipping Network on the East-West Corridor (1995–2011).” NETNOMICS: Economic Research and Electronic Networking 15 (3): 121–153. doi:10.1007/s11066-014-9088-x.
- UNCTAD. 2019. Review of Maritime Transport 2019. United Nations Publications New York: United Nations, Geneva.
- Wang, Y., and K. Cullinane. 2016. “Determinants of Port Centrality in Maritime Container Transportation.” Transportation Research Part E: Logistics and Transportation Review 95: 326. doi:10.1016/j.tre.2016.04.002.
- Woo, S. H., D. J. Kang, and S. Martin. 2013. “Seaport Research: An Analysis of Research Collaboration Using Social Network Analysis.” Transport Reviews 33 (4): 460–475. doi:10.1080/01441647.2013.786766.
- Woo, S. H., S. Pettit, and A. Beresford. 2013. “An Assessment of the Integration of Seaports into Supply Chains Using a Structural Equation Model.” Supply Chain Management: An International Journal 18 (3): 235–252. doi:10.1108/SCM-09-2011-0264.
- Woo, S. H., S. Pettit, D. W. Kwak, and A. Beresford. 2011. “Seaport Research: A Structured Literature Review on Methodological Issues since the 1980s.” Transportation Research Part A: Policy and Practice 45 (7): 667–685. doi:10.1016/j.tra.2011.04.014.
- Yang, D., A. Chin, and S. Chen. 2014. “Impact of Politics, Economic Events and Port Policies on the Evolution of Maritime Traffic in Chinese Ports.” Maritime Policy & Management 41 (4): 346–366. doi:10.1080/03088839.2013.784399.
- Yap, W. Y., and T. Notteboom. 2011. “Dynamics of Liner Shipping Service Scheduling and Their Impact on Container Port Competition.” Maritime Policy & Management 38 (5): 471–485. doi:10.1080/03088839.2011.597451.