
ABSTRACT
China is ranked as the number one maritime connected country in the world. This study attempts to analyse the characteristics of its 155 maritime trading partners. Five components of maritime connectivity have been used for the analysis. A hierarchical clustering technique is applied to group the trading partners into distinct meaningful clusters. As China’s main maritime competitors within the East Asian region, the analysis is also applied to Singapore and Hong Kong. The clustering technique produces three distinct clusters for China and Singapore and two for Hong Kong. The results reveal the importance of direct maritime connectivity, with China having the highest number of trading partners with zero transhipment (including its top 15 trading partners), compared to Singapore and Hong Kong. The analysis is further extended by applying ordered logistic regression. The results show that the logistic performance index (LPI) and exports/imports have a positive and significant influence on clusters. Conclusions are drawn as to the potential for implementing strategies and policy interventions on the basis of the emergent clusters, particularly the need for Hong Kong to improve all five components of maritime connectivity in order to compete with China and Singapore.
1. Introduction
The maritime network is a complex phenomenon, and the literature contains several diverse definitions of this concept. In a review paper, Ducruet (Citation2020) explored the development of the maritime network concept in geography and other disciplines. The study showed that the development of the concept has involved a wide variety of methods and subjects classified into three categories. The first category analyzes the development of maritime networks from maritime flows. The reviewed studies in this category have focused on the morphology of maritime flows, the topology of the graph made up of nodes and connections, and shipping firms’ networks and strategies. The second category revolves around spatial structures and the dynamics of maritime networks. Studies reviewed under this category consider maritime routes and networks as representative and vectors of a broader phenomenon, such as regional inequalities and areas of dominance. The third category considers the territorial embedding of maritime networks and recommends that maritime networks be examined as integral parts of the territories and broader chained systems. In its broadest sense, however, connectivity is defined as the ways or possibilities for people, firms, and countries to connect and to facilitate international trade, communication, and finance. Hoffmann, Saeed, and Sødal (Citation2020) explain the difference between ‘network’ and ‘connectivity,’ by stating that ‘connectivity measures the strength of the network.’ Following Hoffmann, Saeed, and Sødal (Citation2020), this work also uses the concept ‘connectivity’ to explain ‘a country’s position within the liner shipping network’ and does not explore or discuss the maritime network.
China, Singapore and Hong Kong are all significant maritime centres that are heavily engaged in international trade and all possess very high levels of maritime connectivity. Their strong maritime connectivity is reflected in UNCTAD’s calculations of both the liner shipping connectivity index (LSCI) and the liner shipping bilateral connectivity index (LSBCI). In addition, however, they are also in direct economic competition with each other within the East Asian region. Their economic well-being and the competition that exists between China, Singapore and Hong Kong is because of the established relationship between maritime connectivity, transport cost and bilateral trade (Wilmsmeier and Hoffmann Citation2008; Fugazza and Hoffmann Citation2017; Clark, Dollar, and Micco Citation2004). Thus, in an effort to boost trade and economic development, each of them is likely to be motivated to develop strategies for generally enhancing their level of maritime connectivity. Referencing the variables that comprise the LSBCI may be helpful in this. However, the potential also exists for developing strategies which are more targeted. Given the significant number of trading partners involved for all three maritime centres, the development of specific strategies for enhancing maritime connectivity along individual bilateral trading links would appear to be rather intractable. Much easier to implement, and infinitely preferable therefore, would be strategies for enhancing the maritime connectivity of a group of bilateral trading partners that somehow share some degree of similarity in maritime connectivity. The existence of the LSBCI and, in particular, the nature and availability of data on the five variables that comprise it, points to the application of cluster analysis as the most suitable vehicle for developing taxonomies or classifications of bilateral trading partners on the basis of their maritime connectivity with the focal maritime centre.
The objective of this paper is to apply cluster analysis to the data on each of the five variables that comprise the LSBCI for the trading partners of China, Singapore and Hong Kong and, thereby, to develop a suitably parsimonious taxonomy that facilitates the classification of individual trading partners on the basis of their maritime connectivity with the focal maritime centre. The analysis is further extended by applying ordered logistic regression on the obtained clusters. The reason for selecting ordered logistic regression is that the dependent variable (clusters) represents different categories of connectivity.
The logistics performance index (LPI) of 155 trading partners for China, Singapore, Hong Kong and their trade (exports and imports) are selected as independent variables. The reasons for selecting these variables are that the LPI captures the logistics performance of countries and a good logistics performance increases the competitiveness of countries in international market. Similarly, because of economies of scale and enhanced competition, trade contributes to reduced transport costs and improved connectivity. Thus, it is expected that the countries with a higher LPI and trade volume are more likely to be in a cluster with higher connectivity.
This study contributes as follows: i) this is the first study in which five components of the LSBCI are used to identify the characteristics of the maritime trading partners of China, Singapore and Hong Kong; ii) In terms of methodology, in addition to hierarchical cluster analysis, ordered logistic regression models are applied to evaluate the impact of the LPI and trade on clusters.
To this end, the ensuing section provides a review of the literature where cluster analysis has been applied within the maritime context. Section 3 provides a comprehensive exposition of cluster analysis as the chosen methodology for achieving the main objectives of the work. Section 4 summarises the results and conclusions are drawn in section 5.
2. Literature review
With its origins in anthropology and psychology, cluster analysis was pioneered by Driver and Kroeber (Citation1932), Zubin (Citation1938), and Cattell (Citation1943). The nature of shipping organisations has provided one area of research interest where cluster analysis has been applied. For example, based on the outcomes from a factor analysis, Lu (Citation1999) developed a set of key strategic factors relevant to the development of Taiwan’s shipping industry. With the aim of classifying shipping companies, shipping agencies and ocean freight forwarders in terms of these strategic variables, cluster analysis was then applied. Four strategic clusters emerged, with significant differences between them identified across the key strategic variables. González-Torre, Sarkis, and Adenso-Díaz (Citation2013) apply cluster analysis to the identification of different groupings of shipping agents in Spain. The study classified the sample into four major groups, for which different marketing and operational implications were developed for both the shipping agents themselves and for shippers.
Yang and Wong (Citation2016) applied cluster analysis in order to segment the approaches to environmental management and the performance outcomes of different environmental strategies within Taiwan’s container shipping sector. Three clusters were identified, and a more disaggregated analysis of variance (ANOVA) indicated that: (i) environmental auditing and purchasing oriented firms exhibited the best environmental performance among the clusters; (ii) environmental commitment-oriented firms possessed the best non-financial performance, and; (iii) environmental collaboration oriented firms had the best financial performance.
Another fertile arena for the application of cluster analysis has been the port sector. For example, on the basis of four inputs to the production process and a single output (container throughput), Wu, Liang, and Song (Citation2010) conduct a Data Envelopment Analysis (DEA) to obtain estimates of the relative efficiency of 77 global container ports in 2007. They then use cluster analysis to identify the most appropriate targets and benchmark ports for the clusters of the most poorly performing ports to aim for.
Cabral and de Sousa Ramos (Citation2014) applied cluster analysis to seventeen Brazilian container terminals. They used selection criteria for measuring port competitiveness, with the container terminals under study classified into three distinct groups based on these selection criteria. The results showed that the best algorithm is the Hierarchical and that the terminal of Tecon in the port of Santos was the most competitive terminal. Small terminals were found to be the least competitive terminals in Brazil. Fancello et al. (Citation2014) selected 34 major Mediterranean container ports and applied hierarchical cluster analysis to classify them into different clusters relating to their technical, management, organizational and geographical characteristics.
Using data relating to the input parameters for the estimation of port cost functions, Tovar and Rodríguez-Déniz (Citation2015) applied cluster analysis to a sample of Spanish ports. Three major clusters and five outlier ports emerged from the analysis, with the conclusion drawn that this provided a robust classification system that would prove to be a useful tool for decision-makers. Using a seasonal variation index (SVI) as an input variable, Esteve-Perez and Garcia-Sanchez (Citation2017) conducted a cluster analysis in order to classify a sample of 13 ports on the Spanish Mediterranean coast. The results suggested two clusters; one consisting of five ports that were characterised by a seasonal pattern with only one peak season during the year, while the second cluster consisted of eight ports that were characterised by a seasonal pattern with two peak seasons during the year. Most recently, Ke and Wang (Citation2017) applied cluster analysis for developing a taxonomy of the eight main Chinese port cities. Based on a range of influencing factors, they used the emergent groupings as the basis for identifying the pros and cons associated with individual groups of shipping centres, to determine their relative competitiveness and, ultimately, to develop a shipping centre competitiveness evaluation index system.
There have also been a few applications of cluster analysis to the maritime arena that could be construed as being more directly relevant to the objectives of this work. For example, Cullinane and Wang (Citation2012) applied Multiple Linkage Analysis (MLA) to determine a port hierarchy within a network in order to understand inter-port competition in East Asia. A hierarchical clustering analysis was applied in order to classify the sample of ports into three categories: local, regional, and international, on the basis of the geographical level of shipping services offered by each of the ports.
Using 357 cities in China as the origins of freight cargoes and eight overseas regions as the destinations, Guo and Yang (Citation2018) apply cluster analysis to identify categories of locations within China where different policies can be implemented for expanding export-oriented industry and to optimize the operations of port and shipping industries. In a similar study by Kutin, Guillotreau, and Vallée (Citation2018), the level of competition on 153 liner shipping routes is analysed by applying cluster analysis. Clusters of maritime routes are identified on the basis of two key dimensions which relate (fundamentally) to: (i) the number of competing firms on a route, and; (ii) a situation where the average size of firms is positively correlated with distance. The authors conclude that while the former is indicative of the degree of competition, the latter closely relates to carrier efficiency.
The literature on the application of cluster analysis in the maritime sector is vast. However, the focus of these studies was on just a few specific areas. For instance, to identify the characteristics of shipping firms (Lu Citation1999; González-Torre, Sarkis, and Adenso-Díaz Citation2013; Yang and Wong Citation2016), to evaluate the efficiency and competitiveness of ports (Wu, Liang, and Song Citation2010; Cabral and de Sousa Ramos Citation2014; Fancello et al. Citation2014; Tovar and Rodríguez-Déniz Citation2015; Ke and Wang Citation2017; Cullinane and Wang Citation2012) and to determine the characteristics of cruise traffic seasonality (Esteve-Perez and Garcia-Sanchez Citation2017). None of these studies have analyzed the characteristics of the maritime trading partners based on maritime connectivity. Only one study by Kutin, Guillotreau, and Vallée (Citation2018) has explored the characteristics of maritime routes. However, they have used port level connectivity data (153 container ports in 50 countries) and the aggregate index (LSBCI) values, rather than the five components of the LSBCI. In this study, we have used the country level data for 155 trading partners and the five components of LSBCI rather than relying only on the index.
Previous studies have combined other methods with cluster analysis (see Lu Citation1999; Yang and Wong Citation2016; Wu, Liang, and Song Citation2010; Tovar and Rodríguez-Déniz Citation2015; Esteve-Perez and Garcia-Sanchez Citation2017; Ke and Wang Citation2017; Cullinane and Wang Citation2012; Kutin, Guillotreau, and Vallée Citation2018). However, none of them have estimated the impact of other variables on the clusters obtained. In this study, after applying cluster analysis to determine the distinct clusters, an ordered logit regression analysis has been uniquely applied to estimate the impact of exports, imports, and the LPI on each of the three emergent clusters.
3. Methodology
3.1. Bilateral shipping connectivity
To reflect maritime connectivity, in 2004, the United Nations Conference on Trade and Development (UNCTAD) developed the LSCI. The purpose of building the LSCI was to give an overview of a country’s placement within the international liner shipping network. To achieve this objective, the connectivity index was generated at the country level, rather than at the port level.
In an attempt to provide an analytical focus on the degree of bilateral connectivity between country pairs which do not have direct maritime services linking them, UNCTAD has gone on to develop the more specific LSBCI (Hoffmann, van Hoogenhuizen, and Wilmsmeier Citation2014; Fugazza and Hoffmann Citation2016) which represents an extension of LSCI and is based on bilateral transformation (Fugazza and Hoffmann Citation2017). The differences between the LSCI and the liner shipping bilateral connectivity index (LSBCI) are as follows: the LSCI lacks the bilateral aspect of maritime connectivity. For instance, as pointed out in UNCTAD (Citation2017), less than 20% of coastal country pairs in the world can trade with each other with zero transhipment. Although the absence of direct maritime connection hinders the trade between any two countries (Hoffmann, Saeed, and Sødal Citation2020), thanks to containerization and transhipment, however, any country can still move products to/from their trading partners, even if there is no direct connection between them. To cover this aspect, the number of transhipments is included as a component of the LSBCI, since this was missing in the LSCI. The LSCI generates merely a single index value per country which summarises the aggregate maritime connectivity of that country across the whole of its port sector. In contrast, because the LSBCI revolves around the strength of a country’s bilateral maritime connectivity with actual and potential trading partner countries, 160 values per country are generated (UNCTAD Citation2017).
Data on the following five variables are required in order to generate values for any country’s LSBCI: (i) The minimum number of transhipments needed to ship a product between a country pair i and j; (ii) The total number of services with zero transhipment provided by third countries to both countries i and j; (iii) The geometric average of the total number of direct services to both countries i and j; (iv) The size of the largest ship (measured in TEUs) serving on the shipping route between the country pair and; (v) The total number of shipping lines operating on the shipping routes between the two countries (this variable reflects the degree of competition on the route) (Hoffmann, Saeed, and Sødal Citation2020). UNCTAD has retrospectively developed LSBCI values for a population of 160 nations for the years 2006, 2010 and 2016.
Among the top twenty-five country pairs in 2016, six country pairs include China. In 2016, China exported US$ 1,990 billion worth of goods (in value). This places it as the number one exporting country in the world, followed by the USA and Germany.
3.2. Background to cluster analysis
The question of how best to organise observed data into meaningful structures or taxonomies constitutes an eponymous research problem. As one prospective solution, the concept of clustering relates to the task of grouping a set of objects in such a way that objects in the same group (called a cluster) are more similar to each other than to those in other groups or clusters (Jajuga, Sokolowski, and Bock Citation2002). However, it does not refer to a single specific routine, procedure or algorithm, but rather to the general task to be solved. As such, cluster analysis constitutes merely a class of techniques comprising different algorithms and methods that are used to classify objects that are deemed to be relatively ‘similar’ into their respective categories or clusters. It has also been referred to as classification analysis (Ball Citation1970) or numerical taxonomy (Sneath and Sokal Citation1962).
Cluster analysis comprises, therefore, a set of multivariate tools and techniques which constitute an approach to exploratory data analysis that aims at sorting a set of different objects into groups, such that the degree of association between any pair of objects is maximal if they belong to the same group and minimal if they do not. This is achieved on the basis of analysing a set of measured variables relating to the data objects and categorising the objects into a number of different groups such that similar objects are placed in the same group. As an exercise in data mining, therefore, cluster analysis is employed solely in order to discover structures in data, without any requirement to provide an explanation or interpretation of the emergent structures. Unlike many other statistical procedures, there exists no a priori information or hypotheses about the group or cluster membership for any of the objects under study (Abonyi and Feil Citation2007). However, because cluster analysis does not encompass any form of mechanism for differentiating between what are relevant and irrelevant variables, it is vitally important that the choice of the variables considered within a cluster analysis is underpinned by conceptual considerations. This is because the emergent clusters that are formed as outputs from the analysis may be heavily dependent on the nature of the variables included (Romesburg Citation2004).
Despite the variety of different specific forms, a cluster analysis might take (Jain and Dubes Citation1988), there are a standard set of generic stages that are involved when implementing a cluster analysis in practice: problem formulation; selecting a distance measure; selecting a clustering procedure; deciding the number of clusters; interpreting the profile clusters and finally; assessing the validity of the clustering process. The variables upon which the cluster analysis is to be based should be selected by keeping past research in mind and should be informed by theory and the hypotheses being tested, as well as by the judgment and experiences of the researcher(s) (Anderberg Citation1973).
Many different clustering models have been promulgated, with each model comprising a different set of algorithms (Jain and Dubes Citation1988). There exists no objectively ‘correct’ clustering model or algorithm to be applied within a given context. The most appropriate clustering algorithm to apply, as well as associated parameter settings (such as the distance function, density threshold or the number of expected clusters) will all depend on the individual dataset for analysis and the intended use of the results (Aldenderfer and Blashfield Citation1984). To reiterate, therefore, cluster analysis is not an automatic task but, rather, an iterative process that inevitably involves trial and error (Everitt. Citation2011). The available methods for conducting a cluster analysis can broadly be classified as hierarchical or non-hierarchical. We have used hierarchical method in this study.
4. Results
According to UNCTAD (Citation2019), China is the number one connected country in the world. A hierarchical clustering analysis has firstly been applied to China and its 155 trading partners. As significant competitor maritime centres within the region, the analysis was replicated for both Singapore and Hong Kong. The data for five components of maritime connectivity (Numtrans, CommonConnect, Position, Shipsize, and NmaxCarrier) for China, Singapore and Hong Kong was provided by UNCTAD for the year 2016. The results for each of these maritime centres is presented in the following sections.
4.1. China
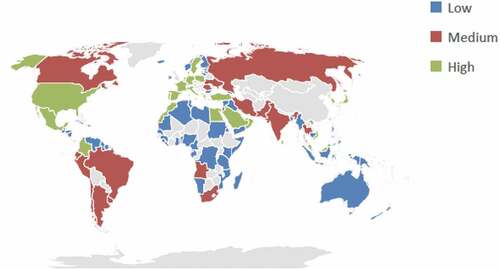
The results of the cluster analysis reveal that the 155 trading partners of China can be classified into three clusters. These results are presented in where it can be seen that the largest cluster (cluster 1) consists of 97 countries and that this cluster is characterised by having the highest mean value for number of required transhipments, while having lower mean values for common direct connections, position, ship size and number of carriers compared to clusters 2 and 3. Indeed, both clusters 2 and 3 are characterised by containing only countries that have direct maritime connections to China (i.e. requiring no transhipment), even though some such countries have also been classified into cluster 1 . Clusters 2 and 3 together, therefore, comprise a total of 58 of the countries having direct maritime connectivity with China.
Table 1. Descriptive statistics of the emergent 3 clusters- China.
A one-way ANOVA is then applied to the descriptive statistics for the results of the cluster analysis, in order to determine if there is any significant difference between the three clusters in terms of the mean values of the five components of maritime connectivity. As presented in , the results of this ANOVA indicate that a significant difference does indeed exist between the mean values of the five components of maritime connectivity across the three clusters because p-values are less than 0.05 (a five percent significance level) in all cases. Most notably, the results indicate that in clusters 2 and 3, a total of 58 of China’s trading partners have zero transhipment opportunities for trade with China and that this dramatically (and significantly) differentiates cluster 2 and 3 from cluster 1.
Table 2. Results of a one-way ANOVA and t-test of cluster analysis.
A more detailed disaggregation of the ANOVA reveals that the difference in terms of the number of transhipments between cluster 2 and 3 is insignificant because p-value is higher than 0.05 (See Appendix A). While this is hardly unsurprising, the other differences are all found to be significant (p-values are less than 0.01 at one percent level of significance), suggesting that the elements identified as belonging to cluster 2 are distinctly different and identifiably separate from the elements identified as belonging in cluster 3. In addition, these results also suggest that Cluster 1 is distinct from clusters 2 and 3, not only by virtue of having a significantly higher number of connections requiring transhipments, but also in terms of the other variables analysed (see ).
Figure 1. Trading partners of China based on three clusters that reflect three levels of connectivity: low, medium, and high. (Source: Authors’ own compilation).
In order to draw comparisons between China and its major competitive trading rivals within the East Asian region that also possess a high level of maritime connectivity, the foregoing analysis is now replicated for both Singapore and Hong Kong.
4.2. Singapore
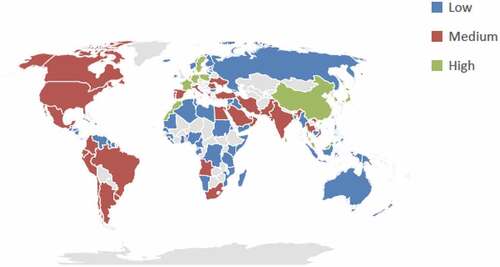
In the case of Singapore, the outcome of the cluster analysis also results in the classification of trading partners into three clusters (see ). However, as compared to China, with two clusters populated exclusively with countries having direct maritime connectivity with China, in this case only cluster 3 exclusively comprises trading partners with Singapore that require zero transhipment, even though both clusters 1 and 2 also contain some countries that are also directly linked to Singapore. Cluster 3 is the smallest cluster with 15 countries and cluster 1 the largest with 99 countries. In general terms, cluster 1 seems to be broadly differentiated from clusters 2 and 3 by having: a relatively high number of required transhipments with Singapore (‘Numtrans’); a relatively low level of connectivity in general (as indicated by ‘CommonConnect’ and ‘Position’) and liner shipping services which can be characterised as having a relatively low level of competition and where smaller ships are deployed (see ).
Table 3. Descriptive statistics of the emergent 3 clusters—Singapore.
Figure 2. Trading partners of Singapore based on three clusters that reflect three levels of connectivity: low, medium, and high. (Source: Authors’ own compilation).
A one-way ANOVA shows a significant difference (p-values less than 0.05 in all cases) between the mean values of all five components of maritime connectivity for the three clusters (see ).
As previously undertaken for the case of China, a detailed disaggregate analysis of the results from the ANOVA reveals that, in fact, the difference in terms of the number of transhipments between cluster 2 and 3 is the only aspect of cluster differentiation which is insignificant. For all other variables, the pairwise differences between each of the clusters are found to be significant. This sub-analysis is presented in Appendix A.
4.3. Hong Kong
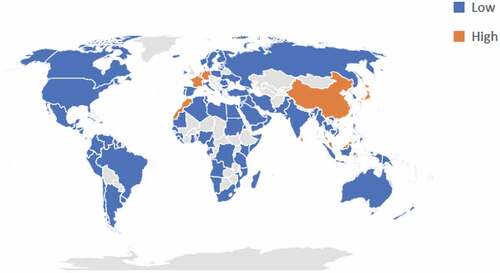
By applying cluster analysis to the LSBCI data for Hong Kong, the outcomes shown in are produced; specifically, just two clusters are derived in this case. Consisting of 143 countries, cluster 1 is by far the largest cluster. As compared to the 12 countries in cluster 2, the defining characteristics of cluster 1 can be seen to include having a higher number of required transhipments and a relatively lower level of general liner shipping connectivity (as indicated by the relative mean values for ‘CommonConnect’ and ‘Position’). In addition, countries in cluster 1 also tend to have less competition amongst the carriers which serve them and have smaller ships deployed on their services.
Table 4. Descriptive statistics of the emergent 2 clusters—Hong Kong.
Since only two clusters have emerged for Hong Kong, a t-test has been applied instead of a one-way ANOVA.Footnote1 The results of a test for the equivalence of means, as shown in , reveal that there is a significant difference (p-values less than 0.05 in all cases) between the mean values of all five components of maritime connectivity for the two clusters (see ).
Figure 3. Trading partners of Hong Kong based on two clusters that reflect two levels of connectivity: low, and high. (Source: Authors’ own compilation).
4.4. Characteristics of clusters
In order to more precisely define the nature of each cluster for each of the three maritime centres analysed, provide a visual summary of how each of the emergent clusters can be characterised in terms of each of the LSBCI variables. The three clusters are defined as representing the following three categories of maritime connectivity on the basis of the mean values of the five components of the LSBCI in each cluster (see ): Cluster 1 (low level of connectivity), Cluster 2 (medium level of connectivity), and Cluster 3 (high level of connectivity).
Table 5. Characterisation of clusters by the means of the LSBCI variables—China.
Table 6. Characterisation of clusters by the means of the LSBCI variables—Singapore.
Table 7. Characterisation of clusters by the means of the LSBCI variables—Hong Kong.
Analysing the membership of each cluster, out of China’s top fifteen trading partners, twelve countries are members of cluster 3, having significant advantages in terms of all 5 LSBCI variables. These countries comprise the USA, Hong Kong, Japan, South Korea, Vietnam, Germany, the Netherlands, the United Kingdom, Singapore, Taiwan, Malaysia and Mexico. Only two of China’s top fifteen trading partners emerge as members of cluster 2 (India and Russia), while only Australia emerges as a member of cluster 1, although with zero transhipment. This means that all top 15 trading partners of China trade with it with zero transhipment.
We replicate the analysisFootnote2 for China for the year 2010. The results show that the composition of clusters has changed over time. For instance, the number of trading partners in cluster 3, which has a high connectivity level, is 14 in 2010 compared to 31 in 2016. However, the mean values of the three variables (CommonConnect, Position, and NmaxCarrier) are higher in 2010, while the mean value of the variable Shipsize is higher in 2016. This indicates that over time there is a trend towards using larger vessels.
In the case of Singapore, seven out of its top fifteen trading partnersFootnote3 (China, Hong Kong, Malaysia, Japan, South Korea, the Netherlands and Germany) are in cluster 3. Thus, compared to China, only seven of Singapore’s top fifteen trading partners have significant advantages in terms of all 5 LSBCI variables. Among the remaining trading partners, Indonesia, the United States, Taiwan, Thailand and Vietnam are in cluster 2, while Australia, India and the Philippines are in cluster 1. Although these countries are in clusters 2 and 3 but they are connected directly with Singapore with zero transhipment. As in the previous case, these three clusters are defined as representing the following three categories of maritime connectivity on the basis of the mean values of five components of LSBCI: Cluster 1 (low level of connectivity), Cluster 2 (medium level of connectivity) and Cluster 3 (high level of connectivity).
For Hong Kong, out of its top 15 trading partners, only six countries are in cluster 2 (China, Japan, Singapore, Germany, the Netherlands and the United Kingdom). The rest are in cluster 1. The rest of the top trading partners that are United States, India, Taiwan, Thailand, Vietnam, United Arab Emirates, and South Korea are in cluster 1 but are directly connected with zero transhipment except Macao and Switzerland. The two clusters are defined as representing the following two categories of maritime connectivity on the basis of the mean values of five components of LSBCI: Cluster 1 (low level of connectivity) and Cluster 2 (high level of connectivity).
The results of the foregoing analysis point to the fact that the clusters are differentiated from each other unanimously across all the composite variables and that no really fuzzy edges are present between the clusters. Thus, the results reveal that for clusters characterised by a low mean value for ‘Numtrans’, they are also characterised by a desirable ‘high’ value for all the other variables within the LSBCI. The converse is also evident; clusters characterised by a ‘high’ mean value for the required number of transhipments (‘Numtrans’) are commonly associated with ‘low’, or at best ‘medium’, values for all the other variables within the LSBCI.
4.5. Ordered logistics regression
To investigate the impact of logistics performance and trade (exports and imports) on different categories of maritime connectivity, multivariate ordered logistic regression is applied. We estimate three different models. The dependent variables are three clusters (for China and Singapore) and two clusters (for Hong Kong). The multivariate ordered logistic regression is applied to data for China, Singapore and Hong Kong because the dependent variable represents three or two orders of connectivity (low, medium and high).
The independent variables are the following:
LPI = Logistic performance index. The following six components are used to compile the LPI: the customs and border clearance efficiency, trade and transport infrastructure quality, the mastery of organizing competitively priced shipments, logistics services’ quality and competence, and the frequency of the products’ arrival at the expected time.Footnote4 The LPI shows the competitiveness of the overall logistics sector of the country. However, since ports are an essential element of the global supply chain because they are part of the overall production and distribution activities (Wang and Cheng Citation2010), a good LPI also impacts port selection and connectivity.
Log export = natural log of exports (the export value of China, Singapore and Hong Kong)
Log import = natural log of imports (the import value of China, Singapore and Hong Kong)
The data for LPI were extracted from the World Bank and data for export and import values were collected from the UN Comtrade database. Following Hoffmann, Saeed, and Sødal (Citation2020), we have included only the import and export of highly containerisable products.
The results are presented in . LR Chi2 is statistically significant (p-values less than 0.01 at one percent level of significance) in all three models, indicating the overall fitness of the three models. The coefficients of LPI and Log export are positive and significant (p-values less than 0.01 at one percent level of significance) in Model 1. The results show that a one-unit increase in LPI increases the log odds of being in a higher level of connectivity by 1.52. Similarly, a one-unit increase in export value increases the log odds of being in a higher level of connectivity by 0.59.
Table 8. Results of estimated ordered logistic regression models.
In Models 2 and 3, the coefficients of LPI and Log import are positive and significant (p-values less than 0.01 at one percent level of significance; less than 0.05 at five percent level of significance, and less than 0.10 at 10% level of significance). A one-unit increase in LPI increases the likelihood of being in a cluster with a higher level of connectivity by 1.52 in Model 2, and by 1.7 in model 3. A one-unit increase in Log import increases the likelihood of being in a cluster with a higher level of connectivity by 0.25 in Model 2, and by 0.43 in Model 3.
5. Conclusions
Due to the close positive relationship between transport cost and the number of transhipments which link trading nations (Wilmsmeier and Hoffmann Citation2008; Fugazza and Hoffmann Citation2017) and the strong negative correlation between transport cost and bilateral trade (Clark, Dollar, and Micco Citation2004), each of the three major maritime centres analyzed may be motivated towards implementing strategies which seek to bring about changes in cluster membership, particularly for major trading partners. Thus, for example, China could seek to improve maritime connectivity to countries in clusters 1 and 2. Similarly motivated strategies could also be implemented by Singapore and Hong Kong.
Since the late 1990s, Hong Kong has been facing direct competition from the Shenzhen port in China. The Shenzhen port has surpassed Hong Kong by capturing a higher market share in vessel calls and developing frequent services from very large shipping lines such as Maersk and OOCL. Most logistics service providers have also showed interest in selecting Shenzhen because of better services offered at these gateways in terms of cost, reliability, and speed compared to Hong Kong (Wang and Cheng Citation2010). To face such competition in the region, Hong Kong needs to adopt strategies to improve its maritime connectivity, like port infrastructure development to handle mega vessels and attract the direct calls of vessels with zero transhipment. The form that such strategies might take is open to conjecture, but in all cases the seemingly close alignment (correlation) of the different elements of the LSBCI means that any targeted improvements are likely to have positive associated effects on other elements of maritime connectivity.
This application of cluster analysis to maritime connectivity has provided a different perspective on trading relationships. Rather than producing a single point value (and, potentially, a ranking) of individual bilateral maritime trading links (Fugazza Citation2017), the trading partners of any nation can be clustered into groups where the characteristics of their maritime connectivity are similar. This facilitates the implementation of strategies or policy interventions, either on the part of the nation being analysed or organisations such as UNCTAD in respect of developing nations, to improve their maritime connectivity with either all cluster members en masse or with individually identified members of a specific cluster. In addition, because of the high level of correlation between elements of the LSBCI within clusters that emerged from the analysis, the use of qualitative descriptors of the nature of maritime connectivity, such as ‘Good’, ‘Average’ or ‘Poor’, is greatly facilitated for each cluster and its individual members. The study also recommends that countries should focus on improving their LPI and trade volume to gain a position in a cluster with a higher level of connectivity.
In terms of potential avenues for future research, the strength of the clusters produced by this analysis and the degree of association between the variables within clusters suggests that there may be potential for reducing the data requirements of the LSBCI. There is also a clear need to further investigate the nature of the relationship between cluster membership and the value of bilateral trade with the focal maritime centre of the analysis. The outcomes from such work would help to more precisely define and evaluate the underlying dependence of trade upon maritime connectivity. This would be particularly useful from the perspective of trade facilitation and economic development, particularly for the least developed countries (LDCs) and small island developing states (SIDS), because these countries have poor shipping connectivity that creates a risk of higher freight rates. They are also heavily dependent on a small number of trading partners and face the highest transport costs as a percentage of the value of their imports compared with the world average (Psaraftis and Zis Citation2021). Another limitation of this research is that although Hong Kong and Singapore compete with China within the East Asian region, they are small city-states. Future studies should consider big trading rivals of China like the USA and Germany for comparison.
Disclosure statement
No potential conflict of interest was reported by the author(s).
Notes
1. Because there are only two clusters, the post hoc test (see Appendix A) for Hong Kong is not required.
2. Results can be provided upon request.
3. See http://www.worldstopexports.com/singapores-top-import-partners/ accessed 18 September 2019.
4. See https://wb-lpi-media.s3.amazonaws.com/LPI%20Methodology.pdf accessed 24 May 2021.
5. The variable ‘Log export’ is excluded from the model because there is a high collinearity (correlation coefficient = 0.90) between ‘Log export’ and ‘Log import’ and multicollinearity exists. After excluding ‘Log export’, the value of variance inflation factor is less than 5 that confirms non-existence of multicollinearity.
References
- Abonyi, J., and B. Feil. 2007. Cluster Analysis for Data Mining and System Identification. Berlin: Springer Science & Business Media.
- Aldenderfer, M. S., and R. K. Blashfield. 1984. Cluster analysis. Newbury Park, California: SAGE
- Anderberg, M. R. 1973. Cluster Analysis for Applications. New York: Academic Press.
- Ball, G. H. 1970. Classification Analysis. Technical Note AD 716482. Menlo Park, California: Stanford Research Institute.
- Cabral, A. M. R., and F. de Sousa Ramos. 2014. “Cluster Analysis of the Competitiveness of Container Ports in Brazil.” Transportation Research Part A: Policy and Practice 69: 423–431.
- Cattell, R. B. 1943. “The Description of Personality: Basic Traits Resolved into Clusters.” The Journal of Abnormal and Social Psychology 38 (4): 476.
- Clark, X., D. Dollar, and A. Micco. 2004. “Port Efficiency, Maritime Transport Costs, and Bilateral Trade.” Journal of Development Economics 75 (2): 417–450. doi:10.1016/j.jdeveco.2004.06.005.
- Cullinane, K. P. B., and Y. Wang. 2012. “The Hierarchical Configuration of the Container Port Industry: An Application of Multiple Linkage Analysis.” Maritime Policy & Management 39 (2): 169–187. doi:10.1080/03088839.2011.650719.
- Driver, H. E., and A. L. Kroeber. 1932. Quantitative Expression of Cultural Relationships. Berkeley, California: University of California Press.
- Ducruet, C. 2020. “The Geography of Maritime Networks: A Critical Review.” Journal of Transport Geography 88: 102824. doi:10.1016/j.jtrangeo.2020.102824.
- Esteve-Perez, J., and A. Garcia-Sanchez. 2017. “Characteristics and Consequences of the Cruise Traffic Seasonality on Ports: The Spanish Mediterranean Case.” Maritime Policy & Management 44 (3): 358–372. doi:10.1080/03088839.2017.1295326.
- Everitt., B. 2011. Cluster Analysis. Chichester: Wiley.
- Fancello, G., C. Pani, P. Serra, and P. Fadda. 2014. “Port Cooperation Policies in the Mediterranean Basin: An Experimental Approach Using Cluster Analysis.” Transportation Research Procedia 3: 700–709. doi:10.1016/j.trpro.2014.10.049.
- Fugazza, M. and J. Hoffmann. 2016. Bilateral Liner Shipping Connectivity since 2006. Policy Issues in International Trade and Commodities - Research Study Series No. 72, United Nations Conference on Trade and Development, Geneva. https://unctad.org/system/files/official-document/itcdtab74_en.pdf
- Fugazza, M., 2017. “The Liner Shipping Bilateral Connectivity Index.” Paper presented at the International Maritime Statistics Forum, Geneva, May 16th http://www.imsf.info/media/1328/fugazza-lsbci_0517.pdf.
- Fugazza, M., and J. Hoffmann. 2017. ““Liner Shipping Connectivity as Determinant of Trade.”.” Journal of Shipping and Trade 2 (1): 1. doi:10.1186/s41072-017-0019-5.
- González-Torre, P., J. Sarkis, and B. Adenso-Díaz. 2013. “Shipping Agents and Container Management: An Exploratory Analysis of Infrastructural and Cost Concerns.” International Journal of Shipping and Transport Logistics 5 (3): 322–349. doi:10.1504/IJSTL.2013.054193.
- Guo, L., and Z. Yang. 2018. “Evaluation of foreign trade transport accessibility for Mainland China„. Maritime Policy & Management 45(1): 34–52.
- Hoffmann, J., J.-W. van Hoogenhuizen, and G. Wilmsmeier. 2014. “Developing an Index for Bilateral Liner Shipping Connectivity.” Paper presented at the International Association of Maritime Economists (IAME), Norfolk, Virginia, United States.
- Hoffmann, J., N. Saeed, and S. R. Sødal. 2020. “Liner Shipping Bilateral Connectivity and Its Impact on South Africa’s Bilateral Trade Flows.” Maritime Economics and Logistics 22 (3): 473–499. doi:10.1057/s41278-019-00124-8.
- Jain, A. K., and R. C. Dubes. 1988. Algorithms for Clustering Data. Hoboken, New Jersey: Prentice-Hall.
- Jajuga, K., A. Sokolowski, and H. H. Bock. 2002. Classification, Clustering and Data Analysis. New York: Springer.
- Ke, R., and C. Wang. 2017. “Comparative Analysis of the Shipping Center Competitiveness of Major Port Cities in China.” Transportation Journal 56 (1): 35–53. doi:10.5325/transportationj.56.1.0035.
- Kutin, N., P. Guillotreau, and T. Vallée. 2018. “Assessing Competition on Maritime Routes in the Liner Shipping Industry through Multivariate Analysis.” Available to download at https://halshs.archives-ouvertes.fr/halshs-01828643/document
- Lu, C. S. 1999. “Strategic Groups in Taiwanese Liner Shipping.” Maritime Policy & Management 26 (1): 1–26. doi:10.1080/030888399287032.
- MacQueen, J. B. 1967. “Some Methods for Classification and Analysis of Multivariate Observations.” Proceedings of the Fifth Symposium on Math, Statistics, and Probability, 281–297. Berkeley, California: University of California Press.
- Psaraftis, H. N., and T. Zis. 2021. “Impact Assessment of a Mandatory Operational Goal-based Short-term Measure to Reduce GHG Emissions from Ships: The LDC/SIDS Case Study.” International Environmental Agreements: Politics, Law and Economics 1–23. https://doi.org/10.1007/s10784-020-09523-2
- Romesburg, H. C. 2004. Cluster Analysis for Researchers. North Carolina: Lulu.
- Sneath, P. H., and R. R. Sokal. 1962. “Numerical Taxonomy.” Nature 193 (4818): 855–860. doi:10.1038/193855a0.
- Tovar, B., and H. Rodríguez-Déniz. 2015. “Classifying Ports for Efficiency Benchmarking: A Review and A Frontier-based Clustering Approach.” Transport Reviews 35 (3): 378–400. doi:10.1080/01441647.2015.1016473.
- UNCTAD. 2017. “Review of Maritime Transport 2019.” Geneva and New York.
- UNCTAD. 2019. “Review of Maritime Transport 2019.” Geneva and New York.
- Wang, J. J., and M. C. Cheng. 2010. “From a Hub Port City to a Global Supply Chain Management Center: A Case Study of Hong Kong.” Journal of Transport Geography 18 (1): 104–115. doi:10.1016/j.jtrangeo.2009.02.009.
- Wilmsmeier, G., and J. Hoffmann. 2008. “Liner Shipping Connectivity and Port Infrastructure as Determinants of Freight Rates in the Caribbean.” Maritime Economics & Logistics 10 (1–2): 130–151. doi:10.1057/palgrave.mel.9100195.
- Wu, J., L. Liang, and M. Song. 2010. “Performance Based Clustering for Benchmarking of Container Ports: An Application of DEA and Cluster Analysis Technique.” International Journal of Computational Intelligence Systems 3 (6): 709–722.
- Yang, C. C., and C. W. Y. Wong. 2016. “Configurations of Environmental Management Strategy: Evidence from the Container Shipping Service Industry.” International Journal of Shipping and Transport Logistics 8 (3): 334–356. doi:10.1504/IJSTL.2016.076262.
- Zubin, J. 1938. “A Technique for Measuring Like-mindedness.” The Journal of Abnormal and Social Psychology 33 (4): 508. doi:10.1037/h0055441.