
 ?Mathematical formulae have been encoded as MathML and are displayed in this HTML version using MathJax in order to improve their display. Uncheck the box to turn MathJax off. This feature requires Javascript. Click on a formula to zoom.
ABSTRACT
The Physical Internet (PI) is a paradigm-changing and technology-driven vision, which is expected to significantly impact the development of the freight transport and logistics (FTL) system of today. However, the development of the FTL system towards the PI creates much uncertainty for its current stakeholders. Ports are one of those stakeholders that are expected to be profoundly affected by these developments. However, research that focuses on port policy, under the uncertain developments towards the PI, is still lacking. By providing port authorities with insights and recommendations on robust policy areas, we address this void in literature. We conduct a scenario analysis in combination with multi-criteria decision analysis (MCDA) to determine the importance of port performance indicators and policy areas in different scenarios. The most significant, uncertain, and orthogonal factors for the development of the PI are technological development and institutional development. We find that for a proper alignment with the PI vision, in three out of four scenarios, ports should prioritize the implementation of digital solutions and standards, as opposed to an infrastructure focused policy.
1. Introduction
Freight transport and logistics (FTL) contribute around 15% to the world’s GDP and account for over 10% of a finished product’s costs on average (Mervis Citation2014). Simultaneously, among others, by transportation marking its presence with over 30% of the global carbon emissions (IEA Citation2019), today’s FTL system is often considered as non-sustainable from an economic, environmental, and societal perspective (Montreuil, Meller, and Ballot Citation2013). Additionally, as demonstrated by regular disruptions with resulting shock-effects on international trade and manufacturing, the system suffers from vulnerabilities and lack of resilience. Besides being fundamental components of the FTL system, ports function as critical facilitators of international trade, through which they contribute to the economic development of countries and regions. With 80% of the total merchandise trade being transported over sea, annual global maritime trade volumes have surpassed 10 billion tons (Arvis et al. Citation2018). Whereas ports’ economic value creation and complexity increase over time (Lee and Lam Citation2016), they need to continuously adapt to their external environment due to changing economic and trading patterns, new technologies, legislation, and port governance systems (Nijdam & Van der Horst, 2017).
The Physical Internet (PI), a paradigm-changing and technology-driven vision, is expected to impact these current economic and trading patterns, technologies, legislation, and governance systems. In his seminal paper, Montreuil (Citation2011, 71) positioned the PI as an all-encompassing vision ‘for the future of how physical objects are transported, handled, stored, supplied, realized, and used across the world’. By analogy with the digital internet (DI) (Van Luik et al. Citation2020), the PI proposes physical shipments to be encapsulated into multi-level modular containers, which autonomously find their way through an open hyperconnected network of logistics networks. More recently, Montreuil (Citation2020, 2) defined the PI as a ‘hyperconnected global logistics system enabling seamless open asset sharing and flow consolidation through standardized encapsulation, modularization, protocols and interfaces’, where it aims to seamlessly connect physical, informational and financial flows. The development towards the PI is expected to have a profound impact on the functioning of today’s FTL system. Although it has been recognized as a promising vision by both academia and industry, the development is uncertain for many current stakeholders in the FTL system and requires collaborative research by academia, industry, and government.
Ports are expected to be significantly affected by the developments towards the PI (Fahim et al. Citation2021a). Port authorities (PAs), as central actors in ports, aim to synchronize the interests and actions of public stakeholders with private stakeholders, including their own strategic intents (Van der Lugt, de Langen, and Hagdorn Citation2017). Since ports and their infrastructures are extremely asset heavy with high investment costs and needs, a thorough understanding of the way the FTL system develops towards the PI is crucial to determine a correct allocation of investment resources and sustainable long-term policymaking for ports. In this paper, we define port policy as a set of strategic activities and measures that enable long-term development, planning, and learning to enhance overall port performance and attractiveness to its users.
This long-term development is fraught with uncertainty. Fahim et al. (Citation2021a) constructed an evolutionary PI port development framework with potential future development paths. In the context of policy-making and decision-making under uncertainty, a combination of scenario analysis and multi-criteria decision analysis (MCDA) is expected to yield meaningful results. Earlier, Fahim et al. (Citation2022) analyzed intelligent agents’ port performance evaluation and selection preferences in the context of the PI. However, the study on which port policy fits best to the diverse possible contexts of the PI has so far been unexplored. The research question to be answered in this paper is as follows:
1.1. ‘What are suitable policy areas for port authorities in the development towards the Physical Internet?’
By answering this question, we aim to provide PAs with insights and recommendations on robust policy areas towards the PI, where our expectation is that the optimal selection of policies will depend on the prevailing scenario towards the PI. We aim to contribute to literature on (1) maritime port policy and management in the technology-driven and paradigm-changing vision of the PI, and (2) policy selection in uncertain environments, through a combination of scenario analysis and MCDA.
The remainder of the paper is organized as follows. Section 2 provides a review of the relevant streams of literature for our research in the domains of the PI, future ports, and port policy. Section 3 presents the methodological approach. In Section 4, the construction of the contextual PI scenarios is described, the PI port performance indicators (PPIs) are presented, and the potential PI port policy areas are proposed. In Section 5, the aggregated results are presented and discussed with implications and recommendations for PAs. Section 6 ends the paper by means of a conclusion and recommendations for future research.
2. Literature review
2.1. PI fundamentals
By positioning the PI as addressing the Global Logistics Sustainability Grand Challenge, the PI is receiving increasing attention from academia, industry, and governmental institutions. In addition to the earlier provided definition, Montreuil (Citation2020) defined eight Building Blocks for the PI: (1) unified set of standard modular logistics containers; (2) containerized logistics equipment and technology; (3) standard logistics protocols; (4) certified open logistics facilities and ways; (5) global logistics monitoring system; (6) open logistics decisional and transactional platforms; (7) smart data-driven analytics; and (8) certified open logistics service providers. For a review of the wider PI literature, we refer to Treiblmaier et al. (Citation2020); here we highlight only the elements that directly relate to maritime ports.
Synchromodality, i.e. the synchronization between operations of different transport modes, is a fundamental element of the PI (Lemmens, Gijsbrechts, and Boute Citation2019). Decisions about switching between transport modes and routes are made real-time in response to demand variations, and resource and network availabilities. Another core element of the PI lies in the concept of collaboration between stakeholders by sharing physical and digital assets. Simmer et al. (Citation2017) stress the need for collaboration and its governance in the PI, while admitting to barriers stemming from mainly trust between stakeholders. Ballot, Gobet, and Montreuil (Citation2012a) showed results of potential network cost savings, ranging from 4% to 26%, along with a potential threefold reduction in harmful emissions. From a PI container perspective, Montreuil, Ballot, and Tremblay (Citation2016) suggest that they should be smart, connected, eco-friendly, modular, and easy to handle, store, transport, designed following global standards and exploitable across multiple modes of transportation.
From a PI hub perspective, Ballot, Montreuil, and Thivierge (Citation2012b), Montreuil et al. (Citation2012), Montreuil et al. (Citation2012), and Montreuil, McGinnis, and Buckley (Citation2021) addressed conceptual designs of intermodal hubs, road-based transit centers, road-based cross-docking hubs, and parcel logistics hubs, respectively, while Karakostas (Citation2019) used queuing theory to calculate properties such as throughputs, processing times, and traffic size. Focusing on maritime ports, Fahim et al. (Citation2021a) constructed an evolutionary PI port development framework to position changes over time, whereas Fahim et al. (Citation2022) analyzed the changes that can be expected in intelligent agents’ port performance evaluation and selection preferences. Fahim et al. (Citation2021b) addressed general managerial implications of the evolution of the PI for port and maritime practitioners.
2.2. Future ports
In comparison with today, future ports will increasingly need to address the capability of real-time information sharing among its stakeholders, high-end technology-driven IT solutions, sustainability, physical and digital port connectivity, and value-added services (VAS) (Lee and Lam Citation2016; Montreuil et al. Citation2018; Chu et al. Citation2018; Ha, Yang, and Lam Citation2019; Fahim et al. Citation2021a). The evolutionary framework in Fahim et al. (Citation2021a) describes the evolution from today’s ports into globally hyper-connected ports in a fully functioning global PI, the PI Port Framework (PIPF). The PIPF shows that the main aspects, which influence the development of current ports into PI ports, can be captured in governance, operational, and digital dimensions. Also in the PI, Fahim et al. (Citation2022) identified costs, level of service, network interconnectivity, geographical location, reliability, and information systems (ISs) as most important indicators for port performance. Montreuil et al. (Citation2018), however, stress that, to create a fully functioning PI, standardization of interfaces and protocols is a prerequisite. Ports need to develop digital capabilities which provide intelligence, automation, and visibility, i.e. tracking-and-tracing (T&T), not only on container level but also on individual shipment level (Fahim et al. Citation2021c).
In achieving hyperconnectivity, interconnected and interoperable ISs (of the different stakeholders), together with data and information (exchange) platforms, such as Port Community Systems (PCSs), have a crucial role and can accelerate the transition of ports towards the PI (Iida et al. Citation2019; Caldeirinha, Nabais, and Pinto Citation2022). PCSs can be described as neutral and open digital platforms, which enable secure exchange of information between both public and private stakeholders. PCSs aim to improve the competitiveness of port communities by automating, optimizing, and managing port and logistics processes through a single submission of data and connecting supply chains (IPCSA Citation2018). Delenclos, Rasmussen, and Riedl (Citation2018) argue that, to become a next-generation port of the future, ports should aim for the implementation of the same technology-driven innovations that are disrupting other industries: connected ISs and platforms; cloud-based services; sensors and other Internet of Things (IoT) technologies; augmented reality; intelligent decision-making systems; blockchain; and big data analytics applications. Although up-front capital investments are high, port automation results in operational cost savings, while also contributing to performance enhancements and safety gains. Successfully automated ports proved that operational costs could drop between 25% and 55%, and productivity could rise between 10% and 35% (Chu et al. Citation2018).
2.3. Port policy
From a policy perspective, Lam and Notteboom (Citation2014) provide pricing, monitoring, market access control, and environmental standard regulation as four main categories for port policy, while Hou and Geerlings (Citation2016) identify modal shift, technological means, and spatial measures as port policy options. Furthermore, whereas Kang and Kim (Citation2017) refer to technologies, monitoring and upgrading, process and quality improvement, active participation, and communication and cooperation as main dimensions of port policy practices, Aregall, Bergqvist, and Monios (Citation2018) identified technology, dedicated infrastructure, monitoring program, engine regulations, regulatory instruments, intermodal service development, port dues and subsidy funds, certification, knowledge improvement, and concessions as main port policy measures. Bjerkan and Seter (Citation2019) distinguish between concession agreements, collaboration, management of environment and energy, modal split, monitoring, port dues, and other managerial policies as main categories within port policy and management. A distinction can be made between investments in existing capabilities (e.g. hinterland accessibility, throughout capacity) and future capabilities (e.g. IoT technologies, intelligent decision-making systems) of ports. Being the organizations that are responsible for the management and development of a competitive, sustainable, and safe port environment, PAs need to make strategic decisions on investments within the geographical boundaries of the port area, but also beyond, in the fore- and hinterland (Notteboom and Lam Citation2018). Simultaneously, PAs need to strategically position themselves among and towards both private and public port stakeholders (Van der Lugt, de Langen, and Hagdorn Citation2017) in an environment that is experiencing a process of (horizontal) collaboration and (vertical) integration.
2.4. Positioning of the study
Although over the past decade the number of publications, research areas and applied methods within the PI have been growing fast, the topic of maritime ports is underrepresented in the PI literature. Research that focuses on the way ports could design policy under the uncertain development of the FTL system towards the PI is lacking. By investigating the vision of the PI in the context of port policy, we aim to contribute with this topic to the stream of PI literature as well as to the port policy and management literature.
3. Methodology
3.1. Overall approach
The approach comprises a combination of scenario analysis and MCDA. We use scenario analysis to identify alternative and plausible futures in the PI context. We define an effective policy as one that maximizes a port’s attractiveness for its potential users, by influencing port performance in the relevant dimension. Hence, policy effectiveness will depend on
The relative importance of each port performance indicator to its users, and
The relative impact of each port policy area on each indicator.
Both these factors are highly context-dependent. Depending on the degree to which the PI has been realized, users may emphasize different performance criteria (e.g. attach more importance to costs, or service quality) and it may therefore result in different dimensions of port performance becoming important. For example, when the PI is far advanced, investments in physical infrastructure may be less meaningful than in digital infrastructure. Our approach involves measuring I and II above separately and combining them into one policy effectiveness indicator. We measure relative importance of the port performance indicators in each scenario and the impact of the policy areas on the port performance indicators in each scenario using an MCDA method named Best-Worst Method (BWM) (Rezaei Citation2015) .
Next, using a weighted sum method, we can determine the overall effectiveness of the policy areas in each scenario, as follows.
where
is the effectiveness of policy area p in scenario s;
is the relative importance (weight) of performance indicator i for overall port attractiveness in scenario s;
is the impact of policy area p on indicator i.
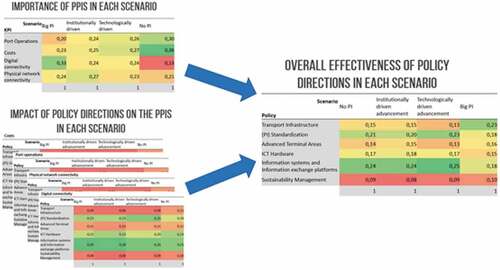
illustrates how effectiveness of the six policy areas is assessed for the four PPIs under the four scenarios. We elaborate on the detailed contents of these tables further on in the paper.
Figure 1. Evaluating the effectiveness of the six policy areas for four PPIs in four scenarios.
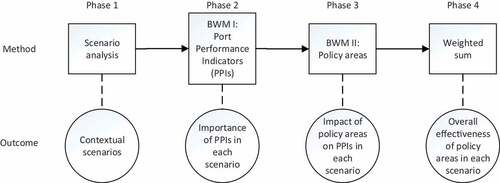
depicts the overall research process with respective consecutive phases.
Figure 2. Research process.
In the next sections, we subsequently discuss the scenario analysis and MCDA implementation approach.
3.2. Scenario analysis
In order to account for the uncertainty around the development of the PI, we formulate explorative scenarios using scenario logic (Enserink et al. Citation2010). The first step is to identify contextual factors. These are the variables that influence the development, performance, and outcome of a particular system, while lying outside the influence of the problem owner. We derive these contextual factors from a literature review. In the second step, the contextual factors are clustered into driving forces. These can be considered as the main underlying clusters of variables with the highest levels of uncertainty and impact that influence the system. In the third step, by means of attributing opposing (positive/+ and negative/-) development directions to the driving forces, the scenario logic is constructed, and scenarios are obtained. Using this approach, the number of obtained scenarios is equal to ‘2 to the power of the number of selected driving forces’. By balancing practicability and the provision of meaningful results, we aim for a set of between three and eight scenarios. This is in line with previously conducted transport scenario studies (e.g. Port of Rotterdam Citation2019; Inkinen, Helminen, and Saarikoski Citation2021).
3.3. Multi-criteria decision analysis (MCDA) implementation
MCDA is a sub-field of operations research where multiple decision alternatives are analyzed with respect to multiple (often conflicting) decision criteria. Among several MCDA methods, we choose the BWM. It is a data-efficient method and has proven to produce consistent and reliable results (Rezaei Citation2015). Through the initial selection of the best and worst criteria, to which the other criteria are compared, BWM is structured, easily executable, and time-efficient. By means of its pairwise comparisons, the BWM also helps decision-makers to gain additional valuable insights. Moreover, through the use of only integers, fundamental distance problems which might occur with the use of fractions in pairwise comparisons can be prevented (Rezaei Citation2015). Finally, the use of two opposite references (best and worst) mitigates a potential anchoring bias of the respondent (Rezaei Citation2020).
Our empirical research approach is built around the MCDA method and comprises four steps: (1) establishing criteria, (2) surveying experts, (3) determining weights, and (4) aggregating the results.
We used BWM for finding the weights of the port performance indicators in each scenario and the impact of the policy areas on the port performance indicators in each scenario. To avoid confusion, we call the first implementation of BWM as BWM I and the second implementation as BWM II.
Step 1 establishes a set of criteria. For BWM I, the PPIs represent the set of criteria. These are identified by means of literature review. For BWM II, the policy areas represent the set of criteria. To identify these policy areas, in addition to a literature review, we conduct a series of 14 semi-structured digital ‘face-to-face’ expert interviews. We use a semi-structured interview approach to be able to give the interviewees some direction, while allowing them to freely express their opinions and complement the discussions. We select the 14 experts on the basis of their experience with ports and/or PI, from academia and industry. Appendix A provides a list of the 14 expert interviewees with respective functions and affiliations.
Step 2 obtains experts’ preferences as input data for the BWM. For the evaluation of the importance of the PPIs in the different scenarios in BWM I, a survey among 14 experts is conducted. For the evaluation of the effectiveness of the policy areas on the PPIs in the different scenarios in BWM II, a survey among 21 experts is conducted. In both cases, these experts are selected based on their academic experience with ports and/or PI, their (scientific) contributions to ports and/or PI, and/or industry experience. Appendix B provides the lists of experts with respective functions and affiliations that participated in the surveys of BWM I and BWM II.
Step 3 determines the relative priorities/weights by means of the BWM. Since, in both BWM implementations, we are dealing with the preferences of a group of experts, we employ the Bayesian BWM. The Bayesian BWM is a probabilistic variant of BWM, which is specifically designed to obtain the relative priorities/weights of criteria for a group of DMs (Mohammadi and Rezaei Citation2020a). Next to obtaining the relative priorities/weights, an additional valuable feature of the Bayesian BWM is that it provides ranking schemes. These ranking schemes are called credal rankings and are able to measure the degree to which a group of DMs prefers one criterion over another by means of a confidence level (Mohammadi and Rezaei Citation2020b). The higher the confidence level, the more certain the group shows to be about a relationship between the two criteria. Appendix C provides a more elaborate explanation of the Bayesian BWM.
4. Results
In this section, we first describe the four scenarios that we obtained by scenario analysis. Secondly, we introduce the performance indicators and present their relative importance in the different scenarios. Thirdly, we present the identified policies that ports could use in their policy design, as well as their effectiveness on performance indicators in the different scenarios. Fourthly, we present the aggregated results in terms of the overall effectiveness of the policy areas in each of the scenarios.
4.1. Scenarios
For the scenario analysis, 27 external factors were identified that influence the global FTL system. Since we aim to incorporate all facets of the all-encompassing vision of the PI, and since both the technological and institutional components are crucial in the development towards the PI, we cluster the external factors into two driving forces: (1) Technological development and (2) Institutional development. We chose these two driving forces due to their high impact on the FTL system and high uncertainty in its developments, while simultaneously being able to provide a high aggregate level and all-encompassing analysis. Appendix D provides an overview of the 27 external factors with the corresponding driving forces.
For both driving forces, a positive and a negative future outcome is envisioned. In terms of technological development, a positive future outcome constitutes a fast technological development, whereas a negative future outcome constitutes a slow technological development. Similarly, in terms of institutional development, a positive future outcome constitutes a progressive institutional development, whereas a negative future outcome constitutes a restrictive institutional development. These potential positive and negative future outcomes are opposites on the two axes, which represent the driving forces of a scenario logic (see ), as prescribed by Enserink et al. (Citation2010). By combining these potential positive and negative future outcomes of the two driving forces, four different scenarios towards the PI are created by means of the quadrants of the scenario logic.
Figure 3. Scenario logic for PI ports.
4.2. Scenario 1: Limited PI
In the Limited PI scenario, due to slow technological developments, (implemented) solutions and applications in the fields of IoT, big data analytics and AI, and blockchain remain limited. Additionally, developments in cloud and edge computing (power) also lack behind, because of which both the autonomous real-time decision-making capabilities of intelligent agents, and the overall (hyper)connectivity between FTL stakeholders and entities do not come into fruition, as necessary for a well-functioning PI. Furthermore, from an institutional perspective, limited development in (PI) standards with a reluctance to collaborate and share resources by FTL stakeholders, partially, due to a lack in collaborative business models, and cohesive legal and regulatory frameworks, hinder the PI from moving forward. In this particular PI port scenario, the status quo of the FTL system remains and the PI will still be in its infancy by 2030.
4.3. Scenario 2: Institutional PI
In the Institutional PI scenario, the PI is driven by progressive institutional developments. Through the development and implementation of (PI) standards alongside the development and adoption of collaborative business models, and cohesive legal and regulatory frameworks, FTL stakeholders are willingly collaborating and sharing their physical and digital resources. Additionally, the modular PI containers are widely adopted in the FTL system. However, since technological developments are lagging behind with limitations, notably in the fields of IoT, big data analytics, AI, and blockchain, the PI operations are not being optimized. Additionally, developments in cloud and edge computing (power) also lag behind, because of which both the autonomous real-time decision-making capabilities of intelligent agents and the overall (hyper)connectivity between FTL stakeholders and entities do not materialize. Hence, although the FTL stakeholders are collaborating, from a technological perspective, this scenario presents a similar FTL as we know today. A fully functioning PI is not yet to be expected by 2030.
4.4. Scenario 3: Technological PI
In the Technological PI scenario, technological development is fast and provides opportunities to implement the PI. Due to the wide adoption of technologies and applications related to IoT, big data analytics and AI, and blockchain, operations in the FTL system are being optimized. Additionally, developments in cloud and edge computing (power) are rapidly advancing, enabling autonomous real-time decision-making by intelligent agents and the overall (hyper)connectivity between FTL stakeholders and entities. However, due to lacking collaborative business models alongside legal and regulatory restrictions, FTL stakeholders still prove to be reluctant towards collaborating and sharing resources. Also, the development of (PI) standards is lagging behind. Hence, although technological innovations are being rapidly developed and implemented, through which the FTL system becomes smart and operations become more optimized and efficient, stakeholders are not fully hyperconnected and collaborating due to a lack in the adoption of (PI) standards and the willingness to share resources. In this scenario, a fully functioning PI is not yet to be expected by 2030.
4.5. Scenario 4: Full PI
In the Full PI scenario, rapid technological development is paired with progressive institutional development. The rapid technological development provides opportunities to implement the PI on a global scale. Implemented technologies and applications related to IoT, big data analytics and AI, and blockchain allow operations in the FTL system to be optimized. Additionally, developments in cloud and edge computing (power) are rapidly advancing, enabling intelligent agents to autonomously make real-time decision and the envisioned hyperconnectivity between FTL stakeholders and entities. Furthermore, through the development and implementation of (PI) standards alongside the development and adoption of collaborative business models, and cohesive legal and regulatory frameworks, FTL stakeholders are willingly collaborating and sharing their resources. Also, because of both technological and institutional advancement, modular PI containers and interoperable digital information platforms are widely adopted in the FTL system. In this particular scenario, a fully functioning PI is expected by 2030, through which the FTL system becomes more sustainable from an economic, environmental, and societal perspective.
4.6. Port performance indicators (PPIs)
The analysis of port performance evaluation by its users has important implications for a port’s policy formulation and investment decisions. Whereas traditional port users, i.e. decision-makers, are represented by shippers, shipping lines, and logistics service providers, the routing protocol of the PI will require intelligent agents, i.e. intelligent containers and vessels, to support or replace current port users as decision-makers. Although port performance evaluation in a contemporary context has been abundantly investigated (e.g. Arvis et al. Citation2018; Ha, Yang, and Lam Citation2019), only Fahim et al. (Citation2022) addressed this topic in the advanced context of the PI. Hence, the indicators, which we use in this research to evaluate intelligent agents’ port performance preferences in the different PI port scenarios, are inspired by Fahim et al. (Citation2022). tabulates these PPIs with respective descriptions.
Table 1. Port performance indicators with respective descriptions.
After having obtained the preferences of the group of 14 experts by means of a survey, we employed the Bayesian BWM to compute the relative importance of the indicators in the different scenarios as well as the respective credal rankings. presents the relative importance of the performance indicators in the different scenarios.
Table 2. Importance of port performance indicators in the different scenarios.
Costs and Port Operations (PO) are perceived as most important in the Limited PI scenario, which is in line with contemporary port performance evaluation and selection literature. Although the range of values in the importance of the PPIs in an Institutional PI scenario are relatively small, Physical Network Connectivity (PNC) and Costs are perceived as most important. This could be interpreted as the two PPIs that are least dependent on the technological development having the highest importance. However, at the same time, although the range of values in the importance of the PPIs also in a Technological PI scenario are relatively small, Costs and PO are perceived as most important. This could indicate that technology is mostly seen as a means for operational productivity and efficiency gains, while simultaneously decreasing costs of operations. Digital Connectivity (DC) and PNC are perceived as the most important PPIs in the Full PI scenario, which indicates that the PI is still mostly perceived as a digital innovation with achieving (hyper)connectivity in the FTL system as its main function. Between scenarios, the largest discrepancies can be found in the importance of DC between Full PI and Limited PI (0.326–0.127 = 0.199), and in the importance of Costs between the Limited PI and Full PI (0.365–0.231 = 0.134).
An additional observation is the discrepancy in the range of values (between the most and least important) of the PPIs in the different scenarios: 0.238 (0.365–0.127) in the Limited PI scenario; 0.035 (0.272–0.237) in the Institutional PI scenario; 0.048 (0.275–0.227) in the Technological PI scenario; and 0.122 (0.326–0.204) in the Full PI scenario. We can conclude that a larger range can be found in the more ‘extreme’ scenarios, i.e. Full PI and Limited PI, while smaller ranges can be found in the ‘intermediate’ scenarios, i.e. Institutional PI and Technological PI. Implying that, in the intermediate scenarios, the experts’ preferences in PPIs are more balanced, while, in the more extreme scenarios, the experts have a more distinguished preference.
The credal rankings are visualized in a weighted directed graph, where the nodes represent the importance, and each link indicates that indicator
is more important than indicator
with confidence
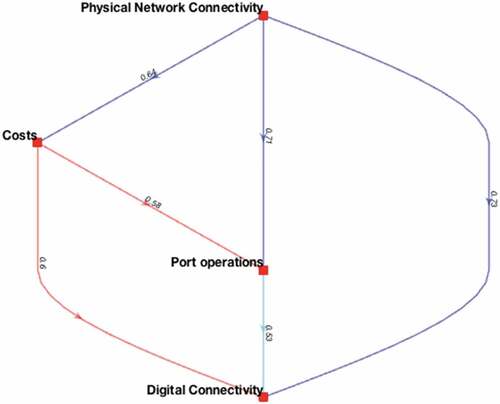
. , for instance, visualizes the weighted directed graph with respective credal rankings of the Institutional PI scenario. Although the guideline is that a confidence level of 0.50 can be used as a threshold value (Mohammadi and Rezaei Citation2020a), values of 0.53, 0.58, 0.60, and 0.64 in indicate that there is some dissension between the experts’ opinions about those particular relationships. The credal rankings of the Technological PI scenario show similar results, while most of the credal rankings of the Limited PI and Full PI scenarios are in full or almost full confidence levels, which is in line with the observation of the experts having a distinguished preference in importance of port performance indicators in the more ‘extreme’ scenarios. Hence, the conclusion can be drawn that the importance differences of the PPIs in these two scenarios are determined with full or almost full confidence by the group of experts.
Figure 4. Weighted directed graph with respective credal rankings of the Institutional PI scenario.
4.7. Policies
Ports could implement several measures and invest in policies to maintain and improve their attractiveness for port users in the uncertain development towards the PI. To identify policy areas that ports could use in their policy design and strategy formulation, we conducted a literature review and a series of 14 semi-structured expert interviews. Although there are various ways to categorize policies (e.g. Lam and Notteboom Citation2014; Hou and Geerlings Citation2016; Kang and Kim Citation2017; Aregall, Bergqvist, and Monios Citation2018; Bjerkan and Seter Citation2019), in this paper, we define six areas that bear particular relevance for ports developing towards the PI. The defined policy areas with respective descriptions are tabulated in .
Table 3. Policy areas with respective descriptions.
After having obtained the preferences of a group of 21 experts by means of a survey, we employed the Bayesian BWM to compute the relative impact of the policy areas on each of the PPIs in the different scenarios as well as the respective credal rankings. presents the impact of the policy areas on the PPIs in the different scenarios. However, since all the credal rankings were far above the threshold value of 0.5, which indicates that the difference of the impact of the policy areas in the different scenarios are determined by the group of experts with confidence, we decided not to show the weighted directed graphs.
Table 4. Impact of policy areas on the PPIs in the different scenarios.
It becomes evident that Information Systems and Platforms and (PI) Standardization are the most impactful policies on PO and Costs in all scenarios, except in the Limited PI scenario where Transport Infrastructure is considered most impactful. Regarding DC, we can observe that, in addition to (PI) Standardization and Information Systems and Platforms, ICT Hardware is considered a significantly impactful policy area in all scenarios. With respect to PNC, indicates that Transport Infrastructure is the most impactful policy area in all scenarios, except in the Technological PI scenario where Information Systems and Platforms is considered the most impactful policy area. Another clear observation is that Sustainability Management is the least impactful policy area on all PPIs in all scenarios.
4.8. Aggregated results
The aggregated results, i.e. the overall effectiveness of the policy areas in each scenario, are obtained by combining the importance of the PPIs in each scenario with the impact of the policy areas on the PPIs in each scenario (see EquationEq. 1)(1)
(1) . These aggregated results are tabulated in .
Table 5. Overall effectiveness of policy areas in the different scenarios.
We observe that Information Systems and Platforms is the most effective policy, followed by (PI) Standardization. This counts for the Full PI scenario and the two intermediate scenarios, Institutional PI and Technological PI. In the Limited PI scenario, Transport Infrastructure is considered most effective. Advanced Terminal Areas and ICT Hardware are considered similarly effective in all scenarios, whereas Sustainability Management is considered least effective in all scenarios. With respect to Sustainability Management, it must be taken into account, however, that the effectiveness is evaluated against the PPIs from a user perspective.
5. Discussion
Reflecting on the importance of the port performance indicators in the different scenarios, we can observe that there is a highest-importance movement from the highest importance of Costs and Port Operations in the Limited PI scenario to Digital Connectivity and Physical Network Connectivity in the Full PI scenario. This movement is in line with the contemporary port performance evaluation and selection literature (e.g. Ha, Yang, and Lam Citation2019), which prioritizes high-quality logistics services against lowest costs, as does the PI literature (e.g. Montreuil et al. Citation2018).
Reflecting on the overall effectiveness of the policy areas in the different scenarios, we can observe that, when moving further towards the Full PI scenario, Information System and Platforms becomes the most effective policy area, which can also be considered to be in line with literature on future ports (e.g. Chu et al. Citation2018; Delenclos, Rasmussen, and Riedl Citation2018; Ha, Yang, and Lam Citation2019) and ports in the PI (e.g. Fahim et al. Citation2021b, Citation2022). Additionally, this observation can be considered to be in line with the development of a sixth generation of ports, succeeding the fifth generation of ports as described by Lee and Lam (Citation2016). Additionally, the standardization is one of the essential cornerstones of the PI (Montreuil et al. Citation2018).
The low effectiveness of Sustainability Management can be attributed to the fact that as long as port users do not value sustainability and the environment as they value other port performance indicators in practice. Hence, although sustainability within freight transport and logistics and green ports has received much attention and importance in literature (e.g. Ashrafi et al. Citation2020), the question remains whether port authorities will be willing to focus and significantly invest in the Sustainability Management policy area.
When considering the implications of the effectiveness of the policy areas for ports altogether, however, it must be kept in mind that ports are still very dissimilar (Delenclos, Rasmussen, and Riedl Citation2018). More detailed and specific measures could follow from more specific case studies.
A fundamental challenge of increasingly complex multi-stakeholder networks to overcome is the matter of trust, transparency, and interoperability. Blockchain technology might have the potential to alleviate these concerns (Hasan et al. Citation2020). Neutral Information Systems and Platforms, such as PCSs, could play a facilitating role here. Port authorities can play a role here by acting as pioneers with the goal to create network effects, convincing other stakeholders to follow suit.
Another major technical challenge is the development and adoption of intelligent infrastructure, such as sensors, wireless communication technologies, and data centers. Part of the challenge here lies in the cloud and edge computing power capabilities, safety, and security, i.e. cybersecurity, and scale of implementation (Wang and Sarkis Citation2021). Port authorities, again, can play a role here by acting as pioneers with the goal to create network effects, convincing other stakeholders to follow suit.
Lastly, Standardization goes hand in hand with cooperative business models and the enabling legal and regulatory frameworks (Treiblmaier et al. Citation2020). PAs could lead collaborative efforts with organizations such as the World Trade Organization (WTO), International Maritime Organization (IMO), International PCS Association (IPCSA), Digital Container Shipping Association (DCSA), International Taskforce Port Call Optimization (ITPCO) but also with other freight transport and logistics stakeholders.
Finally, an important limitation of the research concerns the small group of respondents. Although they have been selected based on their knowledge of the constituent domains and have created a logical and internally consistent picture, different respondents may have produced different results. The validity of this picture outside of the current context of European ports remains to be assessed.
6. Conclusions and future research
The main objective of this paper is to provide ports with insights and recommendations on robust policy areas towards the PI, given its highly uncertain development. Therefore, the main research question that was formulated in the beginning of this paper is What are suitable policy areas for port authorities in the development towards the Physical Internet?
To answer this question, we have proposed a quantitative approach to clarify the effect of uncertainties in the environment of ports on the required policies. The method is shown to discriminate clearly between alternative policies, indicating which policies are robust in which scenarios. To our understanding, this approach is new in the scientific literature in the domain of maritime ports. Future port policy studies can build on this approach.
Our main findings include the following. The most significant, uncertain, and orthogonal factors to consider in mapping potential futures for the development of the freight transport and logistics system into the PI are technological development and institutional development. Additionally, we show that the pace and approach of the realization of the PI are very relevant for policymaking, as scenarios have shown to have different emphasis on policies. Also, we found that, moving into the PI, the connectivity indicators, Digital Connectivity and Physical Network Connectivity, become more important, while Costs and Port Operations become less important for port users. Furthermore, we identified the following policy areas for ports: (1) Transport Infrastructure, (2) (PI) Standardization, (3) Advanced Terminal Areas, (4) ICT Hardware, (5) Information Systems & Platforms, and (6) Sustainability Management. Here, we found that, moving into the PI, Information Systems & Platforms followed by (PI) Standardization are considered most effective.
The implications of the research are that ports should prioritize the development and implementation of digital (IT) solutions and systems that increase productivity and decrease costs of operations, while simultaneously increase supply chain interconnectivity and visibility. In addition, the research shows that standardization will be a necessary means to achieve seamless flow of goods and information between networks and stakeholders in the future context of the PI. The main implication for port managers is that they have to closely monitor the pace of realization of the PI and make sure that they shift their strategy in a timely and suitable manner, from the current policy focus on infrastructure development to a dominant digitalization and standards creating focus in their policymaking.
As avenues for future research, we propose the following. As our current policy areas are still formulated at a rather high level; we recommend to further operationalize them and assess them in more detail, to support their implementation. Additionally, adding a timeline to these measures could help policymakers to create a (dynamic) policy roadmap with respective concrete measures. Furthermore, it is recommended to conduct a cost–benefit analysis to assess the cost-effectiveness of the policy areas. Also, other quantitative analyses could be conducted to gain more insights into the impact of the policy areas, i.e. modelling what the effects of the policy areas are on quantitative indicators, such as container throughput, emissions, and revenue, in the different scenarios. The latter could be done using quantitative freight models and simulations. Lastly, since we mainly used European interviewees and survey respondents, we recommend research around the general applicability of our findings in other major parts of the world.
Disclosure statement
No potential conflict of interest was reported by the author(s).
Additional information
Funding
References
- Ahmad, R. W., H. Hasan, R. Jayaraman, K. Salah, and M. Omar. 2021. “Blockchain Applications and Architectures for Port Operations and Logistics Management.” In Research in Transportation Business & Management, 100620.
- Aregall, M. G., R. Bergqvist, and J. Monios. 2018. “A Global Review of the Hinterland Dimension of Green Port Strategies.” Transportation Research Part D: Transport and Environment 59: 23–34. doi:10.1016/j.trd.2017.12.013.
- Arvis, J. F., L. Ojala, C. Wiederer, B. Shepherd, A. Raj, K. Dairabayeva, and T. Kiiski. 2018. Connecting to Compete 2018: Trade Logistics in the Global Economy. Washington, DC: World Bank.
- Ashrafi, M., T. R. Walker, G. M. Magnan, M. Adams, and M. Acciaro. 2020. “A Review of Corporate Sustainability Drivers in Maritime Ports: A multi-stakeholder Perspective.” Maritime Policy & Management 47 (8): 1027–1044. doi:10.1080/03088839.2020.1736354.
- Ballot, E., O. Gobet, and B. Montreuil. 2012a. Physical Internet Enabled Open Hub Network Design for Distributed Networked Operations. In Service Orientation in Holonic and multi-agent Manufacturing Control, 279–292. Berlin, Heidelberg: Springer.
- Ballot, E., B. Montreuil, and C. Thivierge. 2012b. Functional Design of Physical Internet Facilities: A Road-rail Hub. 12th IMHRC Proceedings. Gardanne,: France – 2012). 13.
- Bjerkan, K. Y., and H. Seter. 2019. “Reviewing Tools and Technologies for Sustainable Ports: Does Research Enable Decision Making in Ports?” Transportation Research Part D: Transport and Environment 72: 243–260. doi:10.1016/j.trd.2019.05.003.
- Caldeirinha, V., J. L. Nabais, and C. Pinto. 2022. “Port Community Systems: Accelerating the Transition of Seaports toward the Physical Internet—The Portuguese Case.” Journal of Marine Science and Engineering 10 (2): 152. doi:10.3390/jmse10020152.
- Chu, F., S. Gailus, L. Liu, and L. Ni (2018). The Future of Automated Ports. McKinsey & Company – Travel, Transport & Logistics. Accessed on https://www.mckinsey.com/industries/travel-transport-and-logistics/our-insights/the-future-of-automated-ports
- Delenclos, F. X., A. Rasmussen, and J. Riedl (2018). To Get Smart, Ports Go Digital. Boston Consulting Group – Shipping Industry, Logistics, Digital Transformation. https://www.bcg.com/publications/2018/to-get-smart-ports-go-digital
- DHL. 2021. Logistics Trend Radar. Accessed 22 March 2021. https://www.dhl.com/global-en/home/insights-and-innovation/insights/logistics-trend-radar.html
- Di Vaio, A., L. Varriale, and F. Alvino. 2018. “Key Performance Indicators for Developing Environmentally Sustainable and Energy Efficient Ports: Evidence from Italy.” Energy Policy 122: 229–240. doi:10.1016/j.enpol.2018.07.046.
- Enserink, B., J. Kwakkel, P. Bots, L. Hermans, W. Thissen, and J. Koppenjan. 2010. Policy Analysis of multi-actor Systems. The Hague: LEMMA.
- Fahim, P. B. M., R. An, J. Rezaei, Y. Pang, B. Montreuil, and L. Tavasszy. 2021c. “An Information Architecture to Enable track-and-trace Capability in Physical Internet Ports.” Computers in Industry 129: 103443. doi:10.1016/j.compind.2021.103443.
- Fahim, P. B. M., U. Martinez de, M. Alvarez de Sotomayor, J. Rezaei, A. Van Binsbergen, M. Nijdam, and L. Tavasszy. 2021a. “On the Evolution of Maritime Ports Towards the Physical Internet.” Futures 134: 102834. doi:10.1016/j.futures.2021.102834.
- Fahim, P. B. M., J. Rezaei, R. Jayaraman, M. Poulin, B. Montreuil, and L. Tavasszy. 2021b. “The Physical Internet & Maritime Ports: Ready for the Future?” IEEE Engineering Management Review 49 (4): 136–149. doi:10.1109/EMR.2021.3113932.
- Fahim, P. B. M., J. Rezaei, B. Montreuil, and L. Tavasszy. 2022. “Port Performance Evaluation and Selection in the Physical Internet.” Transport Policy 124: 83–94. doi:10.1016/j.tranpol.2021.07.013.
- Hasan, H. R., K. Salah, R. Jayaraman, I. Yaqoob, and M. Omar. 2020. “Blockchain Architectures for Physical Internet: A Vision, Features, Requirements, and Applications.” IEEE Network 35 (2): 174–181. doi:10.1109/MNET.021.2000442.
- Ha, M. H., Z. Yang, and J. S. L. Lam. 2019. “Port Performance in Container Transport Logistics: A multi-stakeholder Perspective.” Transport Policy 73: 25–40. doi:10.1016/j.tranpol.2018.09.021.
- Hou, L., and H. Geerlings. 2016. “Dynamics in Sustainable Port and Hinterland Operations: A Conceptual Framework and Simulation of Sustainability Measures and Their Effectiveness, Based on an Application to the Port of Shanghai.” Journal of Cleaner Production 135: 449–456. doi:10.1016/j.jclepro.2016.06.134.
- IEA (2019). Emissions – Global Energy & CO2 Status Report 2019 – Analysis – IEA. Accessed on https://www.iea.org/reports/global-energy-co2-status-report-2019/emissions
- Iida, J., D. Watanabe, K. Nagata, and M. Matsuda. 2019. “Sharing Procedure Status Information on Ocean Containers across Countries Using Port Community Systems with Decentralized Architecture.” Asian Transport Studies 5 (4): 694–719.
- Inkinen, T., R. Helminen, and J. Saarikoski. 2021. “Technological Trajectories and Scenarios in Seaport Digitalization.“ Research in Transportation Business & Management 41: 100633.
- IPCSA. 2018. November “Sustainable Freight Transport in Support of the 2030 Agenda for Sustainable Development.” In UNCTAD Multiyear Expert Meeting on Transport, Trade Logistics and Trade Facilitation, 21–23. Geneva: UNCTAD.
- Kang, D., and S. Kim. 2017. “Conceptual Model Development of Sustainability Practices: The Case of Port Operations for Collaboration and Governance.” Sustainability 9 (12): 2333. doi:10.3390/su9122333.
- Karakostas, B. 2019. “Modelling and Simulation of a Physical Internet of Transportation Hubs.” Procedia Computer Science 151: 17–22. doi:10.1016/j.procs.2019.04.006.
- Lam, J. S. L., and T. E. Notteboom. 2014. “The Greening of Ports: A Comparison of Port Management Tools Used by Leading Ports in Asia and Europe.” Transport Reviews 34 (2): 169–189. doi:10.1080/01441647.2014.891162.
- Lee, P. T. W., and J. S. L. Lam. 2016. “Developing the fifth generation ports model.“ In Dynamic Shipping and Port Development in the Globalized Economy: Volume 2: Emerging Trends in Ports, 186–210. London: Palgrave Macmillan.
- Lemmens, N., J. Gijsbrechts, and R. Boute. 2019. “Synchromodality in the Physical Internet–dual Sourcing and Real-time Switching between Transport Modes.” European Transport Research Review 11 (1): 1–10. doi:10.1186/s12544-019-0357-5.
- Meindl, B., N. F. Ayala, J. Mendonça, and A. G. Frank. 2021. “The Four Smarts of Industry 4.0: Evolution of ten Years of Research and Future Perspectives.” Technological Forecasting and Social Change 168: 120784. doi:10.1016/j.techfore.2021.120784.
- Mervis, J. 2014. “The Information Highway Gets Physical.” Science 344 (6188): 1104–1107. doi:10.1126/science.344.6188.1104.
- Mohammadi, M., and J. Rezaei. 2020a. “Bayesian Best-worst Method: A Probabilistic Group Decision Making Model.” Omega 96: 102075. doi:10.1016/j.omega.2019.06.001.
- Mohammadi, M., and J. Rezaei. 2020b. “Evaluating and Comparing Ontology Alignment Systems: An MCDM Approach.” Journal of Web Semantics 64: 100592. doi:10.1016/j.websem.2020.100592.
- Montreuil, B. 2011. “Toward a Physical Internet: Meeting the Global Logistics Sustainability Grand Challenge.” Logistics Research 3: 71–87. doi:10.1007/s12159-011-0045-x.
- Montreuil, B. (2020). The Physical Internet: Shaping a Global Hyperconnected Logistics Infrastructure. IPIC 2020 International Physical Internet Conference, Keynote Speech 2020/11/18, Shenzen, China, https://www.picenter.gatech.edu/sites/default/files/ipic2020-keynotehyperconnectedlogisticsinfrastructure_20201116_web.pdf
- Montreuil, B., E. Ballot, and W. Tremblay. 2016. Modular Design of Physical Internet Transport, Handling and Packaging Containers, Material Handling Research, 03-16-2016, Charlotte, NC, USA.
- Montreuil, B., S. Buckley, L. Faugère, R. Khir, and S. Derhami. 2018. Urban Parcel Logistics Hub and Network Design: The Impact of Modularity and Hyperconnectivity. Progress in Material Handling Research: 2018, (Ed.) A. Carrano. Charlotte, NC, USA: MHI.
- Montreuil, B., L. McGinnis, and S. Buckley (2021). Framework and Research Roadmap for a Next-Generation Hyperconnected Logistics Hub, Proceedings of IPIC 2021 International Physical Internet Conference, Virtual, 10.
- Montreuil, B., R. D. Meller, and E. Ballot. 2013. ”Physical Internet foundations.“ In Service Orientation in Holonic and Multi Agent Manufacturing and Robotics, 151–166. Berlin, Heidelberg: Springer.
- Montreuil, B., R. D. Meller, C. Thivierge, and Z. Montreuil. 2012. Functional Design of Physical Internet Facilities: A Road-based Crossdocking Hub. IMHRC Proceedings, 03-16-2012, Gardanne, France.
- Notteboom, T. E., and J. S. L. Lam. 2018. “The Greening of Terminal Concessions in Seaports.” Sustainability 10 (9): 3318. doi:10.3390/su10093318.
- Port of Rotterdam. 2019. Port Vision Rotterdam. Rotterdam: Port of Rotterdam.
- Rezaei, J. 2015. “Best-worst multi-criteria decision-making Method.” Omega 53: 49–57. doi:10.1016/j.omega.2014.11.009.
- Rezaei, J. 2020. “A Concentration Ratio for Nonlinear Best Worst Method.” International Journal of Information Technology & Decision Making 19 (3): 891–907.
- Sarkis, J., M. Kouhizadeh, and Q. S. Zhu. 2021. “Digitalization and the Greening of Supply Chains.” Industrial Management & Data Systems 121 (1): 65–85. doi:10.1108/IMDS-08-2020-0450.
- Schenker, D. B. (2021). Volocopter and DB Schenker Announce First Blueprint for VoloDrone Operations. https://www.dbschenker.com/global/about/press/volocopter-and-db-schenker-announce-first-blueprint-for-volodrone-operations-708858
- Simmer, L., S. Pfoser, M. Grabner, O. Schauer, and L. M. Putz. 2017. “From Horizontal Collaboration to the Physical Internet–A Case Study from Austria.” International Journal of Transport Development and Integration 1 (2): 129–136. doi:10.2495/TDI-V1-N2-129-136.
- Treiblmaier, H., K. Mirkovski, P. B. Lowry, and Z. G. Zacharia. 2020. “The Physical Internet as a New Supply Chain Paradigm: A Systematic Literature Review and a Comprehensive Framework.” International Journal of Logistics Management 31 (2): 239–287.
- Van der Lugt, L. M., P. W. de Langen, and L. Hagdorn. 2017. “Strategic Beliefs of Port Authorities.” Transport Reviews 37 (4): 412–441. doi:10.1080/01441647.2016.1245685.
- Van Luik, S., T. Fiebig, P. B. M. Fahim, P. De Waard, and L. Tavasszy. 2020. “On the Value of the Digital Internet/Physical Internet Analogy.” Journal of Supply Chain Management Science 1 (3–4): 87–103.
- Wang, Y., and J. Sarkis. 2021. “Emerging Digitalisation Technologies in Freight Transport and Logistics: Current Trends and Future Directions.” Transportation Research Part E: Logistics and Transportation Review 148: 102291. doi:10.1016/j.tre.2021.102291.
- World, D. P. (2020). DP World and Virgin Hyperloop Hail Decision that Brings Hyperloop Systems One Step Closer to Reality. Accessed on https://www.dpworld.com/news/releases/dp-world-and-virgin-hyperloop-hail-decision-that-brings-hyperloop-systems-one-step-closer-to-reality/
Appendix A: List of expert interviewees
Table A1. Expert interviewees.
Appendix B:
List of survey respondents
Table B1. Survey respondents BWM I.
Table B2. Survey respondents BWM II.
Appendix C:
Explanation of the Bayesian BWM
Assume that K experts evaluate n criteria C = {c1, …, cn}. To apply the Bayesian BWM, we should follow these four steps (Mohammadi and Rezaei Citation2020a):
Step a: Expert k first selects the best () and the worst (
) criteria from C.
Every expert selects the best and the worst criteria from the set of earlier defined criteria. The best is considered the most important, whereas the worst criterion is considered the least important.
Step b: Expert k makes the pairwise comparison between the best criterion () and the other criteria.
Every expert expresses his/her preferences of the best criterion to the other criteria on a 9-point scale. Table C shows the scale numbers with respective linguistic variables of the 9-point scale. The pairwise comparison of expert k results in the ‘Best-to-Others’ vector as
where represents the preference of the best criterion (
) over criterion
for expert
.
Table C1. Nine-point scale with linguistic variables
Step c: Expert k makes the pairwise comparison between the worst criterion () and the other criteria. Here, every expert expresses his/her preferences of the other criteria over the worst criterion, again, on a 9-point scale. The pairwise comparison of expert k in step results in the ‘Others-to-Worst’ vector
as
where represents the preference of criterion
over the worst criterion for expert
(
).
Step d: Obtaining the aggregated weights ) and the weight for each expert
based on the following probabilistic model:
~ multinomial(1/wk), ∀k = 1, …, K,
~ multinomial(wk), ∀k = 1, …, K,
wk | w* ~ Dir(ɣ x w*), ∀k = 1, …, K,
ɣ ~ gamma(0.1, 0.1),
w* ~ Dir(1), (4)
where multinomial is the multinomial distribution, Dir is the Dirichlet distribution and gamma (0.1, 0.1) is the gamma distribution with shape parameters of 0.1.
Considering that this model does not have a closed-form solution, Markov-chain Monte Carlo (MCMC) methods such as ‘just another Gibbs sampler’ (JAGS) must be used (Mohammadi and Rezaei Citation2020a). The useful outcome of the model is the posterior distribution of weights for every single expert and the aggregated w*. However, the confidence of the superiority cannot be determined by solely comparing the weights. Therefore, in addition to providing the weights for every single expert and the aggregated , the Bayesian BWM allows us to calibrate the degree to which one criterion is superior to another by means of a credal ranking.
Prior to providing a definition of the credal ranking, the credal ordering, which is the building block for the credal ranking, will be defined:
Definition 1 (credal ordering). For a pair of criteria and
, the credal ordering O is defined as
where
R is the relation between criteria
and
Definition 2 (credal ranking). For a set of criteria , the credal ranking is a set of credal orderings which includes all pairs
, for all
.
The property of being able to assess the confidence of the superiority provides the DMs with more information that can significantly contribute to their decisions. It is considered even more important since we are dealing with group decision-making (Mohammadi and Rezaei Citation2020a).
Another Bayesian test can now be devised to find the confidence of each credal ordering. The test is predicated on the posterior distribution . The confidence that
being superior to
is computed as
where is the posterior distribution of
and
is 1 if the condition in the subscript holds, and 0 otherwise. This integration can be approximated by the samples via the MCMC. Having Q samples from the posterior distribution, the confidence can be computed as
where is the
sample of
from the MCMC samples. Thus, for each pair of criteria, the confidence that one is superior over another can be computed. The credal ranking can be changed into a traditional ranking. Then, it is evident that
. Hence,
is more important than
if, and only if,
(Mohammadi and Rezaei Citation2020b). As a result, the traditional ranking of criteria can be obtained by applying a threshold of 0.5 in the credal ranking.
Appendix D:
Driving forces with external factors
Table D1. Driving forces with external factors