
ABSTRACT
The Northeast Passage (NEP) has always been an attractive transport alternative for trade between Northwest Europe and Northeast Asia due to its shorter distance. While a growing body of literature addresses the economic and technical viability of NEP transit shipping, there is still a need for increased knowledge on the features of maritime trade between the regions that could potentially use the route. This study aimed to propose a conceptual model to explain the main factors influencing the cargo demand transported by container ships in order to analyse the types of trade that could increase by using the NEP. Structural equation modelling (SEM) was applied to the empirical data on trade volumes between Northwest Europe and Northeast Asia and suggested that logistics performance has the greatest impact on total volume of container ship flow between these regions. The data of maritime trade volume are further disaggregated to examine how the impact of the analysed factors varied between commodity groups. This study contributes to identifying which type of cargo flow may be the most receptive in case of opening the NEP for regular shipping whilst offering insights into the impact of global economic policy uncertainty on container ship demand.
1. Introduction
Global economic and industrial structures are changing significantly with economic globalisation: more production, operations, and resource allocation are conducted on a global scale. Simultaneously, world trade and transport chains are continuously being developed. Gross domestic product (GDP) was predominantly used to predict the future of freight flows and volumes, but new determinants have emerged (Meersman and Van De Voorde Citation2013) which need to be studied.
Recent studies (e.g. Cho Citation2014; Gani Citation2017; Munim and Schramm Citation2018) have highlighted the importance of logistics in international trade. In the context of globalisation, faster, more reliable, and cheaper maritime transport services drive global trade expansion (Cho Citation2014). This has increased the importance of maritime ports in global supply chains. However, most studies that have analysed the impact of logistics on maritime trade, only considered aggregated global trade.Footnote1 Consequently, the effect of how—logistics performance—affects the transport of various commodities by sea in different regions remains unclear.
Additionally, global events - e.g. the global financial crisis, political polarisation and trade conflicts, as well as the pandemic have raised concerns over rising economic uncertainty. Although some studies show that ‘global economic policy uncertainty’ (henceforth: ‘world uncertainty’) has a significant impact on real economic activity (e.g. Kang, Perez de Gracia, and Ratti Citation2017), knowledge of its effects on maritime trade is limited.
While the contexts of previous studies related to maritime trade vary, few have addressed the Northeast Passage (NEP). The popularity of the NEP as a goods transportation route has increased in recent years due to the melting of polar ice in parts of the Northern Sea Route (NSR) (Zhao et al. Citation2022). The NSR constitutes the main part of the NEP, which also includes the Barents Sea and connects the Atlantic and the Pacific Oceans by running along the northern coast of Eurasia (Hermann et al. Citation2022). This allows the NEP shipping route to be used to connect Northwest (NW) Europe to Northeast (NE) Asia through the Arctic Ocean, offering reduced transportation distance compared to the popular Southern Sea Route running through the Suez Canal (Bekkers, Francois, and Rojas‐Romagosa Citation2018).
The melting of Arctic sea ice resulted in new gas field developments in the Arctic Ocean, such as on the Yamal Peninsula and Pechora Sea (Shibasaki et al. Citation2018). Consequently, NEP is now mainly used for shipping liquefied natural gas (LNG) and oil, followed by construction materials and equipment for industrial projects and various consumer goods to remote Arctic communities (Gunnarsson Citation2021). Container ship trading via NEP along the NSR is still far from becoming a real alternative to major transcontinental routes such as the Suez Canal (Hermann et al. Citation2022). This is due to several factors: the poor infrastructure and logistics performance of NEP (e.g. Leypoldt Citation2015; Pruyn Citation2016); seasonality of work along the NSR strip (e.g. Lasserre and Faury Citation2019); limitations in the draft of vessels (e.g. Pruyn Citation2016); limited capacity of ports and equipment for cargo handling (Leypoldt Citation2015); and a need for available search-and-rescue (SAR) services (Hermann et al. Citation2022). Furthermore, the NSR is under the Russian Federation’s legislation and sensitive to geopolitics, such as sanctions due to the recent Russian-Ukrainian armed conflict (Hermann et al. Citation2022). As a consequence, the route is not attractive for international shipping in short-term. The current geopolitical and world economic situations may also significantly affect plans to attract international carriers. However, this study assumes a long-term perspective in which geopolitical issues would be resolved or avoided by shipping in neutral waters north of the NSR.
Research on shipping via the NEP is limited both in number and scope. The forecasted potential for maritime trade via the NEP until 2050 (Leypoldt Citation2015) does not consider variables like logistics performance, freight costs, and world uncertainty. Likewise, studies that analysed the impact of the use of the NEP on trade between NE Asia and NW Europe (Martínez-Zarzoso Citation2013; Bekkers, Francois, and Rojas‐Romagosa Citation2018; Liu et al. Citation2019) do not address the variation between commodity types that could potentially be transported as transit traffic via the NEP.
Thus, the purpose of this study is threefold. First, to develop a conceptual model explaining the demand for maritime container shipping and a framework for understanding the main variables. Second, to use data on traffic between NE Asia and NW Europe in: an aggregated analysis using total transport volumes and disaggregated analyses using a selection of commodity types. Third, to distinguish the types of trade flow which could increase by using the NEP. Without this knowledge, it will be difficult for Arctic stakeholders to predict and identify the types and volumes of potential traffic and to successfully plan an Arctic container line.
The remainder of this article is structured as follows. The theoretical framework is described in Section 2. Section 3 presents the data characteristics, sampling, and research method for the empirical analyses. Section 4 presents the findings obtained from the structural equation modelling (SEM) analysis of total trade in both directions and the disaggregated analysis of trade volume for different cargo groups in westbound trade, under two subsections. The relation of these findings in relation to the existing literature on container ship trade and the NEP is discussed accordingly. Finally, the conclusions and possible future research directions are presented in Section 5.
2. Theoretical framework
2.1. Overview of maritime trade determinants
The maritime economy is extremely complex (Stopford Citation2008), and many attempts have been made to model the factors that stimulate or hinder international maritime trade. As maritime trade is backbone of international trade an understanding of the determinants of international trade is central to understanding maritime trade (Blonigen and Wilson Citation2013). This section offers an overview of some of the major determinants addressed in the literature.
Eichengreen and Irwin (Citation1995, 8) proposed that ‘a standard framework for investigating the pattern of trade is the gravity model, which relates the value of bilateral flows to national income, population, distance, and contiguity.’ Despite many theoretical derivations on the gravity equation, transport costs are rarely modelled explicitly.
Button (Citation2010) considered distance as an explanatory determinant for generalised costs. Similarly, Hanssen, Mathisen, and Jørgensen (Citation2012) argued that distance influences time, damage costs, and price. On that note, most studies describe the relationship between distance and trade pattern as inverse, meaning that growing distance should impede trade (e.g. Disdier and Head Citation2008). However, Limao and Venables (Citation2001) found that using distance alone explains only 10% of the variation of transport costs; this is much lower than the approximately 50% explained when variables of infrastructure are included (Wilmsmeier Citation2014).
Baier and Bergstrand (Citation2001) extended the gravity model and estimated the relative contributions of transport cost decline, income growth, income convergence, and trade liberalisation to explain world trade growth. Their empirical analysis showed that approximately 67–69% of the growing real bilateral trade flows among 16 countries in the Organisation for Economic Co-operation and Development (OECD) could be explained by real GDP growth; tariff-rate reductions and preferential trade agreements (23–26%); and transport cost decline (8–9%). While economic growth is often seen as an indicator of maritime trade growth (e.g. Stopford Citation2008; Michail Citation2020), Gani (Citation2017) did not find any significant effect of economic growth represented by GDP on bilateral trade. Moreover, Yip (Citation2012) found that GDP per capita (GDPPC) and trade sometimes had a negative correlation and other times no significant correlation.
Some studies claim that logistics plays an important role in international trade. Arvis et al. (Citation2012) have suggested that poor logistics affects a country’s competitive advantage negatively. Previous studies have used a multidimensional factor, ‘logistics performance,’ as a measure of logistics (e.g. Gani Citation2017; Munim and Schramm Citation2018). Gani (Citation2017), assessed the impact of logistics performance on international trade using measures developed by the World Bank, such as the ability to track and trace consignments, competence and quality of logistics services, ease of arranging competitively priced shipments, efficiency of the customs clearance process, frequency with which shipments reach the consignee within scheduled or expected time, and quality of trade and transport-related infrastructure. The analysis showed that logistics performance overall has a positive and statistically significant correlation with export and import flows. Similarly, Munim and Schramm (Citation2018), evaluated the impact of logistics performance on maritime trade in containers and national economies in 91 countries. They confirmed a strong direct positive impact of logistics performance on both maritime trade and national economies.
Cho (Citation2014) pointed out that logistics aspects such as port freight, facilities, hinterland access, port productivity, sufficient capability, and container port development represent internal determinants to increase container traffic volumes in previous studies. According to Lun, Carlton, and Bichou (Citation2016), high-quality trade and transport infrastructures can provide logistics services that enhance the efficiency of trade-related activities. Their study found that the existence of effective trade facilitation lowers trade costs. Hence, improving infrastructure for trade facilitation measures increases imports and boosts exports through better access and greater participation in global and regional value chains (Portugal-Perez and Wilson Citation2012).
As both maritime and air freight transportation depend on petroleum, international trade is also influenced by fluctuations in energy prices (Rodrigue Citation2020); thus, oil prices have also been considered a determinant of maritime trade (e.g., Stopford Citation2008; Michail Citation2020). Although increasing oil prices affect GDP per capita and total trade turnover positively (e.g. Mukhtarov et al. Citation2021), there is no clear relationship between oil prices and world economic growth according to Ghalayini (Citation2011).
Last but not least, climate change, wars, pandemics, etc., which can upset the stability of the global economy, are often referred to as ‘uncertainties’ which can severely impact the shipping market. When it comes to assessing this impact, Cho (Citation2014) found that there was only a slight negative correlation between institutional, labour, and maritime uncertainties, and the volume of container traffic. Stopford (Citation2008), however, argued for the significance of political impacts on the sea market. The World Uncertainty Index (WUI), developed by Ahir, Bloom, and Furceri (Citation2018), is a measure of world uncertainty and its potential sources. These authors found that the level of world uncertainty is significantly higher in developing countries and negatively associated with GDP growth. While WUI can offer valuable insights into the impact of world uncertainty on maritime trade, no studies were found on it.
2.2. Conceptual model
Most studies analysing the effect of using the Northeast Passage on international trade, have used gravity models (e.g. Martínez-Zarzoso Citation2013; Bekkers, Francois, and Rojas‐Romagosa Citation2018; Liu et al. Citation2019). The shorter distance of transport via the NEP has been assumed to decrease costs. Using this assumption, Liu et al. (Citation2019) analysed the impact of the NEP on total trade, export, and import volumes between China and European countries. In addition to distance, Martínez-Zarzoso (Citation2013) augmented the traditional gravity model with the rate of piracy, assuming that the decreased piracy risk in NEP would decrease the transport costs. Martínez-Zarzoso (Citation2013) focused on annual exports from 27 European countries to 21 destinations in Asia. Bekkers, Francois, and Rojas‐Romagosa (Citation2018) estimated bilateral trade cost reductions between trading partners due to the shorter distance of the NEP, and simulated the effects of the commercial opening of the route on bilateral trade flows and CO2 emissions. To estimate the impact of using the Northern Sea Route on the liquified natural gas (LNG) trade and the economic growth of countries, Shibasaki et al. (Citation2018) integrated the route in the analysis via the unit costs of LNG shipping.
This study focuses on maritime trade transported by container ships. From the liner shipping perspective, a year-round and effective service is essential to the container shipping industry (Rodrigue Citation2020). According to Stopford (Citation2008), the main principle of liner shipping is to provide a fixed service at regular intervals between select ports and to offer the transport of any goods in the catchment area served by those ports on their sailing dates, whether container ships are filled or not.
Given the current uncertainties regarding melting ice, transport logistic barriers, and geopolitical issues associated with the NSR, it is hard to predict when the NEP will become fully operational. This study, however, adopts a ‘what-if approach’, which assumes that logistics and geopolitical issues related to navigating the Arctic have been resolved, and that the NEP is fully operational all year-round. The same approach was employed by Bekkers, Francois, and Rojas‐Romagosa (Citation2018). As such, this study assumes that if the NEP was to be opened with developed logistical infrastructure in place, it could offer a more efficient shipping route than the route via the Suez Canal. This can improve logistics performance of transport services between trade partners and increase the volume of maritime trade transported by containers between countries using this route.
Instead of distance alone, the freight costs variable was created as a measure for the maritime transport costs. This factor is very important for the NEP discussions due to the considerable distance savings compared to the currently used maritime route between NE Asia and NW Europe. Shorter distance can decrease freight costs, stimulating trade. While it is important to note that the certainty of this relationship to freight costs cannot be guaranteed because sailing via the NEP implies high icebreaker support fees, these calculations are not within the scope of the current study. Instead, the focus is on identifying the types of trade flow that are more sensitive to changes in logistics performance and freight costs.
Theoretical perspectives and variables affecting international trade were incorporated to examine trade by container ships. The proposed conceptual model, presented in , combines elements of previous models (Cho Citation2014; Gani Citation2017; Munim and Schramm Citation2018) and includes an additional variable, world uncertainty. Variables such as logistics performance and freight costs are considered as contextual variables, while economic growth, oil prices, and world uncertainty are considered as control variables in the model. In line with earlier applications of such models, the structural equation modelling approach is adopted to include the direct and indirect effects between variables.
Figure 1. Conceptual model for maritime trade by container ships.
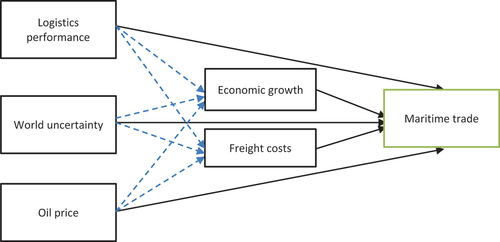
The solid lines in indicate the direct relationship between the dependent and independent variables. Logistics performance, freight costs, world uncertainty, economic growth, and oil prices are assumed to directly affect the volume of trade goods transported by container ships. In line with previous studies, logistics performance is expected to affect trade positively, while the increase of oil prices and freight costs is expected to affect trade negatively. From the reviewed empirical studies, it is difficult to unambiguously conclude the expected effect of economic growth on trade volume, while the direct and indirect effects of world uncertainty are unclear and not presumed in advance.
The dotted lines in mark the relationship between the independent variables; thus, the indirect relationship between the dependent and independent variables. Considering the findings of past empirical studies accounted for in Section 2.1, links between logistics and economic growth, logistics and freight costs, oil prices and economic growth, and oil prices and freight costs were included. Additionally, the impact of world uncertainty on maritime trade was verified via mediating variables, such as freight costs and economic growth. However, some relationships, like the link between world uncertainties and oil prices, were not integrated into this model due to limited samples for both variables.
Considering that effective logistics can decrease freight costs, the positive indirect effect of logistics performance via freight costs is expected on maritime trade. Although the effect of economic growth on maritime trade by containers is unclear and can vary, logistics development has a positive effect on regional economics (e.g. Lun, Carlton, and Bichou Citation2016; Munim and Schramm Citation2018); therefore, a positive mediating effect of logistics performance on maritime trade is expected through economic growth.
To summarise, literature on this field has suggested the expected effects for most relationships based on experiences from other sea routes. This forms the foundation for this study’s theoretical framework which aims to investigate the effect of these variables on container ship trade. The subsequent section describes the method used in this study to apply this conceptual model () to the investigation of aggregated and disaggregated container ship trade between countries in NE Asia and NW Europe using empirical data.
3. Data and methodology
3.1. Data
The empirical dataset used in this study was based on several open sources. The World Bank database was used to collect annual data per country, for exogenous and mediating variables such as indicators related to logistics performance and economic growth (The World Bank Citation2021). Average annual Brent crude oil prices were collected from www.statista.com. The report of the United Nations Conference on Trade and Development 2018 from https://unctad.org/system/files/official-document/rmt2018_en.pdf was used to collect the historical annual data on the required freight rates per 20-foot equivalent unit. Information on the average annual WUI was obtained from http://www.policyuncertainty.com/wui_quarterly.html. Data on maritime trade between countries were obtained from European Statistics (Eurostat Citation2021). Given that this study classifies the direction of trade flow into westbound and eastbound trade flows, data of maritime trade were divided into two datasets ‘westboundset’ and ‘eastboundset’. presents a summary of the variables’ definitions and their measures.
Table 1. Variable description.
For expressing the effectiveness of logistical service, the indicator of the quality of trade and transport infrastructure (lp) as one among six dimensions of logistical performance developed by the World Bank was used. This indicator is presented on a Likert scale from 1 (very low level) to 5 (very high level) and collected in a worldwide survey of local operators (global freight forwarders and courier carriers) to measure the effectiveness of logistics in each country of operation. Since the six indicators of logistics performance are highly correlated with each other (measured by the Cronbach’s alpha − 0.96), the explanatory power was not substantially affected when considering only one observed indicator in the model. To create the indicator which is related to pair of countries participated in trade, the average value was calculated.
In container shipping practice, freight refers to any amount paid to carriers for transporting the container from origin to final destination (Wilmsmeier Citation2014). Freight cost (tc) is defined as the cost for transporting one tonne of cargo in a container between two countries participated in trade. Data on the distance between countries in NW Europe and NE Asia through the Suez Canal were collected from www.sea-distances.org. Historical statistics of average annual container freight rates between Shanghai and Northern Europe—in US dollars per 20-foot equivalent unit—were used for calculations and converted into rates per tonnes. Since there is a lack of open statistics for maritime freight rates for the opposite direction, the same values were assumed for both directions in SEM analysis. However, this is a simplification since in Europe–Asia transport there is an imbalance in volumes between eastbound and westbound trades (Eurostat Citation2021) leading to possible differences in freight rates between the directions.
The eg indicator is the GDPPC, meaning the production value of the country allocated to each resident. This was converted to international US dollars after controlling for purchasing power parity (PPP). The op indicator is the Brent oil price, which is the world’s leading price benchmark for Atlantic basin crude oil. Annual values are used in US dollars per barrel. The wu variable is an index of world uncertainty (Ahir, Bloom, and Furceri Citation2018). It is constructed by quarterly indices for 143 countries using frequency counts of ‘uncertainty’ (and its variants) in the quarterly Economist Intelligence Unit country reports. The average annual indices were obtained from these quarterly data.
In previous studies by Cho (Citation2014) and Munim and Schramm (Citation2018), maritime trade was defined by container or cargo throughout and by the liner-shipping connectivity index. These indicators, however, do not show what is really transported in containers. To identify differences between commodity groups, the annual tonnage of trade transported by containers (mt) according to the Harmonised System (HS) (Eurostat Citation2021) was chosen as a measure of a country’s maritime trade in this study.
3.2. Sampling
The sample includes 16 countries (NW Europe: Belgium, Denmark, Estonia, Finland, France, Germany, Ireland, Latvia, Lithuania, the Netherlands, Poland, Sweden, and the United Kingdom; NE Asia: China, Japan, and South Korea) that have seaports and access to the sea. These countries were selected because the NEP might offer them a favourable alternative to existing routes between NW Europe and NE Asia, e.g. the Suez Canal, by shortening the geographic distance of their trade routes. From this perspective, these countries were identified as potential users of the NEP for international trade transits between NW Europe and NE Asia.
Distance analysis by Leypoldt (Citation2015) showed that European trade with Japan, northern China, and South Korea is likely to benefit most from the NEP. In contrast, locations to the south and west of a crest line like ports in Oceania, Australia, Singapore, Malaysia, Thailand, and India will have little to no advantage from sailing the NEP in terms of reduced distance (Leypoldt Citation2015).
Although Norway and Iceland are potential users of the NEP, they were not considered in the analysis because they are not part of the European Union, and they report seaborne trade statistics to another commodity classification system, namely the Standard International Trade Classification (SITC). Compared with the HS classification, the SITC classification is used to provide aggregate data for short- and long-term indicators (Eurostat Citation2021). There is an issue with the conversion of maritime commodity group data from SITC to HS. However, this limitation would not significantly influence this study since these countries do not have a large volume of international trade compared to the sample countries.
The trade statistics provided information on selected countries and ranged from 2009 to 2018, producing 390 possible observations for each dataset (‘eastboundset’ and ‘westboundset’). This is a suitable sample size for SEM since it is more than 200 (Mehmetoglu and Jakobsen Citation2016). The limited period 2009–2018 was considered because of the lack of data for some indicators. The methods of linear interpolation and extrapolation were applied to some parts of the selected period for the indicator of logistics performance because of missing statistics in some years.
The OECD classification was used to select related commodity groups (OECD Citation2021). According to this classification, 88 out of the 99 groups may be transported in containers. The aggregated volumes of the 88 groups were used for both the westbound and eastbound parts of the dataset for the total volume transported by container ships. Given that it could not be confirmed whether all 88 groups are currently transported only by container ships, it is possible that some goods categories are overestimated or vice versa.
The descriptive statistics for the observed variables for the westboundset and eastboundset are presented in .
Table 2. Descriptive statistics for westboundset and eastboundset (N = 390).
Since the data used for empirical analysis involved large numbers, they were log-transformed for the analyses similar to previous studies (e.g. Munim and Schramm Citation2018) and were all in metric units. The empirical analysis of both datasets adopted cross-sectional estimations of the data. The data were pooled, and the estimation phase combined cross-pairs of origin and destination countries as well as time-series data.
shows pair-wise correlations between the log-transformed variables. The magnitude of multicollinearity between the exogenous variables was relatively small and should not interfere with the analysis.
Table 3. Pair-wise correlations (N = 390).
3.3. Research method
This study applies SEM to investigate the effects of the independent factors on the main dependent factor—maritime trade. SEM is a statistical modelling technique that can accommodate a large number of endogenous and exogenous variables as well as latent (unobserved) variables specified as linear combinations (weighted averages) of the observed variables (Golob Citation2003). This approach was implemented previously in several maritime studies (e.g. Cho Citation2014; Munim and Schramm Citation2018).
An alternative approach could be the pooled Ordinary Least Squares analysis for panel data. This is, however, not a desirable approach since it is not possible to separate selection effects from real effects and check the mediating effects of the variables. Still, the pooled panel regression has been carried out as a robustness check and results are largely consistent with those of the SEM approach. SEM was chosen over other multivariate modelling techniques because this approach enables modelling multiple dependent variables simultaneously and testing overall model fit, direct and indirect effects, complex and specific hypotheses, and parameter invariance across multiple between-subjects groups (Mehmetoglu and Jakobsen Citation2016). All statistical analyses were performed using STATA SE 15.1.
A standard linear SEM was used in this analysis, and the parameters were estimated by the Maximum Likelihood method. The Satorra-Bentler rescaling method was used for SEM estimation to avoid non-normal distributed variables, as suggested by Rosseel (Citation2012). This method was developed to adjust the goodness-of-fit chi-square for bias due to multivariate non-normality. In addition, asymptotically distribution-free (ADF) estimation was applied to verify the robustness of the results.
4. Empirical analysis, results, and discussion
4.1. SEM results and discussion
Goodness-of-fit statistics for the SEM approach are presented in . Generally, an adequate goodness-of-fit of the model is achieved for both analysed datasets according to the accepted rules (e.g. Mehmetoglu and Jakobsen Citation2016).
Table 4. Goodness-of-fit statistics for model for westbound and eastbound maritime trade.
According to , the structural model in both cases (westbound and eastbound maritime trade) has a good fit to the Satorra-Bentler chi-square and degrees of freedom—which are within the required levels recommended by Schreiber et al. (Citation2006). Other fit index measures, such as CFI and Tucker Lewis Index (TLI), are well above the minimum requirements (Mehmetoglu and Jakobsen Citation2016). According to RMSEA and SRMR measures, the model fit is deemed acceptable (Schreiber et al. Citation2006). The ADF estimation showed similar results in the case of magnitude, sign, and significance of coefficients for both datasets with a good fit. This points to the robustness of the results.
After confirming a good fit for the proposed SEM, the relationships between the analysed variables were estimated. Baseline SEM analyses of the two datasets, including the estimated standardised factor loadings and regression coefficients, along with their respective paths, are presented in . All variables in are referred to by their abbreviations, which are defined in . A more detailed presentation of these results with standard errors is also included in Appendix .
Figure 2. Model results. a) Westbound trade. b) Eastbound trade.
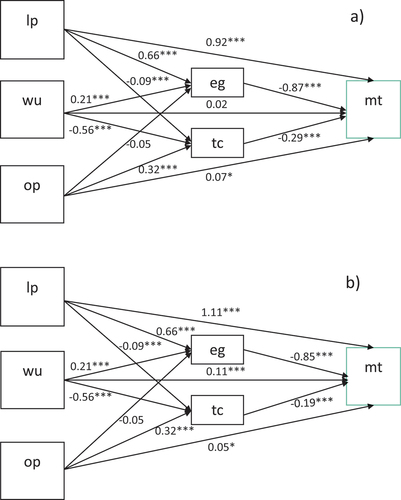
It is evident from that all direct effects, except oil price (op) and world uncertainty (wu), are significant at the 1% level in westbound trade (mt from ). However, for eastbound trade (mt from ), the effect of world uncertainty is significant at the 1% level. The direct effect of oil prices on maritime trade by container for both directions of trade is significant only at the 10% level.
The coefficients in confirm that logistics performance (lp) is the most important determinant of international maritime trade by container ships between the analysed regions. Consequently, improving this factor has the greatest potential for facilitating trade. This adds to the hypotheses proposed by Gani (Citation2017) and Munim and Schramm (Citation2018), using a sample representing a narrower geographical region with a different trade volume indicator as the dependent variable. Munim and Schramm (Citation2018) obtained a coefficient value that was almost half for the effect of logistics performance on global seaborne trade compared with the trade between NE Asia and NW Europe. However, it was found that the direct impact of logistics performance is greater for eastbound trade.
It is evident that freight costs (tc) have a negative direct effect on maritime trade (Wilmsmeier Citation2014). This is one of the important factors that may explain the trade volume for containers in the analysed regions. However, the precise effect for eastbound trade is not directly transferable from the estimates of westbound trade. The freight rates were the same during the analysis for both directions but should be changed in the future by applying precise data for eastbound direction and taking into account the differences in freight rates due to imbalanced trade.
A positive but less significant relationship was found between world uncertainty and eastbound trade. This factor, however, negatively influenced trade volume for both directions mediating by GDPPC (eg) and positively influenced trade mediating by freight costs but at a lower level. Since WUI - representing world uncertainty - was only recently developed, the findings of this study can only be compared to those of Ahir, Bloom, and Furceri (Citation2018) on the relationship between WUI and economic growth. They measured economic growth using the GDP of the country and not the GDPPC. The positive effect of increased WUI on the GDPPC of countries in NE Asia and NW Europe in this study contrasts their findings.
The model provides interesting results on the relationship between GDPPC and maritime trade. Economic growth presents a significant negative effect on maritime transport in both directionsFootnote2. This implies that both increased logistics performance and world uncertainty negatively influence maritime trade through GDPPC. This is a seemingly counterintuitive result, but there are possible explanations. Munim and Schramm (Citation2018, 14) gave the following reasons for the non-positive significant association between seaborne trade and national economy in developed economies: '(1) the growth rates of GDPPC compared to the seaborne trade of developed countries is lower than that of developing countries and (2) developed countries are service-based economies and the role of seaborne trade is often one-way (imports), while developing countries tend to be more industry-based and trade plays a two-way role (both imports and exports)'.
Oil price was used as a control variable in the model. Although the estimation did not point to direct effects of oil price on either westbound or eastbound maritime trade, this variable has a significant negative indirect impact on maritime trade. This occurs through increased freight costs for both routes in response to rising in oil prices and increasing bunker costs (Hanssen, Mathisen, and Jørgensen Citation2012).
4.2. Disaggregated analysis of different commodity groups
The conceptual model was applied to several commodity groups to gain a deeper understanding of container market demand characteristics between NE Asia and NW Europe. In this first attempt to discuss the possible impact of using the NEP for regular shipping on the container trade between considered regions, the focus was purely on westbound trade. This direction had the highest total tonnage of cargo flow transported by container ships in the selected period according to Eurostat (Citation2021) and the most precise data for freight costs. Eastbound trade is not considered for disaggregated analysis due to the data limitations of freight cost variable. Commodity groups exported in the largest volumes between 2009 and 2018 from NE Asia to NW were selected from the Eurostat database for disaggregated analyses. These commodities categorized by HS classification included: (1) ‘electrical machinery, equipment, and parts thereof’; (2) ‘plastics and articles thereof’; (3) ‘boilers, mechanical appliances, and parts thereof’; and (4) ‘vehicles and parts thereof’.
The differences in parameter values for commodity groups help to understand the sensitivity of maritime trade volume to the analysed factors. Particular attention was given to logistics performance and freight cost since they are contextual factors and are important for the NEP discussion. Although the indicator of world uncertainty does not have any special relevance for the NEP, its effect on disaggregated trade is taken into consideration in this section as it is a new variable that has been included in the proposed container ship demand model.
presents the extraction of the disaggregated SEM results for the selected commodity groupsFootnote3. As the model specification is in log–log form, the estimated coefficients can be interpreted as elasticities - i.e., one unit change in the independent variable leads to a percentage change in the dependent variable. The interpretation of the model results was suggested by Martínez-Zarzoso (Citation2013). However, it is not possible to connect the coefficient to the NEP at the time being because there is currently no certainty on how much freight costs would decrease as a percentage by using this route. The same applies to predicting logistics performance.
Table 5. Disaggregated SEM estimation results for selected commodity groups for westbound trade.
Furthermore, shows that logistics performance (lp) has the greatest effect on the trade volume of all commodity groups studied and that lp coefficients are quite similar for these groups. Maritime trade volumes for commodity groups 3 and 4 are the most sensitive to logistics performance. The ‘plastic and articles thereof’ group is the least sensitive to changes in the lp of countries participating in trade; however, an increasing logistics performance could still increase its volume substantially. The most popular commodity groups transported by container ships are therefore sensitive to the indicator of quality of trade and transport infrastructure (lp). If sailing via the NEP would enable improved lp, trade for these groups could be stimulated.
Lastly, illustrates that transported volumes are sensitive to freight costs. The ‘plastics and articles thereof’ group is the most and group 4 is the least sensitive to changes in freight costs. Lasserre and Faury (Citation2019) found a 19% reduction in distance between Shanghai and Rotterdam via the NEP. Nonetheless, it is difficult to correlate this with a reduction in freight costs at the moment because using the NEP entails using vessels with ice class, icebreaking support, and having a limited navigational season. While analysing this relationship is beyond the scope of this article, these findings suggest that if using NEP decreases freight costs for container shipping due to shorter distances and good logistical infrastructure, it may increase cargo trade in groups 1, 2, and 3.
Although world uncertainty did not show a direct significant impact on aggregated westbound trade, the model showed indirect significant effects of this factor through freight costs and economic growth. According to the disaggregated SEM results, wu has the most significant indirect positive impact on groups 2 and 3. This is mediated by freight costs and indirect negative impacts of economic growth to groups 1 and 3. The results also show that commodities ‘vehicles and parts thereof’ imported in NW Europe from NE Asia are less sensitive to world uncertainty.
5. Conclusions and future research
In conclusion, the extended maritime trade model and disaggregated analyses contribute to furthering discussions on the potential of maritime trade between NE and NW Europe. Identifying the importance of logistical performance through this study is particularly useful for policymakers and shipping companies when planning infrastructure development and transport corridor support services. This research has limitations, mainly due to the unavailability of published long-term time-series data for empirical analysis and transferability of the Northeast Passage in the model, since the container line for this route has not yet been established. This impedes further model extensions.
Nonetheless, this study contributes to maritime economics literature in various ways. First, world uncertainty was distinguished as an important new variable for the container ship demand model. Second, the extended conceptual model developed () demonstrated a high goodness-of-fit with its robustness tested by analysing two datasets with separate directions of trade flow. Therefore, this model may be applied to other regions and in the context of other transport routes. Third, logistics performance, freight costs, and economic growth were identified as the main determinants of maritime trade for tonnes transported by containers from NE Asia to NW Europe. Similarly, world uncertainty measured by the WU Index, had a significant positive impact on maritime trade by containers for eastbound trade. Finally, the disaggregated analyses provide insights into commodity groups for westbound trade. For example, while container shipping via the Northeast Passage could increase logistics performance and decrease freight costs, the volume of westbound trade could increase significantly.
Future research should advance the integrated interdisciplinary knowledge presented in this study. Here, five different directions for research are proposed. First, future studies could include statistics from Norway and Iceland to provide both a more comprehensive representation of maritime trade between NE Asia and NW Europe and improved indicators for transport costs for both directions of trade and logistics performance. Second, an extended model could be used to investigate elasticity of trade volume and estimate actual future cargo flows. To do this, information about time and cost savings as well as risk for damage in using the Northeast Passage are needed. Third, disaggregated analyses of more commodity groups could offer insight into different markets of westbound and eastbound trade. Fourth, as restrictions related to sustainability will become increasingly important, future studies should take environmental indicators into consideration and apply them to expand the discussion on the decarbonisation of the shipping industry. Finally, agent-based models could be applied to study the future of international trade and willingness to implement new technologies.
Acknowledgments
First and foremost, I express my gratitude to Prof. Terje Andreas Mathisen for his useful suggestions on the preliminary versions of this manuscript. I also wish to thank the editors and reviewers at the Journal of Maritime Policy & Management, as well as reviewers at the IAME Conference 2021 Rotterdam - ‘Accelerating Transitions’, for their valuable comments. Additionally thanks go to Lydia Mehrara, Tomi Solakivi, Gisle Solvoll, Albert Satorra, Henrik Falck and Björn Gunnarsson for their feedback at different stages during the production of this work.
Disclosure statement
No potential conflict of interest was reported by the author.
Notes
1. Aggregated trade means total trade volume without splitting in commodity groups.
2. Sample includes more developed countries than developing countries (Section 3.2). It is, however, uncertain whether this skewness influences the estimation results.
3. Like , the full model was applied, but only the variables most relevant to NEP were presented using westbound trade as an example. Model results for all four commodity groups provide sufficiently good model fit similar to that accounted for in Section 4.1 for the overall model.
References
- Ahir, H., N. Bloom, and D. Furceri. 2018. “The World Uncertainty Index.” SSRN Working Paper 3275033. Available at: https://ssrn.com/abstract=3275033.
- Arvis, J.-F., M. A. Mustra, L. Ojala, B. Shepherd, and D. Saslavsky. 2012. Connecting to Compete 2012: Trade Logistics in the Global Economy-The Logistics Performance Index and Its Indicators. Washington: The World Bank.
- Baier, S. L., and J. H. Bergstrand. 2001. “The Growth of World Trade: Tariffs, Transport Costs, and Income Similarity.” Journal of International Economics 53 (1): 1–27. https://doi.org/10.1016/S0022-1996(00)00060-X.
- Bekkers, E., J. F. Francois, and H. Rojas‐Romagosa. 2018. “Melting Ice Caps and the Economic Impact of Opening the Northern Sea Route.” The Economic Journal 128 (610): 1095–1127. https://doi.org/10.1111/ecoj.12460.
- Blonigen, B. A., and W. W. Wilson. 2013. “The Growth and Patterns of International Trade.” Maritime Policy & Management 40 (7): 618–635. https://doi.org/10.1080/03088839.2013.851454.
- Button, K. 2010. Transport Economics. Cheltenham: Edward Elgar Publishing.
- Cho, H. S. 2014. “Determinants and Effects of Logistics Costs in Container Ports: The Transaction Cost Economics Perspective.” The Asian Journal of Shipping and Logistics 30 (2): 193–215. https://doi.org/10.1016/j.ajsl.2014.09.004.
- Disdier, A. C., and K. Head. 2008. “The Puzzling Persistence of the Distance Effect on Bilateral Trade.” The Review of Economics and Statistics 90 (1): 37–48. https://doi.org/10.1162/rest.90.1.37.
- Eichengreen, B., and D. A. Irwin. 1995. “Trade Blocs, Currency Blocs and the Reorientation of World Trade in the 1930s.” Journal of International Economics 38 (1–2): 1–24. https://doi.org/10.1016/0022-1996(95)92754-P.
- Eurostat. 2021. “Extra-EU Trade Since 2000 by Mode of Transport, by HS2-4-6 (DS-058213) of the Category ‘International Trade and Goods’.” European Statistics. Accessed May 25 2022. https://ec.europa.eu/eurostat/data/database.
- Gani, A. 2017. “The Logistics Performance Effect in International Trade.” The Asian Journal of Shipping and Logistics 33 (4): 279–288. https://doi.org/10.1016/j.ajsl.2017.12.012.
- Ghalayini, L. 2011. “The Interaction Between Oil Price and Economic Growth.” Middle Eastern Finance and Economics 13 (21): 127–141.
- Golob, T. F. 2003. “Structural Equation Modeling for Travel Behavior Research.” Transportation Research Part B: Methodological 37 (1): 1–25. https://doi.org/10.1016/S0191-2615(01)00046-7.
- Gunnarsson, B. 2021. Recent ship traffic and developing shipping trends on the Northern Sea Route—Policy implications for future arctic shipping. Marine Policy 124: 104369. https://doi.org/10.1016/j.marpol.2020.104369.
- Hanssen, T.-E., T. A. Mathisen, and F. Jørgensen. 2012. “Generalized Transport Costs in Intermodal Freight Transport.” Procedia - Social & Behavioral Sciences 54: 189–200. https://doi.org/10.1016/j.sbspro.2012.09.738.
- Hermann, R. R., N. Lin, J. Lebel, and A. Kovalenko. 2022. “Arctic Transshipment Hub Planning Along the Northern Sea Route: A Systematic Literature Review and Policy Implications of Arctic Port Infrastructure.” Marine Policy 145: 105275. https://doi.org/10.1016/j.marpol.2022.105275.
- Kang, W., F. P. Perez de Gracia, and R. A. Ratti. 2017. “Oil Price Shocks, Policy Uncertainty, and Stock Returns of Oil and Gas Corporations.” Journal of International Money & Finance 70 (C): 344–359. https://doi.org/10.1016/j.jimonfin.2016.10.003.
- Lasserre, F., and O. Faury. 2019. Arctic Shipping: Climate Change, Commercial Traffic and Port Development. Abingdon: Routledge. https://doi.org/10.4324/9781351037464.
- Leypoldt, P. 2015. “The Capacity Potential of the Northern Sea Route by 2050.” In The Northern Sea Route, edited by M. M. Keupp, 89–105. Wiesbaden: Springer Fachmedien Wiesbaden. https://doi.org/10.1007/978-3-658-04081-9_6.
- Limao, N. and A. J. Venables. 2001. Infrastructure, geographical disadvantage, transport costs, and trade. The World Bank Economic Review 15 (3): 451–479. https://doi.org/10.1093/wber/15.3.451.
- Liu, D., H. Wen, F. Guo, and C. Wang. 2019. The Impact of Northern Sea Route on Sino-European Trade Potential Based on Gravity Model. In Proceedings of the 3rd International Conference on Culture, Education and Economic Development of Modern Society (ICCESE 2019): 1731–1735. https://doi.org/10.2991/iccese-19.2019.380.
- Lun, Y. H. V., J. Carlton, and K. Bichou. 2016. “Examining the Economic Impact of Transport Complex Economies.” Journal of Shipping and Trade 1 (1): 1–17. https://doi.org/10.1186/s41072-016-0005-3.
- Martínez-Zarzoso, I. 2013. “Alternative Sea Routes.” SAIS Review of International Affairs 33 (2): 61–74. https://doi.org/10.1353/sais.2013.0020.
- Meersman, H., and E. Van De Voorde. 2013. “The Relationship Between Economic Activity and Freight Transport.” In Freight Transport Modelling, edited by M. Ben-Akiva, H. Meersman, and E. Van De Voorde, 15–34. Bingley: Emerald Group Publishing Limited. https://doi.org/10.1108/9781781902868-002.
- Mehmetoglu, M., and T. G. Jakobsen. 2016. Applied Statistics Using Stata: A Guide for the Social Sciences. London: Sage.
- Michail, N. A. 2020. “World Economic Growth and Seaborne Trade Volume: Quantifying the Relationship.” Transportation Research Interdisciplinary Perspectives 4. https://doi.org/10.1016/j.trip.2020.100108.
- Mukhtarov, S., S. Humbatova, M. Mammadli, and N. G. O. Hajiyev. 2021. “The Impact of Oil Price Shocks on National Income: Evidence from Azerbaijan.” Energies 14 (6): 1695. https://doi.org/10.3390/en14061695.
- Munim, Z. H., and H.-J. Schramm. 2018. “The Impacts of Port Infrastructure and Logistics Performance on Economic Growth: The Mediating Role of Seaborne Trade.” Journal of Shipping and Trade 3 (1): 1. https://doi.org/10.1186/s41072-018-0027-0.
- OECD. 2021. “Maritime Transport Costs (At 2 Digit Level-HS1988).” The Organization for Economic Co-Operation and Development. Accessed June 20 2022. https://stats.oecd.org/.
- Portugal-Perez, A., and J. S. Wilson. 2012. “Export Performance and Trade Facilitation Reform: Hard and Soft Infrastructure.” World Development 40 (7): 1295–1307. https://doi.org/10.1016/j.worlddev.2011.12.002.
- Pruyn, J. F. J. 2016. “Will the Northern Sea Route Ever Be a Viable Alternative?” Maritime Policy & Management 43 (6): 661–675. https://doi.org/10.1080/03088839.2015.1131864.
- Rodrigue, J.-P. 2020. The Geography of Transport Systems. London: Routledge. https://doi.org/10.4324/9780429346323.
- Rosseel, Y. 2012. “Lavaan: An R Package for Structural Equation Modeling and More. Version 0.5–12 (BETA).” Journal of Statistical Software 48: 1–36. https://doi.org/10.18637/jss.v048.i02.
- Schreiber, J. B., A. Nora, F. K. Stage, E. A. Barlow, and J. King. 2006. “Reporting Structural Equation Modeling and Confirmatory Factor Analysis Results: A Review.” Journal of Educational Research 99 (6): 323–338. https://doi.org/10.3200/JOER.99.6.323-338.
- Shibasaki, R., T. Usami, M. Furuichi, H. Teranishi, and H. Kato. 2018. “How Do the New Shipping Routes Affect Asian Liquefied Natural Gas Markets and Economy? Case of the Northern Sea Route and Panama Canal Expansion.” Maritime Policy & Management 45 (4): 543–566. https://doi.org/10.1080/03088839.2018.1445309.
- Stopford, M. 2008. Maritime Economics 3rd Ed. Routledge. https://doi.org/10.4324/9780203891742.
- Wilmsmeier, G. 2014. International Maritime Transport Cost: Market Structure and Network Configurations. Abingdon: Routledge.
- The World Bank. 2021. World Bank Open Data. Accessed May 15 2022. https://data.worldbank.org/.
- Yip, T. L. 2012. “Seaborne Trade Between Developed and Developing Countries.” The Asian Journal of Shipping and Logistics 28 (3): 369–389. https://doi.org/10.1016/j.ajsl.2013.01.005.
- Zhao, Y., S. Liu, J. Zhou, and Y. Ma. 2022. “Economic and Environmental Feasibility of Northern Sea Route for Container Service: Impact by Ice Besetting Events.” Maritime Policy & Management 1–24. https://doi.org/10.1080/03088839.2022.2084789.
Appendix
Table A1. Model results for westbound trade and eastbound trade.