
Abstract
Walking speed is an important indicator of worsening in a variety of neurological and neuromuscular diseases, yet typically is measured only infrequently and in a clinical setting. Passive measurement of walking speed at home could provide valuable information to track the progression of many neuromuscular conditions. The purpose of this study was to validate the measurement of walking speed by a shelf-top ambient measurement system (AMS) that can be placed in a patient’s home. Twenty-eight healthy adults (16 male, 12 female) were asked to walk three pre-defined routes two times each (total of 168 traversals). For each traversal, walking speed was measured simultaneously by five sources: two independent AMSs and three human timers with stopwatches. Measurements across the five sources were compared by generalised estimating equations (GEE). Correlation coefficients compared pairwise for walking speeds across the two AMSs, three human timers, and three routes all exceeded 0.86 (p < .0001), and for AMS-to-AMS exceeded 0.92 (p < .0001). Aggregated across all routes, there was no significant difference in measured walking speeds between the two AMSs (p = .596). There was a statistically significant difference between the AMSs and human timers of 8.5 cm/s (p < .0001), which is comparable to differences reported for other non-worn sensors. The tested AMS demonstrated the ability to automatically measure walking speeds comparable to manual observation and recording, which is the current standard for assessing walking speed in a clinical setting. The AMS may be used to detect changes in walking speed in community settings.
1. Background
Walking speed is an important indicator of worsening in a variety of neurological and neuromuscular diseases. For example, changes in walking speed have been shown to be important in multiple sclerosis [Citation1], Parkinson’s disease [Citation2], and Alzheimer’s disease [Citation3]. Walking speed is linked to general levels of disability and morbidity in older adults [Citation4,Citation5] and has even been dubbed the “sixth vital sign” [Citation6].
Walking ability is often assessed in clinical trials and clinical settings by one or more walking tests such as the 6-min walk test (patient walks as far as possible in 6 min) [Citation2] and the timed 25-foot walk test (T25-FW, patient walks 25 feet as fast as possible) [Citation7]. These walking tests provide clinicians one component to gauge disease progression, but require the patient to present to the clinic to complete each test, plus adequate space to perform each test, and are limited by the duration and frequency of patient visits.
At-home monitoring of health has proven to be useful in some chronic conditions. For example, diabetic patients often measure blood glucose levels at least once per day, and patients with congestive heart failure often conduct daily weights. In contrast, in neurological and neuromuscular diseases such as multiple sclerosis, metrics for easy monitoring at home are not apparent. Tracking progression of these diseases depends either on (1) subjective patient input, which can be confounded by mood, recollection, adaptation to symptoms, and day-to-day activity, or (2) in-clinic visits to measure signs and symptoms. These in-clinic visits can be sporadic, and the tests performed may be subject to confounding factors. For example, walking tests may be affected by the “white coat” effect and MRI results may be subjected to inconsistency across providers [Citation8]. At-home tracking of real-world movements, such as walking speed or the use of cane or crutch, could provide frequent objective assessment of the severity and progression of some neurological and neuromuscular diseases.
A variety of research projects are underway, in both academic and commercial settings, which attempt to measure the movement of patients using wearable sensors such as FitBit or custom accelerometers [Citation9–12]. Many of these methods suffer from poor signal-to-noise ratios – for example, it is difficult to interpret the data output from a wearable sensor when little is known about the user’s environment (such as walking in a crowd vs. walking in a quiet hall) or activity (such as sitting, standing, or swimming). Many studies also suffer from low adherence, often stemming from the need for individuals to wear and to recharge devices. Though the receipt of continuous data from wearables may seem attractive when compared to the sparsity of in-clinic visits, the noise and ambiguity of wearable data are only amplified by sampling rate and quantity.
Other research projects use non-worn (touchless) sensors such as radar [Citation13], or the Microsoft Kinect (Version 1) [Citation14]. These devices often perform advantageously compared to wearables under laboratory conditions, but subsequently remain consigned to the province of academic research, lacking the affordability, durability and ease-of-use that are requisite for real-world adoption.
A middle ground that provides accurate measurements in a consistent context, while reducing barriers to patient adoption, could provide a way to quantify disease progression between in-clinic visits and to improve the signal-to-noise ratio of the collected data.
The present study is one of a series of research studies, which are cumulatively intended to produce an objective metric of the progression of neuromuscular disease in real-world settings using a novel automatic touchless sensor system, called an ambient measurement system (AMS). The AMS utilised in this study includes a Microsoft Kinect (Version 2) sensor, compactly packaged and bundled with custom software, and intended to overcome the key barriers to real-world, long-term use. The overall goals of the intended series of studies are to (1) provide patients with improved understanding of, and sense of control over, their condition and (2) improve treatment decisions and response time to disease relapse and progression in real-world settings.
2. Objectives
The objective of the present study was to perform initial validation of the accuracy of a new AMS mobility sensor from start-up company Atlas5D, based in Cambridge, MA. Atlas5D develops technology to measure and interpret human movement using automatic and touchless (non-worn) sensors that can be placed on shelf-tops in patient homes. Each AMS passively acquires metrics of movement from normal daily activities without requiring users to wear, remember, or recharge any devices.
The specific goals of this study were the validation of (1) intra-unit accuracy of a single AMS by correlating its output with manual measurements, and (2) inter-unit consistency between two AMSs by comparing simultaneous results under independent operation and different locations.
3. Methods
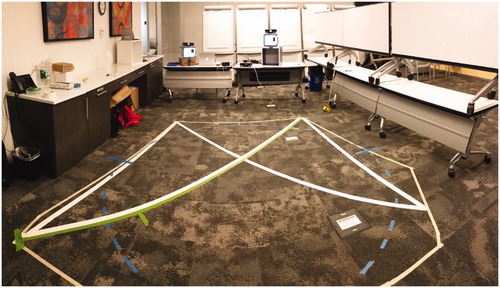
We compared two independent AMS sensors against manual measurements of walking speed for several pre-defined walking routes. The acquisition area for each traversal was an obstacle-free square approximately 2.5 m on each side, shown in . The size and shape of the acquisition area were selected in order to maximise simultaneous coverage (overlap) by the two independent AMS sensors, each of which had a range of approximately 5 m. The two independent AMSs were positioned so as to observe each participant from their two different vantage points onto the shared acquisition area. The first sensor (labelled AMS 1) was placed at the front-left corner of the acquisition area at a height of approximately 1 m above the floor. The second sensor (labelled AMS 2) was placed at the front-right corner of the acquisition area, approximately 2 m lateral and to the right of the first sensor, at a height of approximately 1.3 m above the floor and at an approximately 30° angle relative to AMS 1. Three human observers holding manual stopwatches were positioned around the acquisition area so as to have unobstructed views. shows a photograph of the test environment.
Figure 1. Diagram of data acquisition area.
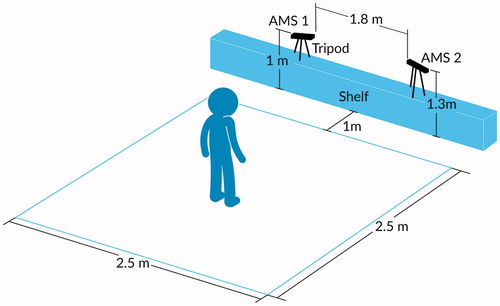
Figure 2. Photo of data acquisition area.
3.1. Walking routes
Each participant was instructed to walk three pre-defined routes that were marked in tape on the floor. Each route was walked twice by each participant. One participant had to leave early and did not complete the second set of walks, so this person’s data was excluded from analysis. Each route length was manually measured using a measuring wheel (Robert Bosch Tool Corp., Mount Prospect, IL). The time taken to walk each route was automatically recorded by the two independent AMSs and manually recorded by the three human timers. After each traversal, the pre-measured route length obtained by the measuring wheel was divided by each human timer’s recordation of elapsed time to calculate manual walking speed.
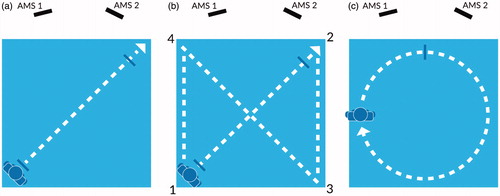
diagrams the three walking routes: (1) a linear single-segment route starting in the back-left corner of the acquisition area and ending in the front-right corner ( – route length 2.5 m), (2) a linear figure-eight or “X” route starting at the back-left then progressing in linear segments to front-right, back-right, front-left, back-left and ending at front-right ( – route length 16 m) and (3) a circular route consisting of three laps of an 8-m circumference circle ( – route length 8 m per lap, 24 m total).
Figure 3. Walking routes.
Along each walking route, coloured masking tape was placed on the floor to mark start and stop positions for the participants, and to delineate the route boundaries. Timing marks were placed on each route 0.5 m after the start and 0.5 m before the end, to synchronise the corresponding start and end of timing among the human timers. The three human timers were employees of Atlas5D, who were instructed to start stopwatch timing on the first footfall on or after the first timing mark, and to halt stopwatch timing on the first footfall on or after the end timing mark.
3.2. Participants
Participants were adult volunteers without neurological disorder, employed at Atlas5D or Biogen. The Biogen employees were employed at Biogen’s headquarters in Cambridge, MA, and recruited via an internal e-mail. The e-mail invited employees to volunteer for a morning session of data-gathering in a large conference room. The conference room was large enough to comfortably house all walking tests, and administrators cleared the acquisition area of furniture or other obstacles before commencing. Of the 28 total participants, 7 were Atlas5D employees, and 21 were Biogen employees. Of the 21 Biogen employees, 15 responded to the mass e-mail, and 6 happened to pass by the conference room where data-collection was taking place and expressed interest in participating. This study was conducted next to, but in isolation from, a separate and independent data-gathering experiment by Atlas5D on the other side of the same conference room. Total participation time per participant was about 20 min, including about 10 min of walking time. Participants were not reimbursed.
Participants were given a background hand-out about the study containing a description of the technology involved and the tests being performed. Each participant was given time to review the hand-out and discuss the study with the administrators. Then, each participant was brought to the testing area and presented with the routes to walk.
Participants came “as they were” and did not wear any particular devices, clothing or shoes during the study. Participants were instructed to walk normally, and at a normal pace, along each pre-defined route.
3.3. Data collection and analysis
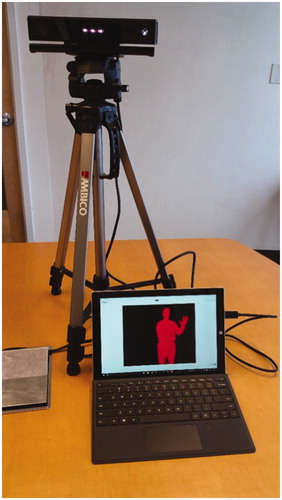
Custom software was developed by Atlas5D to collect and analyse the walking speed for each traversal. This software included a programme running on each AMS to collect data, and a separate cloud-based processing and visualisation platform running on Amazon Web Services (AWS) (Amazon, Seattle, WA) to present the results. The hardware for each AMS comprised a Microsoft Surface tablet computer connected to a Microsoft Kinect (Version 2) spatial sensor (Microsoft, Seattle, WA). In contrast to many other touchless sensors, the class of AMS used in this study was specially designed to be compact enough to be placed on a shelf; affordably assembled from commoditised components; and capable of operating autonomously for very long periods of time (months to years) in a patient’s home. illustrates a disassembled AMS, showing its key components.
Figure 4. Photo of AMS components.
The custom software running on each AMS was designed to identify the spatial location of a participant at a rate of 10 frames per second. These location data were transmitted to databases on the cloud servers for storage. For each AMS traversal (consisting of a single walk along a route by a participant), the cloud platform used the stored location data to calculate and plot the instantaneous speed of the participant. The cloud platform also calculated the total distance travelled and the total time of traversal, then divided the total distance travelled by the total time of traversal to calculate a single overall walking speed for the traversal. The AMS calculations were recorded then compared to each other and to corresponding manual measurements from the human timers.
The simultaneous walking-speed data from the three human timers and the two AMSs were analysed using generalised estimating equations (GEE) to adjust for repeated measures on the participants. The outcome was walking speed. The independent variables were traversal number (first or second), route (line, “X”, or circle), and device type (AMS 1, AMS 2 or human timer). A linear link function with Gaussian error was used to fit the GEE models and an exchangeable correlation matrix was assumed to estimate and adjust for the correlation of observations within participants. Because of the small number of participants, model-based standard errors were used. Bland–Altman plots were constructed to assess the level of agreement among the AMSs and the manual walking-speed calculations [Citation15].
The work performed for this study was approved by New England IRB (Needham, MA). All participants provided voluntary written consent to participate in this study.
4. Results
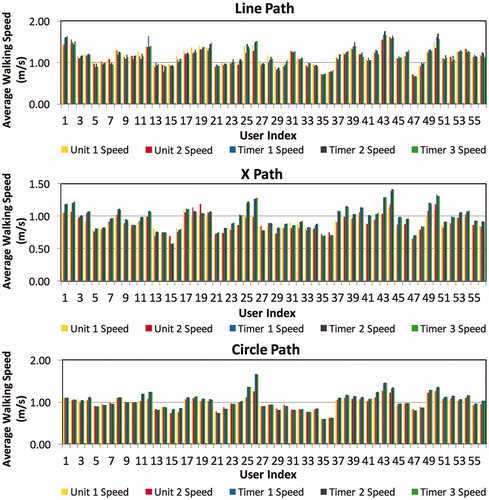
Twenty-eight (twelve female) healthy volunteers walked three predefined routes two times each for a total of 168 walking-speed observations. shows the measured walking speeds for all 168 traversals, subdivided by route.
Figure 5. Average walking speeds for all traversals (n = 168). (a) Line-route (n = 56). (b) X-route (n = 56). (c) Circle-route (n = 56).
4.1. Mean walking speeds
shows descriptive statistics of the aggregated and route-specific walking speeds (m/s) from each of the AMSs and each of the three human timers (manual raters). Across all 168 traversals – aggregating the Line, X and circle routes – the mean walking speeds measured by the two AMSs differedFootnote1 by 0.6 cm/s (<1%) (p = .596). Across the subset of 56 Line-route traversals, the mean walking speeds measured by the two AMSs differed by approximately 3.7 cm/s (approximately 3%) (p = .001). Across the subset of 56 X-route traversals, the mean walking speeds measured by the two AMSs differed by approximately 1.4 cm/s (approximately 2%) (p = .085). Across the subset of 56 circle-route traversals, the mean walking speeds measured by the two AMSs differed by 0.6 cm/s (< 1%) (p = .386).
Table 1. Descriptive statistics of speed assessments.
Across all 168 traversals, the mean walking speeds measured in aggregate by the two AMSs, as compared with the mean walking speeds measured – each in aggregate – by the three human timers, differed by approximately 8.5 cm/s (approximately 8%) (all p < .001). Across the subset of 56 Line-route traversals, the AMS-vs.-human difference was approximately 1.8 cm/s (approximately 2%) (p = .0003–.661). Across the subset of 56 X-route traversals, the AMS-human difference was approximately 14 cm/s (approximately 16%) (all p < .001). Across the subset of 56 circle-route traversals, the AMS-human difference was approximately 9.7 cm/s (approximately 10%) (all p < .001).
4.2. Correlated walking speeds
shows Pearson’s product-moment correlation coefficients between pairs of speed assessments. shows the regression models calculated by GEE.
Table 2. Pearson’s product-moment correlation coefficients between pairs of speed assessments.
Table 3. GEE regression models.
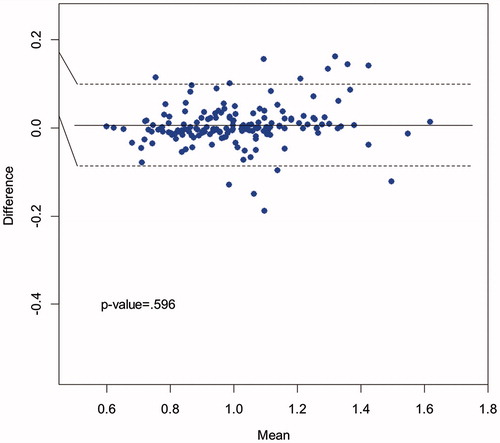
shows a Bland–Altman plot comparing the walking speeds measured by AMS 1 and AMS 2 across all 168 traversals, and highlighting that there was no significant difference in mean walking speeds between the two AMSs (solid horizontal line); the majority of points fell within 95% confidence limits (dashed lines). The mean estimated walking speeds were 1.010 m/s (SD = 0.194) for AMS 1 and 1.004 m/s (SD = 0.187) for AMS 2 (p = .596). The Pearson’s correlation coefficient between the two AMSs was r = .97 (p < .0001).
Figure 6. Bland–Altman plot of AMS1 vs. AMS2, across all traversals (n = 168).
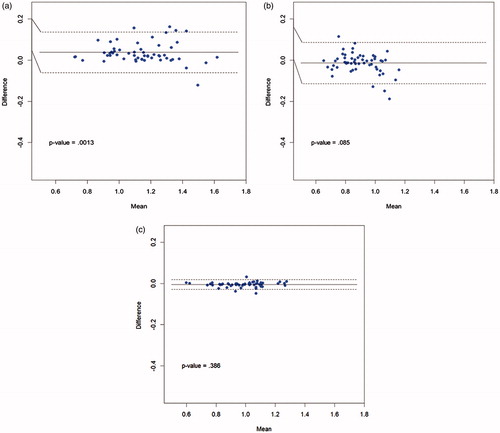
shows Bland–Altman plots comparing the walking speeds measured by AMS 1 and AMS 2 for each of the three routes separately (56 traversals per route). The Pearson’s correlation coefficients between the two AMSs were r = .97 (p < .0001), r = .93 (p < .0001) and r > .99 (p < .0001), for Line-route, X-route and circle-route, respectively. For the Line-route, AMS 1 measured a statistically significant faster walking speed compared with AMS 2 (AMS 1 speed = 1.161, SD = 0.199; AMS 2 speed = 1.124, SD = 0.201) (p = .0013), corresponding to a magnitude difference of approximately 3%. There was no significant difference in mean walking speeds between the two AMSs for the X-route or the circle-route.
Figure 7. Bland–Altman plots of AMS1 vs. AMS2. (a) Line-route (n = 56). (b) X-route (n = 56). (c) Circle-route (n = 56).
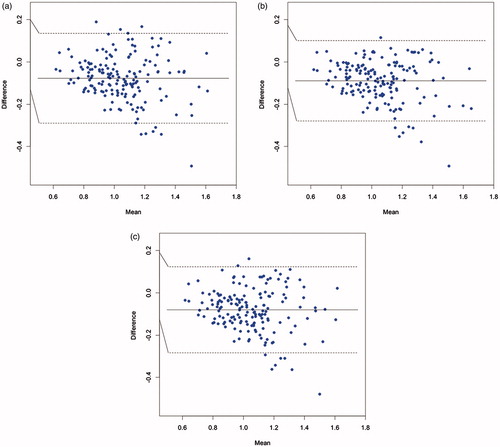
shows Bland–Altman plots comparing the walking speeds measured by AMS 1 and each of the three human timers across all 168 traversals. In each case, the measured walking speeds from the manual timers were higher than the walking speed measured by AMS 1, as illustrated by the solid horizontal line representing the mean differences in each of the plots (difference = AMS 1 speed minus manual timer speed; p < .0001 for all three comparisons). The variability of the differences between AMS 1 and the three manual timers was higher than the variability of the differences between AMS 1 and AMS 2, which can be seen by the greater vertical spread of the points and the wider 95% confidence intervals. The Pearson’s correlation coefficients between AMS 1 and the three human timers were r = .87 (p < .0001), r = .90 (p < .0001) and r = .87 (p < .0001), respectively. The comparisons of AMS 2 with the three human timers, not shown here, produced results similar to .
Figure 8. Bland-Altman plots of AMS1 vs. human timers, across all traversals (n = 168). (a) AMS1 vs. Timer 1. (b) AMS1 vs. Timer 2. (c) AMS1 vs. Timer 3.
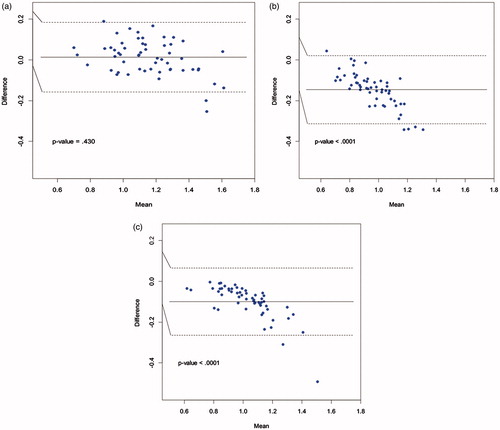
shows Bland–Altman plots comparing AMS 1 with human timer 1 for each of the three routes separately (56 traversals per route). displays two interesting findings. First, the mean walking speeds for the X-route and the circle-route were statistically significantly faster for Timer 1 compared to AMS 1. Second, patterns emerged for the X-route and circle-route plots, showing a negative slope between difference in speed and mean speed: the difference between AMS 1 and Timer 1 was greatest and most negative for the higher mean speeds. Put another way, as a participant’s walking speed increased, manual calculation reported a disproportionately larger increase in speed. Similar results, not shown here, were observed between AMS 1 and Timer 2 and Timer 3, and between AMS 2 and Timer 1, Timer 2 and Timer 3.
Figure 9: Bland–Altman plots of AMS1 vs. Timer 1. (a) Line-route (n = 56). (b) X-route (n = 56). (c) Circle-route (n = 56).
5. Discussion
The two independent AMS units supplied very similar measurements of walking speed. Across all 168 traversals, and across the X-route and circle-route (56 traversals each), the AMS measurements were virtually indistinguishable from each other, with no statistical difference and an absolute-magnitude difference of under 2 cm/s. Across the Line-route (56 tests), the AMS measurements exhibited a statistical difference (p = .001), but the absolute-magnitude difference was under 4 cm/s. The Pearson’s correlation coefficients between AMS 1 and AMS 2 were very high in all comparisons, ranging from .93 to >.99.
We surmise that the small but statistically significant difference between the two AMS units for the Line-route stemmed from split-second differences in the time when each AMS determined the entrance or exit of a participant within its respective field-of-view. Recall that the data-acquisition area was restricted to an overlap of the two AMS fields-of-view, which meant that each AMS unit might “see” the same participant come inside, or move outside, the shared acquisition area at a slightly different time. Because of the strong Pearson’s correlation coefficients between the AMSs, at the units’ acquisition rate of 10 data-frames/s, a gain or loss of even a handful of data-frames when the participant entered or exited the AMS field-of-view would be likely to result in a statistically significant p value. Similarly, we surmise that because participants traversing the circle-route were restricted at all times to the shared acquisition area – and therefore less likely to enter or exit the field-of-view of either AMS – both AMS units collected almost exactly the same number of data-frames and therefore supplied almost indistinguishable measurements.
Taken together, these study results demonstrated high concurrent reliability between the two AMS units across the 168 walking traversals and the 3 routes.
The two independent AMS units acquired statistically significant different measurements of walking speed compared to the three human timers with stopwatches. In aggregate, the differences in measured walking speed varied from about 2 cm/s (1.6% relative difference, Line-route) to about 10 cm/s (9.9% relative difference, circle-route) to about 14 cm/s (16% relative difference, X-Route), with the human timers measuring a higher walking speed compared to the AMSs. As described above, we also found that the human timers reported disproportionately higher measurements (i.e. larger variation between human and AMS) when walking speed increased. Similar differences in human vs. automated measurements have been reported in analogous studies. For example, Youdas et al. reported that humans with stopwatches measured statistically significant differences in walking speeds ranging from 10% to 65% higher than a GAITRite sensor mat [Citation16]; Peters at al. reported that humans with stopwatches measured statistically significant differences in walking speed averaging 16 cm/s lower than a GAITRite sensor mat [Citation17]; and Karpman et al. reported that the variation between human and automated measurements of walking speed increased with faster speeds [Citation18].
We surmise that the differences we observed in human-vs.-automatic measurements in walking speed arise from similar causes as those identified in such analogous studies. As Youdas et al. concluded, the “principle factor” is probably stopwatch latency: “Timing the start and completion of the walking distance is dependent on the examiner’s visual observation of a subject penetrating an imaginary vertical plane” [Citation16]. We also observed that test participants varied in how they aligned their feet against the taped floor markings, with some participants preferring the inner aspect, some the centre, and some the outer aspect; as a result, there were likely small deviations of some route traversals from the “official” rolling-wheel measurements, which were aligned against the centre of the floor markings and used as the divisor in walking-speed calculations by the human timers.
Taken together, these study results demonstrated high concurrent validity, comparable to reports from analogous studies, when comparing our AMS with the most commonly used real-world method of walking speed acquisition (a manual stopwatch and floor markings) across the 168 walking traversals and the 3 routes.
Some previous reports estimate that a change in walking speed of approximately 5–10 cm/s is clinically significant when measured by either an instrumented walkway or by a manual stopwatch [Citation17,Citation16], while other reports recommend that the gauge of clinical significance should be 10-fold higher at 100 cm/s [Citation18]. The differences of our AMS units relative to both each other and to the human timers fell comfortably within the former range, and well below the latter range.
This study of our AMS is one of a series of research studies intended to accurately quantify long-term and gradual changes in mobility without imposing physical or cognitive requirements on individuals. This proof-of-concept study validated our AMS, in a controlled setting in preparation for future placement of AMSs in patient homes. Individuals measured by our AMS do not need to wear, recharge or remember any special clothing or devices. Movement data are automatically collected in real-time whenever a user is in front of the sensor, which means that users can effortlessly provide accurate movement data without adhering to a particular testing or data-collecting regimen. The stationary setup of the sensor allows for a controlled, consistent and contextualised data-collection environment with improved signal-to-noise compared to wearables. In other words, placing the AMS in a fixed location removes the noise and uncertainty that arise when a person moves among different environments; maintaining this single context improves signal-to-noise compared to wearables.
An important advantage of our AMS compared to many other methods is the ability to continuously measure walking speed regardless of the shape of the walking route. The AMS is designed to operate continuously for durations ranging from days to years, so that subtle changes in mobility normative to self may therefore become discoverable and quantifiable across both acute and chronic timeframes.
In medical conditions where mobility is impaired and biomarkers are elusive, our AMS may provide a missing piece. The AMS can be applied to diseases that affect brain, spinal cord, muscles, cognition and mood. For example, the majority of individuals with multiple sclerosis report symptoms affecting mobility [Citation19], and around half of this population reports at least one relapse annually [Citation19]; but there are no at-home tests to detect disease progression or to confirm relapses in multiple sclerosis. MRI scans can be used to detect underlying disease activity, but brain lesions cannot necessarily be directly linked to physical symptoms [Citation20]. For multiple sclerosis, an AMS in the home could provide early-warning signs of relapse, monitor recovery, measure effectiveness of treatment, and add to the understanding of disease progression and stratification. Other conditions that could benefit from an AMS include, for example, Alzheimer’s disease, amyotrophic lateral sclerosis (ALS), Parkinson’s disease, depression and aging-in-place.
An important advantage of this AMS system is that it safeguards privacy. Because its data-collection metrics are derived from infrared light, the AMS does not need to acquire any photos or videos. The infrared light used to collect movement data can be restricted within a pre-determined range, and cannot pass through walls, both of which safeguard against unintended measurements of non-users and neighbours. Movement data such as walking speed are not classified as Personal Health Information under the Health Insurance Portability and Accountability Act (HIPAA). Our AMS acquires and transmits data in real-time via a secure, encrypted internet connection.
The AMS device and this research study both have limitations. The Microsoft Kinect (Version 2) that is deployed in our sensor has an approximate maximum range of 5 m to detect individuals; in general, the ranges of commercial depth sensors vary from approximately 1–10 m. We found that the range of the Kinect was sufficient to measure accurate walking speeds, but further study will be needed to clarify the minimal field-of-view that is needed to gain meaningful information.
In testing the AMS with predefined walking routes, our field-of-view was uncluttered, without furniture or other obstacles to movement; we expect that walking patterns and speeds will vary by household set-up and within household locations, e.g. hallway vs. corner, kitchen vs. living room, cluttered vs. uncluttered. Another limitation is that some individuals may become habituated to the particular layout of their own homes, so that metrics within the home might not necessarily reflect performance outside the home. Even in such cases, however, we expect that longitudinal changes in movement normative to self will be apparent: in other words, although a person’s average walking speed may vary from room to room, each specific room will evince a recognisable delta in walking speed relative to its own baseline.
In this study, each AMS measured a single person at a time. Currently, the AMS does not account for multiple persons traversing the field-of-view.
Finally, this study compared our AMS only to human timers, and not to a different automated system such as the GAITRite mat; we plan to perform expanded comparisons in a future study. Further research is needed to understand the accuracy and adoption of placing a mobility AMS into real-world homes, and to better elucidate the opportunities afforded by long-term, high-resolution mobility data.
6. Conclusions
The tested AMS demonstrated the ability to measure walking speed in a controlled setting with no significant difference from manual calculations similar to those currently employed in clinics. Our AMS may overcome two major problems associated with wearable devices: signal-to-noise and adherence. Use of the AMS outside the clinic may aid in detecting subtle changes in walking speed over time. Walking speed has been shown to be a predictive metric of morbidity and mortality [Citation4,Citation5], but because changes in walking speed occur gradually over time, they may remain undetected by the individual and by providers until other symptomatic changes appear. The ability to detect subtle changes in walking speed over time, before symptomatic changes become apparent, could be a useful tool in monitoring disease activity, fragility in older adults and health status outside of clinical settings.
Acknowledgements
The authors would like to thank Richard Rudick, MD at Biogen; Mark Frisse, MD at Vanderbilt; and Eric Klawiter, MD, and Victoria Smith, BS, at Massachusetts General Hospital, for their input during this study and the preparation of this manuscript; and Tyson Smith for illustrations. This study was supported by Biogen. Biogen reviewed and provided feedback on the paper to the authors; the authors had full editorial control of the paper and provided their final approval of all content.
Disclosure statement
JV and ZK are employees of Atlas5D and company stockholders. WG, CM, and GP are employees of Biogen and company stockholders.
Notes
1 Let a horizontal bar denote “mean”, so that = mean of AMS1 speeds,
= mean of Timer1 speeds, and so on. Let abs denote absolute value; min denote the minimum of a set of numbers and max denote the maximum of a set of numbers.For AMS1 vs. AMS2, we define:mean difference of means:
maximum relative difference among all means:
For All AMS vs. All Timers, we define:mean difference of means:
References
- Goldman MD, Motl RW, Scagnelli J, et al. Clinically meaningful performance benchmarks in MS: Timed 25-Foot Walk and the real world. Neurology. 2013;81:1856–1863.
- Brusse KJ, Zindars S, Zalewski KR, et al. Testing functional performance in people with Parkinson disease. Phys Ther. 2005;85:134–141.
- del Campo N, Payoux P, Djilali A, et al. Relationship of regional brain β-amyloid to gait speed. Neurology. 2016;86:36–43.
- Artaud F, Singh-Manoux A, Dugravot A, et al. Decline in fast gait speed as a predictor of disability in older adults. J Am Geriatr Soc. 2015;63:1129–1136.
- Hardy SE, Perera S, Roumani YF, et al. Improvement in usual gait speed predicts better survival in older adults. J Am Geriatr Soc. 2007;55:1727–1734.
- Middleton A, Fritz S, Lusardi M. Walking speed: the functional vital sign. J Aging Phys Act. 2015;23:314–322.
- Rudick RA, Antel J, Confavereux C, et al. Recommendations from the national multiple sclerosis society clinical outcomes assessment task force. Ann Neurol. 1997;42:379–382.
- Dodge HH, Mattek NC, Austin D, et al. In-home walking speeds and variability trajectories associated with mild cognitive impairment. Neurology. 2012;78:1946–1952.
- Chiauzzi E, Rodarte C, DasMahapatra P. Patient-centered activity monitoring in the self-management of chronic health conditions. BMC Med. 2015;13:77.
- Gaglani S, Moore J, Haynes MR, et al. Using commercial activity monitors to measure gait in patients with suspected iNPH: implications for ambulatory monitoring. Cureus. 2015;7:e382.
- Samson K. Wearing the detectives. Neurol Now. 2015;11:34–36.
- Plante TB, Urrea B, MacFarlane ZT, et al. Validation of the instant blood pressure smartphone App (Research Letter); Published online Mar 2, 2016.
- Cuddihy P, Yardibi T, Legenzoff Z, et al. Radar walking speed measurements of seniors in their apartments: technology for fall prevention. In 34th Annual International Conference of the IEEE EMBS; 28 Aug–1 Sept 2012; San Diego (CA): IEEE; 2012.
- Stone E, Skubic M. Passive in-home measurement of stride-to-stride gait variability comparing vision and kinect sensing. In 33rd Annual International Conference of the IEEE EMBS; Aug 30–Sept 3, 2011; Boston (MA): IEEE; 2011.
- Bland JM, Altman D. Statistical methods for assessing agreement between two methods of clinical measurement. Lancet. 1986;327:307–310.
- Youdas J, Childs K, McNeil M, et al. Responsiveness of 2 procedures for measurement of temporal and spatial gait parameters in older adults. PM&R. 2010;2:537–543.
- Peters D, Middleton A, Donley J, et al. Concurrent validity of walking speed values calculated via the GAITRite electronic walkway and 3 meter walk test in the chronic stroke population. Physiother Theory Pract. 2014;30:183–188.
- Karpman C, LeBrasseur N, DePew Z, et al. Measuring gait speed in the out-patient clinic: methodology and feasibility. Respir Care. 2014;59:531–537.
- Health Union, LLC. 2014 MS in America Study [Internet]. 2014 [cited 2016 Jan 15]. Available from: https://multiplesclerosis.net/ms-in-america-2014/life-with-ms/3/.
- Chen I. more than meets the eye: the promises and pitfalls of MRI imaging in multiple sclerosis [Internet]. 2012 [cited 2016 Jan 15]. Available from: http://www.msdiscovery.org/news/news_synthesis/322-more-meets-eye.