
Abstract
Ambient measurement systems (AMSs) can enable continuous assessment of functional performance at home, increasing the availability of data for monitoring of neuromuscular disease. An AMS passively measures movement whenever someone is in range of the sensor, without the need for any wearable sensors. The current study evaluates the performance of an AMS for three metrics associated with functional assessments in Duchenne muscular dystrophy (DMD): ambulation speed, rise-to-stand speed and arm-raise speed. Healthy paediatric subjects performed a series of functional tasks and were graded by both a human rater and an AMS. Linear mixed-effect models were fit to calculate agreement between the two measurement methods. For all activities, the AMS and human rater supplied similar measurements of average speed, with correlation coefficients of 0.76–0.92 and systematic differences ranging in magnitude from 0 to 0.48 m per second. The largest systematic difference was for the 10-m run, which was likely due to human rater reaction time. Systematic differences in arm-raise measurements were due to incomplete execution of movements by test participants. These results are consistent with previous studies comparing automated and manual measurements of movement. This study demonstrates that an AMS device is able to measure ambulation speed, rise-to-stand speed and arm-raise speed in a paediatric population in a controlled setting without the need for complicated installation, calibration or worn sensors.
1. Introduction
Metrics of physical activity are important clinical hallmarks in a variety of paediatric conditions, including neurological and neuromuscular diseases. For example, Duchenne muscular dystrophy (DMD) is characterised by progressive muscle degeneration and weakness first evident in early childhood leading to loss of ambulation by mid-adolescence and loss of upper limb function needed for self-care by young adulthood [Citation1].
Paediatric physical function is often assessed in investigational and clinical settings using human-operated activity tests. Paediatric ambulatory tests include the 6-min walk test (6MWT) [Citation2], 10-metre walk/run (10MWR) [Citation3] and North Star Ambulatory Assessment (NSAA) [Citation4]. Paediatric upper limb tests include the Brooke Scale [Citation5] and Performance of the Upper Limb (PUL) [Citation6]. All of these tests provide useful information to gauge disease progression, but require the patient to travel to a clinic and are limited by availability of trained staff, space and testing equipment as well as constraints around duration and frequency of patient visits. Furthermore, individual patient attributes such as mood, cooperation, motivation, cognitive ability and coaching/learning effects may confound results [Citation7,Citation8]. Due to these factors, in-clinic assessments may not reflect real-world function.
Automated measurements of paediatric physical function could be beneficial both in the clinic by easing resource and labour requirements, and in the patient’s own home by tracking real-world physical ability and its change over time. The present study is one of a series of research studies aimed at producing objective metrics of disease status in real-world settings using a novel automatic touchless sensor system, called an ambient measurement system (AMS). AMSs require no wearable sensors, but passively measure the 3D shape of a person whenever they present in front of the sensor. In this manner, it is possible to gather repeated assessments of function at home without requiring active involvement by the subject. The AMS used in this study was previously validated in adult populations, including healthy subjects and multiple sclerosis (MS) patients, in both clinic and home settings [Citation9–11]. This study presents the first validation results for a paediatric population.
The objective of the present study was to validate the AMS measurement of three controlled activities performed by a population of healthy children: speed of ambulation, speed to rise to a standing position and speed to raise and lower an arm. These activities were selected because of their known clinical relevance to childhood mobility disorders such as DMD, as described further below. For each activity, an AMS automated measurement of a functional test was compared to its human-rated analogue.
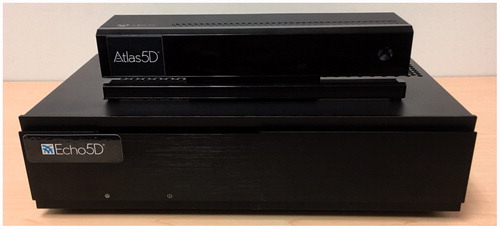
The AMS utilised in this study is made by Atlas5D (Cambridge, MA). This system, named Echo5D®, passively locates people in the field of view, measures their movements, and interprets those movements. An image of an Echo5D AMS is shown in . The device’s sampling rate is 10–30 measurements per second and it operates autonomously for indefinite periods of time. Users do not need to wear, remember or recharge any devices.
Figure 1. Image of an Echo5D device. The lower box is the computing hardware, and the upper box is the 3D sensor.
The first parameter assessed, ambulation speed, is utilised as a clinical metric in many health conditions [Citation12]. Time to walk or run 10 m is a standard measurement in DMD [Citation3] but is not applicable in an at-home setting because patients may not walk 10 m at a time or have a long straight path to walk. However, the average speed of walking/running is a functional assessment that is attainable in the home and correlates with clinical measures of mobility [Citation10]. As a result, we chose a 10MWR for an ambulation assessment, with the average speed of each walk/run as the parameter of interest.
The time taken to rise to a standing position is another important metric for DMD [Citation3]. Time to rise from supine is one of the items in the NSAA and is used as a marker of disease progression and a predictor of loss of ambulation [Citation13]. In the present study, we measured rise to stand from three different starting positions that are relevant for an at-home naturalistic setting: supine, seated on the floor and seated on a box. As both distances and sequences of muscle activations differ among starting positions, we compared speed of movement (rather than time of movement) across sets of activities, in order to maintain a standardised comparison.
Tests of upper limb function provide additional tools for following the progression of DMD that can be used for patients in later stages of the disease. The Brooke Scale is a standard assessment for patients with DMD [Citation14] in which patients are graded on how high they can raise their arms. However, in a home setting, the starting position and end position of any type of arm-raise event may vary depending on the task being performed. New, technologically enabled approaches have been introduced that show promise for detailed assessment of upper extremity function [Citation14–17]. Prior work using actimetry to assess upper extremity function in DMD has identified arm-raise speed as a reliable metric that is well-correlated with other upper extremity tasks [Citation18,Citation19]. Therefore, we selected the rate at which individuals can raise and lower their arms as a robust functional measurement that can be used in the home.
2. Materials and methods
2.1. Assessment parameters and testing conditions
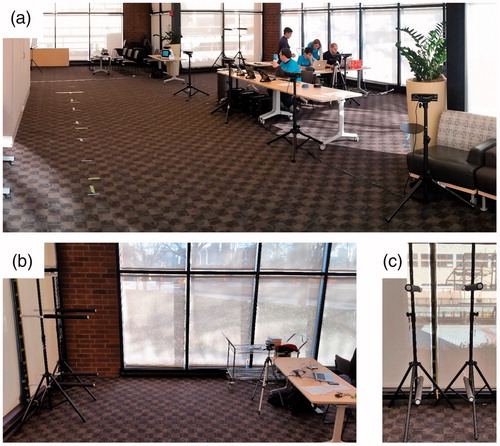
The Echo5D system is capable of reporting ambulation speed, rise-to-stand speed and arm-raise speed simultaneously. For each activity – ambulation, rise-to-stand and arm-raise – we compared one AMS sensor (or array of AMS sensors, as described below) versus one simultaneous human rater. The acquisition area was a large conference room at the Atlas5D offices, which was partitioned into three activity stations that are shown in .
Figure 2. Images of test setup. (a) Entire room showing 10-metre walk/run course in foreground and arm-raise and rise-to-stand stations in background. (b) Arm-raise station, showing littorals on the left and data collection setup on the right. (c) Detail of physical markers for arm raise and lower.
2.2. Participants and raters
Participants were healthy children without neurological or muscular disorder, recruited by email or by personal invitation to parents identified through friends and family. The study protocol was approved by New England IRB, approval number 120160946, and all parents signed an informed consent before their child engaged in any study activities. Eighteen children (13 boys, five girls) age 5–12 years (mean: 7.9, median: 8, SD: 2.1) participated. Data collection took place on a single day. Participants arrived on a staggered schedule and conducted each activity in random order, first-in-first-out to each activity station.
The human raters were all employees of Atlas5D. All human raters took part in a training session in which they were instructed on proper methods for clinical assessments by a paediatric neurologist specialising in neuromuscular diseases who has extensive expertise in performing assessments on patients with DMD.
2.3. AMS
Each Echo5D AMS device used in this study consisted of a Microsoft Kinect (Version 2) spatial sensor [Citation20–22] (Microsoft, Seattle, WA) connected to a computer running custom software (Atlas5D, Cambridge, MA), as previously described [Citation9–11]. One Echo5D device was used in each of the rise-to-stand and arm-raise data acquisitions, and five Echo5D devices were used in the ambulation data acquisitions.
Each Echo5D collected data at 10–30 frames per second. Each frame contained a set of 3D points mapping the physical shape of the respective participant from which centre of mass, centre of head and centre of wrist were calculated. Data were stored on Atlas5D cloud servers hosted by Amazon Web Services (Amazon, Seattle, WA) and analysed either on those cloud servers or on Atlas5D local workstations. Each data acquisition was accompanied by a summary of timing data to inform the operator about the status of the acquisition; if the Echo5D operator determined that the test was not performed successfully, the operator could repeat the test. The criteria to repeat a test included: another person walking into the data acquisition area, a sensor failing to start recording due to temporary network outage, and for the 10MWR, more than two sensors failing to pick up the subject leading to gaps in the collected data. If the operator failed to notice any of the failure criteria and did not repeat the run to ensure a clean measurement, the run was excluded from our analysis, as described later.
For manual measurements, each human observer used a computer timer, equivalent to a stopwatch, to time each traversal. The computer timer was a software program running on an Atlas5D computer and synchronised to all the AMS devices, so that each frame of data from each AMS was time-stamped and could be compared against a human-triggered stopwatch event.
2.4. Activities
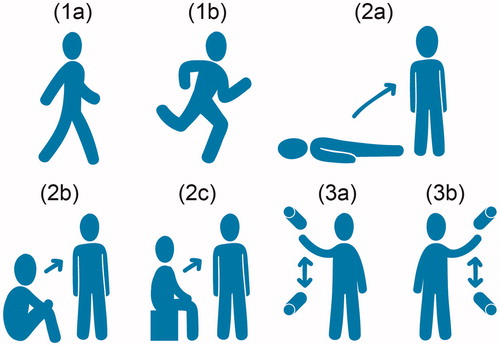
Each participant performed three activities: ambulation, rise to stand, and raising and lowering arms. Illustrations of these activities are shown in .
Figure 3. Activities. (1a) 10-metre walk, (1b) 10-metre run, (2a) rise from supine, (2b) rise from seated on floor, (2c) rise from seated on box and (3) raising and lowering right (3a) and left (3b) arms between physical markers.
2.4.1. Ambulation
Participants performed five repetitions of comfortably walking along a 10-m straight obstacle-free track, followed by five repetitions of running at maximum speed along the same track. The five walks always preceded the five runs. Participants were allowed to rest between any repetitions as desired.
The data acquisition area was a 15-m by 3-m rectangle, free of obstacles. The 10-m path was marked on the floor with tape, with each metre marked with additional tape, to enable post hoc analysis of video data. An additional metre was prefixed to the front of the path, to ensure that patients were in the acquisition area before the start of the test. Four additional metres were appended to the end of the path, so that participants could safely slow to a stop after completing each walk or run.
The human observer started the stopwatch when the participant passed the tape mark indicating the start of the 10-m path and stopped the stopwatch when the participant passed the tape mark indicating the end of the 10-m path. The average speed calculated by the human observer equalled 10 m divided by the stopwatch time.
Five AMS devices were placed side-by-side along the 10-m path. Each AMS has a range of 5 m (shorter than the track distance), so the AMS array served to overlap fields-of-view and thereby cover the entire path. Each AMS recorded the position of the participant (at 30 frames per second) within its field of view between the human rater’s start and stop. The distances and times from frame to frame from all five AMS devices were added to obtain a total distance and total time, from which average speed was calculated. The measurements that were acquired when the participant was measured by more than one sensor at the same time were stitched together as described previously [Citation11]. The total distance measured by each AMS was not necessarily equal to 10 m due to variations in the time taken for each AMS to detect the presence of the participant and in the timing of the human observer pressing the start and stop buttons.
2.4.2. Rise to stand
Participants performed three repetitions rising from each of three starting positions (supine, seated on floor, seated on box) to a “standing soldier” position (feet together with arms at sides), as quickly as possible, for a total of nine rise-to-stand repetitions. Each rise to stand was measured simultaneously by a single human observer and a single AMS. The last of the three starting positions used a small box to supply a child-sized seating height; the same box was used for all participants.
Each participant’s leg height was manually measured a single time in advance using a ruler extended from the greater trochanter of the right femur straight down to the floor. For each repetition, the human rater began a stopwatch upon seeing the participant began to move and stopped the stopwatch upon seeing the participant complete the movement (defined as having both feet together and both hands down at the participant’s sides). The human rater’s average rise speed for each repetition was the height of the trochanter divided by the elapsed stopwatch duration.
The AMS calculated the 3D location of the participant’s centre of mass continuously during data recording. The centre of mass was defined as the volumetric mean of the region that was automatically determined to belong to the test participant. The centre of mass was used for these studies, as opposed to a specific landmark, to allow for continuous tracking during movement, independent of orientation. The AMS’s average rise speed for each repetition was calculated by dividing the summed pairwise vertical component of the distance traversed by the centre of mass from each frame, by the summed pairwise elapsed time between each frame, across all frames of data that were acquired between the human rater’s start and stop.
2.4.3. Raising and lowering arms
Participants performed three sets of 10 repetitions raising and lowering each arm separately between the lowest and highest comfortable extents. Only one arm was moved at a time, so each participant performed a separate total of 30 repetitions for the right arm and 30 repetitions for the left arm. To remove artefacts that might be caused by “warm up” and “warm down”, the first and last repetitions of each set were discarded, leaving eight repetitions per set that were analysed. Each arm raise was measured simultaneously by a single human observer and a single AMS.
To acquire manual measurements of distance, four gym bars were used as physical littorals. Before each participant began performing sets of arm raises, two littorals were fixed at the level of the wrists at the lowest extended arm position, and the other two at the level of the wrists at the highest extended arm position. The vertical distances between the right-side littorals and between the left-side littorals were manually recorded with a ruler. An image of the littorals is shown in .
The human observer started the stopwatch as soon as a participant touched the lower littoral after the first repetition was completed and stopped the stopwatch as soon as a participant touched the lower littoral after the ninth repetition was completed. The total distance for a set was calculated as the distance between the lower littoral and upper littoral multiplied by 16 (for eight ascents and eight descents). The average speed was that total distance divided by the elapsed time.
The AMS measured the location of the centre-of-wrist for each arm continuously during data recording. The AMS ignored the physical littorals. The AMS’s average speed for each repetition was calculated by dividing the summed pairwise vertical component of the distance traversed by the centre-of-wrist for each frame of data by the summed pairwise elapsed time between each frame, across all frames of data that were acquired between the human rater’s start and stop.
2.5. Statistical calculations
To examine the relationship between human rater and AMS measurements across multiple repetitions per participant, we used the method of linear mixed-effect models [Citation23]. Separate analyses were conducted for each activity with speed of completion as the outcome. Each model incorporated modality (i.e., human or AMS) as a fixed effect to measure any systematic difference between human and AMS measurements. Each model incorporated two random effects: one for participants (i.e., capturing variability among participants due to individual idiosyncrasies of size and shape) and one for repetitions (i.e., capturing variability among repetitions due to idiosyncrasies of leg and arm movements). These random effects encompass subject- and repetition-level differences that impact both human and AMS measurements. Thus, after accounting for these shared effects which are due to the study design, it is possible to isolate the correlation between the measurement approaches.
Correlation between human and AMS measurements were calculated by based on the intra-class correlations derived from the mixed models [Citation24]. In particular, each linear mixed-effect model, once fit, generated a set of variance components. The intra-class correlation was calculated by dividing the sum of the variances of both random effects by the total variance. The intra-class correlation thus represents the proportion of the total variance that is explained by similarity between human and AMS measurements. Confidence intervals (at 95%) for the intra-class correlations were calculated by bootstrapping to 1000 iterations.
3. Results
A total of 175 test runs were measured for 10MWR, 121 for rise to stand and 77 for raising/lowering arms. Not all participants completed all planned tests due to non-compliance (waning interest or becoming tired). Of the 373 measured test runs, 92 were excluded from analysis for one or more of the following reasons: activity not completed, activity not performed as instructed, activity lacking manual measurements, activity invalid because the AMS tracked a person other than the participant, data invalid due to undetected network interruption during data collection. The data from all analysed tests and a listing of all excluded tests are available upon request.
Correlation coefficients and systematic differences between human rater and AMS measurements obtained from the mixed effect models for the 281 analysed test runs are shown in . Across all activities, correlation coefficients between human and AMS ranged from 0.76 to 0.92. Systematic differences between human and AMS were largest for the 10-m run (approximately a half-metre-per-second difference), and smallest for rise to stand from supine (no appreciable difference).
Table 1. Statistical results.
4. Discussion
For each activity, the AMS and human rater supplied similar measurements of average speed, with correlation coefficients of 0.76–0.92 and systematic differences of 0–0.48 m/s.
The highest calculated systematic difference was found in the 10-m run, with the human rater reporting lower velocities than the AMS. The magnitude of this systematic difference increased as participant speed increased (), an effect consistent with increasing difficulty experienced by the human rater in marking the entry and exit by the participant at the running path, as previously reported [Citation9,Citation25–27].
Figure 4. The Bland–Altman plots for all activities.
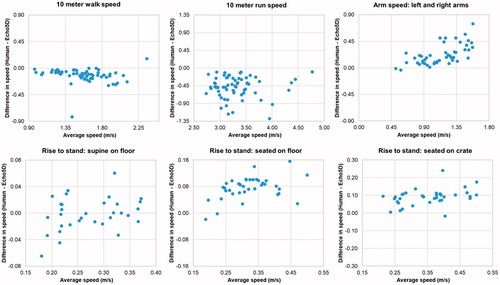
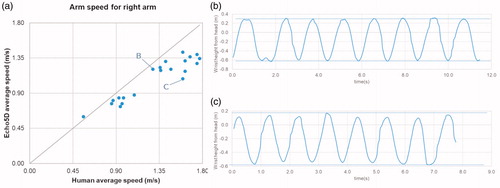
The next-highest systematic difference was found in arm raising/lowering, with the human reporting higher speeds than the AMS. Post-hoc examination of the arm movement data () revealed that some participants failed to fully reach out to all littorals on all repetitions; this shortened extent during arm motion would be expected to escape the notice of the human operator, and therefore bias the human-calculated speed upward.
Figure 5. Detail of results for arm raising/lowering. (a) Correlation plot for average arm raising/lowering speed. (b) Time series plot of wrist height, showing full execution to consistent height for every repetition. (c) Time series plot of wrist height for datapoint labelled “C” in correlation plot, showing incomplete execution to irregular height.
The systematic difference in rise to stand was below 0.1 m per second for each activity, but because the mean speed was slower than for other activities (below 0.5 m/second), the percentage difference was up to 23%. In some cases, post hoc analysis of the data revealed that a participant might anticipate the “start” command and begin moving before the human rater triggered the stopwatch, leading to a slightly higher human-measured speed. This effect was more noticeable in seated starting positions and less noticeable in supine starting positions. The smaller effect observed in supine starting positions is likely due to the longer overall time of the movement from supine, reducing the relative effect size of a timing offset. Additionally, the initiation of a movement from supine is typically a repositioning to prepare to rise from the floor, which does not result in much vertical movement of the centre of mass. As a result, if the subject initiates a rise form supine before the rater gave the start command, there is not much of the vertical movement that would be missed by the AMS, resulting in similar measurements between the rater and the AMS, even with an anticipation of the start command.
Similar differences in human vs. automated measurements have been reported previously in our own work and in analogous studies. Youdas et al. [Citation25] concluded the “principal factor” of these differences is probably stopwatch latency: “Timing the start and completion of the walking distance is dependent on the examiner’s visual observation of a subject penetrating an imaginary vertical plane”. Consistent with this observation, we found that the human and AMS measurements showed higher correlation coefficients when participant movements were slower.
The AMS device and this research study both have limitations. The human raters were reliant on the young participants to comply with instructions, and due to incomplete compliance, some repetitions were either not performed, carried out incompletely or deviated from instructions. This limitation was mitigated through excluding data from analysis that did not meet data quality requirements, but future work can mitigate at time of collection by having participants perform fewer tasks and repetitions. Only one AMS and one human rater were deployed at a time, as inter-rater reliability was not a goal of this study. An inter-rater analysis was previously performed for walking speed in adults [Citation9].
We did not utilise an automated reference standard such as a pressure mat, as the ambulation activity the AMS used in this study has been validated separately against such a reference standard in an adult population [Citation11]. No automated reference standard was used for the arm raising/lowering or rise-to-stand activities because we did not identify any such standards for these activities.
In addition to validating AMS speed measurements, the present study generated a collection of high-resolution (30 frames/second) time series measurements of standardised motions among a paediatric population. Further work is planned to analyse these time-series data to better understand the dynamic phases of the various activities among healthy children.
An AMS offers the important benefit of measuring naturalistic physical activity in uncontrolled settings, such as the home. Uncontrolled settings engender two major complications: first, the presence of multiple people within sensor range; and second, physical movements that are freeform – not subject to operator instructions or other restrictions – and from which relevant measurements must be extracted. To address both of these complications, the authors have developed solutions to uniquely identify a person of interest, and also to filter and summarise desired movements of interest, which are planned as subjects of future manuscripts.
5. Conclusions
The AMS device demonstrated the ability to measure ambulation speed, rise-to-stand speed and arm raising/lowering speed in a controlled setting. Correlations between human and Echo5D-derived assessments of speed ranged from 0.76 to 0.92. Systematic differences between the AMS and human raters ranged in magnitude from 0 to 0.48 m per second and were consistent with previous studies comparing automated and manual measurements of movement. As in prior work, the AMS may overcome two major problems in obtaining real-world data: signal-to-noise and adherence. The ability to detect subtle changes in both upper-limb and lower-limb function over time may be a useful tool to monitor disease activity and quantify treatment response.
Disclosure statement
TC, ZK and JV are employees of Atlas5D and company stockholders. GL, VR and JQ are employees of Solid Biosciences. GS and JS are employees of Analysis Group.
Additional information
Funding
References
- McDonald CM, Henricson EK, Abresch RT, et al. Long-term effects of glucocorticoids on function, quality of life, and survival in patients with Duchenne muscular dystrophy: a prospective cohort study. Lancet. 2018;391:451–461.
- McDonald CM, Henricson EK, Han JJ, et al. The 6-minute walk test as a new outcome measure in Duchenne muscular dystrophy. Muscle Nerve. 2010;41:500–510.
- Beenakker EAC, Maurits NM, Fock JM, et al. Functional ability and muscle force in healthy children and ambulant Duchenne muscular dystrophy patients. Eur J Paediatr Neurol. 2005;9:387–393.
- Mazzone ES, Messina S, Vasco G, et al. Reliability of the North Star Ambulatory Assessment in a multicentric setting. Neuromusc Disord. 2009;19:458–461.
- Brooke MH, Griggs RC, Mendell JR, et al. Clinical trial in Duchenne dystrophy. I. The design of the protocol. Muscle Nerve. 1981;4:186–197.
- Mayhew A, Mazzone ES, Eagle M, et al. Development of the performance of the upper limb module for Duchenne muscular dystrophy. Dev Med Child Neurol. 2013;55:1038–1045.
- Alfano L, Lowes L, Berry K, et al. Role of motivation on performance of the 6-minute walk test in boys with Duchenne muscular dystrophy. Dev Med Child Neurol. 2015;57:57–58.
- Servais L, Grelet M, Seferian A, et al. Movement monitoring at home and during study visits identifies sources of variability in 6MWT performance in Duchenne muscular dystrophy. Neuromusc Disord. 2016;26:S152–S153.
- Varsanik JS, Kimmel ZM, Moor C, et al. Validation of an ambient measurement system (AMS) for walking speed. J Med Eng Technol. 2017;41:362–374.
- Smith VMJ, Varsanik JS, Walker RA, et al. Movement measurements at home for multiple sclerosis: walking speed measured by a novel ambient measurement system. Mult Scler J Exp Transl Clin. 2018;4:2055217317753465.
- Bethoux F, Varsanik JS, Chevalier TW, et al. Walking speed measurement with an Ambient Measurement System (AMS) in patients with multiple sclerosis and walking impairment. Gait Posture. 2018;61:393–397.
- Bohannon RW, Glenney SS. Minimal clinically important difference for change in comfortable gait speed of adults with pathology: a systematic review. J Eval Clin Pract. 2014;20:295–300.
- Mazzone ES, Coratti G, Sormani MP, et al. Timed rise from floor as a predictor of disease progression in Duchenne muscular dystrophy: an observational study. PLoS One. 2016;11:e0151445.
- Connolly AM, Malkus EC, Mendell JR, et al. Outcome reliability in non-ambulatory boys/men with Duchenne muscular dystrophy. Muscle Nerve. 2015;51:522–532.
- Lowes LP, Alfano LN, Yetter BA, et al. Proof of concept of the ability of the Kinect to quantify upper extremity function in dystrophinopathy. PLOS Currents Muscular Dystrophy. 2013. doi:10.1371/currents.md.9ab5d872bbb944c6035c9f9bfd314ee2.
- Han JJ, De Bie E, Nicorici A, et al. Reachable workspace and performance of upper limb (PUL) in Duchenne muscular dystrophy. Muscle Nerve. 2016;53:545–554.
- Han JJ, Kurillo G, Abresch RT, et al. Upper extremity 3-dimensional reachable workspace analysis in dystrophinopathy using Kinect. Muscle Nerve. 2015;52:344–355.
- Le Moing A-G, Seferian AM, Moraux A, et al. A movement monitor based on magneto-inertial sensors for non-ambulant patients with Duchenne muscular dystrophy: a pilot study in controlled environment. PLoS One. 2016;11:e0156696.
- Seferian A, Gargaun E, Grelet M, et al. Longitudinal results of magneto-inertial motion analysis in Duchenne muscular dystrophy ambulant patients. Neuromusc Disord. 2016;26:S184–S185.
- Clark RA, Pua Y-H, Fortin K, et al. Validity of the Microsoft Kinect for assessment of postural control. Gait Posture. 2012;36:372–377.
- Xu X, McGorry RW, Chou L-S, et al. Accuracy of the Microsoft Kinect™ for measuring gait parameters during treadmill walking. Gait Posture. 2015;42:145–151.
- Galna B, Barry G, Jackson D, et al. Accuracy of the Microsoft Kinect sensor for measuring movement in people with Parkinson's disease. Gait Posture. 2014;39:1062–1068.
- Fitzmaurice GM, Laird NM, Ware JH. Applied longitudinal analysis. Vol. 998. Hoboken, NJ: John Wiley & Sons; 2012.
- Nakagawa S, Schielzeth H. Repeatability for Gaussian and non-Gaussian data: a practical guide for biologists. Biol Rev Cambridge Philos Soc. 2010;85:935–956.
- Youdas JW, Childs KB, McNeil ML, et al. Responsiveness of 2 procedures for measurement of temporal and spatial gait parameters in older adults. PM&R. 2010;2:537–543.
- Peters DM, Middleton A, Donley JW, et al. Concurrent validity of walking speed values calculated via the GAITRite electronic walkway and 3 meter walk test in the chronic stroke population. Physiother Theory Pract. 2014;30:183–188.
- Karpman C, LeBrasseur NK, DePew ZS, et al. Measuring gait speed in the outpatient clinic: methodology and feasibility. Respir Care. 2014;59:531–537.