
 ?Mathematical formulae have been encoded as MathML and are displayed in this HTML version using MathJax in order to improve their display. Uncheck the box to turn MathJax off. This feature requires Javascript. Click on a formula to zoom.
Abstract
There is an increasing need for fast and accurate transfer of readings from blood glucose metres and blood pressure monitors to a smartphone mHealth application, without a dependency on Bluetooth technology. Most of the medical devices recommended for home monitoring use a seven-segment display to show the recorded measurement to the patient. We aimed to achieve accurate detection and reading of the seven-segment digits displayed on these medical devices using an image taken in a realistic scenario by a smartphone camera. A synthetic dataset of seven-segment digits was developed in order to train and test a digit classifier. A dataset containing realistic images of blood glucose metres and blood pressure monitors using a variety of smartphone cameras was also created. The digit classifier was evaluated on a dataset of seven-segment digits manually extracted from the medical device images. These datasets along with the code for its development have been made public. The developed algorithm first preprocessed the input image using retinex with two bilateral filters and adaptive histogram equalisation. Subsequently, the digit segments were automatically located within the image by two techniques operating in parallel: Maximally Stable Extremal Regions (MSER) and connected components of a binarised image. A filtering and clustering algorithm was then designed to combine digit segments to form seven-segment digits. The resulting digits were classified using a Histogram of Orientated Gradients (HOG) feature set and a neural network trained on the synthetic digits. The model achieved 93% accuracy on digits found on the medical devices. The digit location algorithm achieved a F1 score of 0.87 and 0.80 on images of blood glucose metres and blood pressure monitors respectively. Very few assumptions were made of the locations of the digits on the devices so that the proposed algorithm can be easily implemented on new devices.
1. Introduction
Mobile health (mHealth) is a rapidly growing and developing market that combines modern technologies to provide innovative and pervasive approaches to healthcare. This growth has led to an increase in smartphone applications that record, track and monitor a user’s personal medical data. A typical user of these mHealth applications takes a measurement using a hand-held medical device (such as blood glucose metre or blood pressure monitor, see ) and manually enters the value into the application. These values are saved as a time series of recorded data points that can be used to aid in the management of a user’s condition. Currently mHealth applications require the user to manually enter the readings recorded by these medical devices. This process is slow and prone to error. More sophisticated systems use Bluetooth technology to transmit the values from the device to the smartphone. However this adds costs to the manufacturing of the device and brings connectivity issues. Moreover, requiring a reading to be transmitted over Bluetooth makes all devices that are not Bluetooth-compatible redundant.
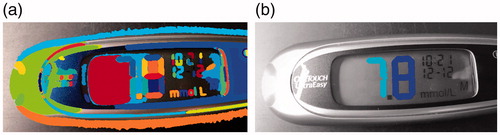
Figure 1. Examples of the hand held devices used in this paper. (a) Blood Glucose metre, One Touch Ultra Mini, showing blood glucose value of 12.8 mmol/L. (b) Blood pressure monitor, Microlife WatchBP Home, showing (in descending order): The time of reading (14:06); Systolic blood pressure (122 mmHg); Diastolic blood pressure (63 mmHg) and heart rate (56 beats per minute).
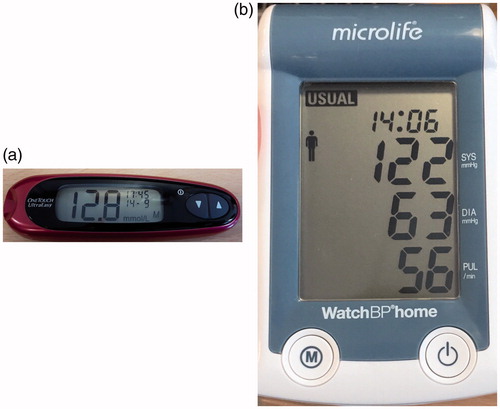
In this paper, we focus on mHealth applications for the management of blood glucose and blood pressure. An individual with Type 1 diabetes is expected to take four or more readings a day using a blood glucose (BG) metre [Citation1]. Blood glucose metres measure and display the amount of glucose in the blood in millimoles per litre of blood (mmol/L). The target blood glucose level for an individual with Type 1 diabetes is between 5 and 9 mmol/L [Citation1] depending on whether the reading is taken before or after a meal.
An individual that is diagnosed with hypertension (high blood pressure) may be required to take frequent readings of their blood pressure during the day in order to detect unusual patterns. Blood pressure is typically measured using an inflatable cuff that is placed over the upper arm. The blood pressure monitor usually displays three readings: systolic blood pressure, which is the highest blood pressure when the heart contracts; diastolic blood pressure, which is the lowest blood pressure when the heart relaxes; and the heart rate, which is the number of heart beats per minute (bpm). Blood pressure is typically measured in mmHg and can vary depending on age, physical activity, illness and other external factors. The ranges for adults are: systolic 70 to 190 mmHg and diastolic 40 to 100 mmHg [Citation2]. Heart rate can vary from 40 to 200 bpm [Citation3].
A recommended list of blood glucose metres and blood pressure monitors for home personal use can be found at [Citation4] and [Citation5] respectively. These outline 71 recommended blood glucose metres and 176 recommended blood pressure monitors. Almost all of these devices use a screen to display their value (98.6% and 97.9% for blood glucose metres and blood pressure monitors respectively). The remaining devices send the information to the user’s smartphone via Bluetooth. Of those that use a screen, the majority use a seven-segment display (71.8% and 97.7% for blood glucose metres and blood pressure monitors respectively). Seven-segment displays are made up of three horizontal and four vertical elongated hexagonal segments of pixels that can be switched on or off to form digits in a figure-of-eight formation (see ). By selectively turning these segments on or off the seven segments can show each of the ten decimal digits. These displays are ubiquitous due to their small expense and ease of operation. It was therefore decided to focus on medical devices that use seven-segment displays.
shows the medical devices used in this paper. The chosen blood glucose metre was the One Touch Ultra Mini [Citation6] (). To record a reading, the individual takes a blood sample (usually by pricking their finger tip with a lancet) and applies the blood to one end of a test strip. The other end of the strip is then inserted into the device and the reading of blood glucose content is displayed on the screen. The chosen blood pressure monitor was the Microlife WatchBP Home [Citation7] (). To record a reading, the user wraps an inflatable cuff around their arm. The cuff inflates and deflates, during which the physiological values are recorded and displayed on the screen.
Given that a large proportion of the world has access to a smartphone [Citation8], but not to a Bluetooth-compatible medical device, this paper proposes algorithms to automatically detect and read seven-segment digits from images taken of a seven-segment display of a blood glucose metre or a blood pressure monitor by a smartphone camera. The algorithms were designed to require minimal user input and work for many different types of blood glucose metres or blood pressure monitors. In order to achieve this, very few assumptions regarding the location of the digits or the format of the readings were made.
2. Previous work
There have been a number of attempts to develop software to detect and classify digits from images captured from seven-segment displays. Many of these systems follow a process of: locate a region of interest (ROI), binarise the ROI, locate digits within the binarised region and finally classify the digits by their numeric value. Significant differences in these systems occur for the methods used for region extraction and digit classification.
The Clearspeech system [Citation9] for example, used marker stickers placed on the corners of the medical device display to aid in detection of the screen as a ROI. Classification of the digits was then performed by eigenimage recognition, a technique developed for face recognition. The use of markers for ROI detection, however, limits the applicability of the algorithm: it relies on accurate placing of the markers and does not allow the user to easily switch between devices.
Ghugardare et al. [Citation10] binarised the whole input image as opposed to detecting ROIs. The algorithm then follows the process described above with classification of digits performed using templates for each individual digit. Templates exploit the fact that seven-segment digits have a rigid structure by searching for active segments in specific areas around the located digit. However, they do not perform well across different digit fonts (and therefore different devices) and are sensitive to noise. Mariappen et al. [Citation11] developed a Graphical User Interface (GUI) for the user to manually select the ROI that contains the physiological reading and used the LabVIEW Optical Character Recognition (OCR) software to read the text inside the ROI. The Coughlan lab [Citation12] developed a digital reader of seven-segment displays. The system binarised the whole image and used rule-based filtering to remove noise based on the size and aspect ratio of the image. The remaining digits were then classified by a Hough-type voting scheme.
Rasines et al. [Citation13] developed a display detection algorithm for displays with a back light. The algorithm detects regions based on thresholds of the channels in the YUV colour space (the Y component determines the brightness of the image, whereas the U and V components determine the colour). The algorithm was applicable only to displays that have their own illumination and therefore was fairly limited. Gosh et al. [Citation14] developed a GUI for the user to select the regions containing digits. Digits were then classified using a two-layer neural network trained on digits seen on one specific medical device. The digit classifier achieved a classification accuracy of 98.88%. However, the system was trained only on 300 digits from one medical device and therefore not robust to handle classification of digits from other devices.
Chang Liu’s thesis [Citation15] did not binarise the images and instead used the Stroke Width Transform (SWT) [Citation16] to locate regions potentially containing digits and a Support Vector Machine (SVM) to filter out false ROIs that did not contain valid digits. Liu implemented image enhancing methods using homomorphic and median filtering to allow the developed algorithm to operate in different lighting scenarios and reduce the effects of noise. Liu’s work provides the current state-of-the-art accuracy scores for reading values across many different types of blood glucose metre, with an accuracy score of 62.1%. It should be noted, however, that a large proportion of the images in their dataset were clean images taken from the internet and not captured in a realistic scenario.
Prakruthi et al. [Citation17] developed a screen detecting algorithm based on a Canny edge map of the input image and searched for the largest rectangular contour. The developed system allowed for the reading of medical devices with more than one physiological value on a screen such as seen in blood pressure monitors. However, the system required the prior knowledge of the location of the digits on the screen. Therefore, once the screen was cropped, regions containing digits could be obtained. This means that the algorithm cannot be used on a new medical device without first coding the locations of digits on the screens. As a result, it cannot be used across different devices.
3. Datasets
Three datasets were developed for this paper. The first dataset consisted of images of the displays of one blood glucose metre and one blood pressure monitor taken in a realistic scenario with multiple smartphone cameras. The second dataset, a synthetic dataset of seven-segment digits, was created using software developed by the authors and used to train a digit-classification model. A third dataset consisting of” real” digits found on the devices was manually extracted and labelled by the authors. This dataset was used to test the classification model on digits found on the medical devices used in our study. These datasets, together with all the code for their development, have been uploaded to [Citation18] for public use.
3.1. Images of blood glucose metres and blood pressure monitors
The first dataset consisted of images of the displays of medical devices. The medical devices used in this paper are the One Touch Ultra Mini and Microlife WatchBP Home. This dataset had to be representative of the different ways in which a user was expected to take an image using a smartphone camera. Several factors were taken into consideration such as: the distance at which the user records an image, the angle of the camera relative to the device and the amount of ambient light.
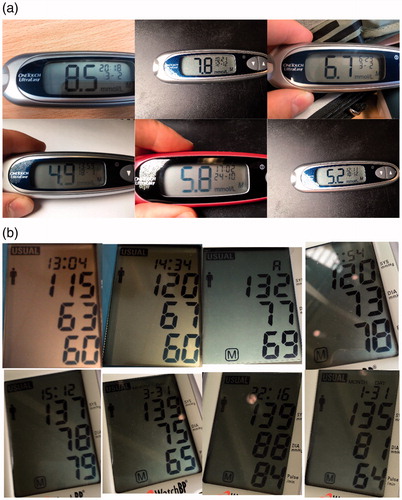
We recorded images of the medical devices with a variety of different smartphone cameras (iPhone 6S, iPhone 5, Samsung S5, HTC Desire and a Samsung Galaxy Tab E). Images were taken keeping in mind how a user might record the image in a real-world scenario. The camera phone was planar to the device and we ensured that the digits were clearly visible without significant lighting reflections. 132 images were taken of the One Touch Ultra Mini and 168 images were taken of the Microlife WatchBP Home. Examples of these images can be seen in . Each set of images was split evenly and randomly into training and test sets. In total, therefore there are four sub-datasets of medical device images: One Touch Ultra Mini training and test set and Microlife WatchBP Home training and test set. The algorithms will be developed using the training set and tested using the test set of images.
Figure 2. Examples of the images taken of the medical devices used in this paper. (a) One Touch Ultra Mini Blood glucose metre. (b) Microlife Watch Home Blood pressure monitor.
3.2. Synthetic seven-segment digits
The second dataset is a set of synthetic seven-segment digits automatically generated using software developed by the authors. This dataset was generated in order to train a seven-segment digit classification algorithm. In order to achieve a reliable classification, it was important that the generated dataset represent a realistic recording scenario. Although online, open source, automatic 7-segment digit generation software exists, [Citation19,Citation20], these software applications do not provide the ability to modify the outputs of digits to reflect the variations seen in the displays of medical devices used in our project. We therefore developed a new software toolbox to automatically generate a set of digits that reliably represents real-case images and released this code for public use so that future projects requiring a synthetic dataset of 7-segment digits can easily generate samples.
To ensure accurate classification of digits, the synthetic dataset needed to contain similar cases as found in the real test digits. Each digit was generated bu modifying several parameters grouped into three sections:
Dimension – Variation of size and shape: digit width, segment width and segment gap.
Distortion – Variations of geometry and noise that distort an image: Gaussian blur size, Gaussian blur variance, pixellation, Gaussian noise variance, salt and pepper density, angle and slant.
Colour – Changes in greyscale intensity of the digit and background: digit greyscale, segment greyscale and invert. This is to simulate a low-cost LCD screen with a low contrast between background and foreground.
To assist in the visualisation of the effects that these parameters have on a digit, and to generate a dataset, we developed a custom GUI and made it available for public use [Citation18]. The application allows users to vary all parameters described above. Details of these parameters and the justification for including them are also available at [Citation18]. The generated digits were saved as greyscale images of size 52 × 52 pixels.
We investigated different variations of these parameters in order to make a resulting synthetic dataset that contained as many of the realistic variations seen in the real-world data as possible. When deciding the range of values for a given parameter, it is important to include the extreme values that can be seen in the test set. Learning algorithms are able to interpolate from training data. However, it is difficult to extrapolate beyond the range covered in the training set.
The resulting dataset contained 13,824 images per digit, thus a total of 138,240 images were generated for the 10 digits (0–9). The range of values used for each parameter can be seen in . Min and max are the minimum and maximum values used for each parameter; step is the incremental step taken between min and max; and variations are the number of steps taken between min and max. We decided not to vary the Gaussian blur variance, as significant blurring can occur by simply varying the kernel size with a unit variance. shows examples of the synthetic digits generated.
Figure 3. Examples of synthetic digits generated and saved as greyscale 52 × 52 pixel images.
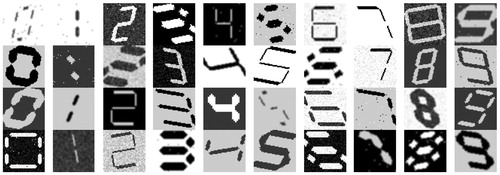
Table 1. Range of values for the parameters used to generate the synthetic dataset.
3.3. Real seven-segment digits
The third dataset contains images of “real digits” that have been manually extracted from the medical devices dataset outlined in Section 3.1. This dataset was used to test and measure the performance of the developed digit classification algorithm.
An image of a medical device contains seven-segment digits that are used to display the measurement. The ROI around each digit in each image of a medical device was manually labelled. This ROI was the smallest rectangle that contained a whole digit. The ROIs were then binarised using Sauvola binarisation [Citation21]. Each ROI was then resized so that the height of the digit was 52 pixels. A padding of white pixels was then added to the sides of the ROI so each digit was a binary image of size 52 × 52 pixels. In cases where the binarisation introduced a significant amount of noise (judged by observation) the digit was deleted.
In total, 1,377 digits were extracted and labelled from the medical devices dataset, 434 digits from the blood glucose metre images and 943 digits from the blood pressure monitor images. shows examples of the digits extracted from the medical devices and shows the distribution of digits in the dataset.
Figure 4. Example real digits extracted from the medical devices dataset and saved as a 52 × 52 pixel binary image.
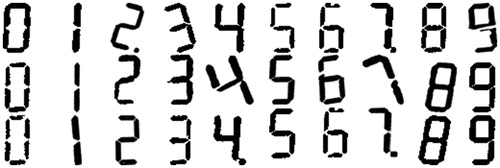
Table 2. Occurrences of each number in the “real” digit dataset.
4. Methods
The proposed method is split into two parts. Firstly, the digits were automatically located on the screen. Subsequently, the located digits were labelled by their numeric value. These methods were developed and optimised using the training datasets of images of blood glucose metres and blood pressure monitors. The results of these methods were then evaluated using the two test sets of blood glucose metres and blood pressure monitors. An algorithm was then developed to form the physiological readings such as blood glucose content; however, this is not the main aim of this paper.
The parameters initially used in these algorithms are defined in this section. These parameters are later optimised to improve the accuracy of seven-segment digit detection and reading.
4.1. Digit location
An overview of the digit location algorithm is shown in . The inputs to this algorithm are the images of blood glucose or blood pressure monitors taken by a smartphone (see ). First, noise and illumination effects were minimised by image enhancement algorithms. In order to locate the seven-segment digits in each image, the segments that make up each digit were located and stored as binary large objects (known as blobs, a term introduced in [Citation12]) in a process labelled blob extraction. This was performed using two methods in parallel. The first method used the property that the contrast between the intensities of the background of the display and the seven-segment digit was large. The second method used the property that the pixel intensities inside the area defining a segment have small variation.
Figure 5. Overview of methods for digit location and classification. The superscripts m and b represent the parameters for the paths taken where the blobs are extracted by MSER and CC binarisation respectively.
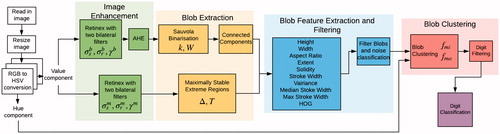
Extracted blobs that did not correspond to a digit segment were then filtered using rule-based filtering and a logistic classifier trained on several extracted features. As digits are made up of several segments, the blobs were then clustered to form a single digit. The digits found were passed to the digit classifier to label them by their numeric value. Finally, the classified digits were combined to form a physiological value such as heart rate.
4.1.1. Image enhancement
When capturing an image of a medical device, the image may have been taken under varying illumination conditions. Retinex theory deals with the removal of unfavourable illumination effects from images such as shadows or camera flashes. Retinex using bilateral filters [Citation22] was applied to each image so that the algorithm to detect digits can be robust against these variations. The contrast between the digit segments and the screen was increased in order to aid in segment detection. This was performed using adaptive histogram equalisation (AHE) [Citation23] with windows of size 8 × 8.
There are two parallel branches in the image enhancement algorithm (see . In the first path both retinex and AHE are applied to the value (V) component of the Hue Saturation Value (HSV) colour space of the image. In the second branch, only retinex is applied to the value component. Retinex using bilateral filters has three input parameters: σs, σr and γ. The parameters σs and σr correspond to the space and range variance respectively of the bilateral filters. In both branches these parameters are set to 30 and 0.2 respectively. The parameter γ is the gamma correction term and is set to 1.5 in the first branch and 0.7 in the second branch.
4.1.2. Blob extraction
Seven-segment displays are formed of segments that make up each digit. The blob extraction algorithm attempted to locate the regions of the input image that corresponded to segments in the seven-segment display. These regions were labelled as blobs (groups of pixels that all contribute to the same region of interest). Two methods for blob extraction were combined: connected components of a binarised image and Maximally Stable Extremal Regions (MSER).
The first method was adapted from a process used in the vast majority of literature in this field ([Citation10–14]). This process used the property that the contrast between the intensities of the background of the display and a seven-segment digit is large. To attempt to separate the background from the segments, the image was binarised using Sauvola’s technique [Citation21]. Sauvolas’s binarisation approximates a threshold value for each pixel in the image. If the intensity of the pixel is below the threshold, the pixel is assumed to correspond to the background and is set to be a white pixel. Otherwise the pixel is assumed to correspond to the foreground of the image and is set to be a black pixel. Sauvola’s binarisation has parameters k and k is a user-defined variable that is proportional to the binarisation threshold and was set to be 0.34.
is the size of the sliding window to perform adaptive binarisation and was set to be
where
is the height on the image in pixels. Black pixels were then grouped by connected component labelling to form blobs.
The effective binarisation of the image can be challenging. For example, when the segments were covered by a shadow resulting in a low contrast between foreground and background. To overcome this issue, connected components of a binarised image ran in parallel with Maximally Stable Extremal Regions (MSER), a technique commonly used in algorithms for text recognition in natural images.
MSER [Citation24] detected potential digits by finding regions in which the intensity values of a region vary minimally. MSER has inputs and T set to be 0.02 and 0.3 respectively. As AHE added noise to an image and MSER is dependent on consistent segment intensities rather than large contrasts between background and foreground, MSER operated on the output of retinex by two bilateral filters. However, MSER performs poorly on blurry images. This may occur if the camera is moving as the image is taken.
4.1.3. Filtering
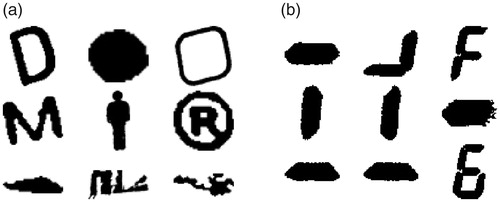
The blob extraction algorithm was designed to locate digit segments in the images. shows examples of the extracted blobs. Blobs that did not correspond to a digit segment are referred to as noise; these are shown in . Many of these blobs (such as the person outline in the middle) were extracted from the screen of the Microlife WatchBP Home and therefore it is easy to understand how they are extracted as they possessed the properties that were exploited by the blob extraction algorithm. shows a collection of blobs that are digit segments or a collection of segments. Segments can be combined when the image is blurry meaning that there is not a clear distinction between the edges of the two segments.
Figure 6. Example blobs from the blob extraction algorithm. (a) Blobs that do not correspond to digit segments. (b) Blobs that do correspond to digit segments.
In order to separate the blobs that corresponded to digit segments from those that are noise, a filtering algorithm was developed. This filtering algorithm is a combination of rule-based filtering and classification on several extracted features. A database of blobs was created by running the blob extraction algorithm on all images in the medical device image dataset. The blobs were saved as a 52 × 52 pixel binary image and manually labelled by the authors as either segments or noise. The medical device image dataset was split into training and test sets. The blobs extracted from the training sets were used to develop the filtering algorithm and the blobs from the test sets were used to test its performance.
Stroke Width (SW) [Citation16] is a common feature used in letter recognition in natural images. The stroke of a blob is defined as the length of a straight line from one edge pixel to another along its gradient direction. shows that digit segments tend to have a more consistent SW than noise. Therefore, we used the variability of blob strokes to classify if a blob was a digit segment or not.
Rule-based filtering was first performed to remove the overly large blobs that could not be digit segments. Blobs were rejected if they had properties outside of the following bounds:
Area
SW variance ratio
SW diameter median
Further blob filtering was performed by a classifier based on a certain set of features. The features extracted are commonly used features in the literature for locating text in natural images [Citation25,Citation26]:
Aspect ratio =
Occupancy rate =
Solidity =
Euler number = The total number of objects in the image, minus the total number of holes in those objects
SW variance ratio =
SW diameter median =
SW length max =
Height ratio =
Width ratio =
Histogram of Orientated Gradients (HOG) feature vector with cell sizes 8 × 8.
A logistic classifier was trained on the features from blobs extracted from the training sets of medical devices.
4.1.4. Blob clustering
The remaining blobs after performing the filtering step described in the previous section still contained some noise from the blob extraction algorithm; however the the majority of blobs remaining corresponded to digit segments that are parts of a whole digit. A blob clustering algorithm was designed to cluster these blobs into whole digits. Blobs were clustered by analysing the areas surrounding each blob. This was achieved by fitting an ellipse around each blob and enlarging the semi-major axes and semi-minor axes by factors fma and fmi set to be 1.6 and 1.3 respectively. The resulting ellipse was the region investigated around each blob for blobs to be combined with.
shows the ellipses fitted around the blobs extracted in the image in . Each blob was given a unique label and could be considered as a node in a graph. An edge between two blobs in the graph represented those blobs being clustered into the same digit. Edges were formed between two blobs Bi and Bj, if the ellipse around Bi contained any pixels of the blob Bj and vice versa. The initial graph of connected blobs for the blobs in is shown in .
Figure 7. Blob clustering example: (a) shows the blobs extracted from an example image (each colour section represents a blob), (b) shows the ellipses fitted around each segment with alphabetic labels from a to l, (c) shows the initial graph of edges made between blobs, (d) shows the graph after edges were removed after checking conditions 1–3.
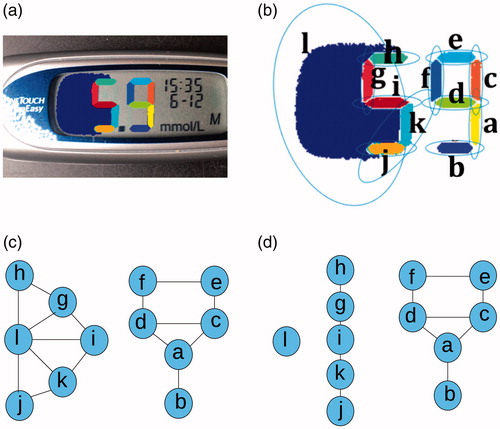
shows noise to the left of the digit 5 that was not removed by the filtering algorithm. This noise has been labelled ‘1’ and the ellipse formed around it contains pixels from the blobs that make up the digit 5 and vice versa. Therefore the graph contained only two groups: the blobs that make up the digit 9 and the blobs that make up the digit 5 combined with the noise ’l’. Edges were removed if the following conditions were not met:
(1)
(1)
(2)
(2)
(3)
(3)
where, ave() computes the mean average.
Condition 1 states that the normalised minimum distance between two linked blobs must be less than a threshold,
computed the minimum euclidean distance between the boundaries of blobs Bi and Bj. This distance was then normalised by the diagonal of the image,
where
and
are the height and width of the image in pixels.
Condition 2 states that the average hues of the blobs must not differ by more than The initial image was converted to the HSV colour space and the Hue channel was saved.
is the average hue value of the area defined by blob B in the original image.
Condition 3 states that the normalised average stroke width of two linked blobs must be less than a threshold,
is the average stroke width of the blob B. The difference was then normalised by the average stroke width for all blobs in the image.
and
are set to be 0.01, 0.3 and 0.2 respectively.
shows the results of applying these conditions to the graph in . The digit 5 was successfully separated from the noise ‘l’ and there are three groups (two groups correspond to the two digits and one group corresponds to the noise). After the blobs were clustered, the resulting groups were filtered once more based on the following criteria:
These filtering values were slightly stricter than the earlier values and were based on empirical observations. This aided in removing some of the noise that was not filtered out by the previous algorithms.
4.2. Digit classification
A classification model was built to classify the located digits by their numeric values (i.e 0,1…9). The synthetic dataset outlined in Section 3.2 (examples in ) contained 138,240 digits. The digits were binarised using Sauvola’s algorithm [Citation21] so that they were binary images and in the same format as the clustered blobs. The dataset was then split evenly and randomly into training and test datasets, with both sets containing the same parameter variations. The training set was used to train the classification model and the test set was used to record the accuracy score of the model. The test set of synthetic images was labelled ‘Test Set 1’.
We have also outlined a dataset of digits manually extracted from the medical devices (examples in ). This dataset was used to evaluate the digit classification algorithm on” real” digits and labelled ‘Test Set 2’.
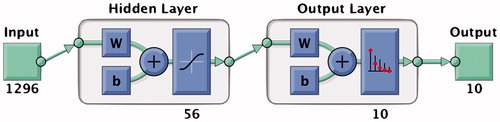
A multi-layer perceptron was trained using the training images with a HOG feature set of cell size 8 × 8 extracted for each digit. The MLP was built using Matlab’s ‘Neural Network Pattern Recognition’ toolbox with the learning rate of back-propagation using Levenberg-Marquardt [Citation27] to update the weights of each layer. Levenberg-Marquardt was chosen as it offered the fastest convergence to the global minimum. A single hidden layer with 56 hidden units was used. The model layout is shown in . A HOG feature vector with cell size 8 × 8 for an input image of size 56 × 56 has length 1296; this was therefore the size of input vector to the model plus a bias unit. The output was a vector of length 10 indicating the 10 digit classes.
Figure 8. Single hidden layer MLP built for 7-segment digit classification using Matlab’s ‘Neural Network Pattern Recognition’ toolbox. The input vector has length 1296 plus a bias unit. The hidden layer had 56 units. The output was a vector of length 10 indicating the 10 digit classes.
4.3. Reading physiological values
An algorithm for grouping the classified digits to form the physiological values such as blood glucose content was then developed. This algorithm is not the main aim of this paper, however it opens the possibility for a fully automated method for reading physiological values from images of seven-segment displays of blood glucose metres and blood pressure monitors. Grouping digits worked similarly to blob clustering. The region around each digit was investigated for other digits. This was achieved by fitting an ellipse around the classified digit, shrinking the semi-major axis by a factor of 0.4 and enlarging the semi-minor axis by a factor of 2. Digits that have been classified as a digit number 1 were enlarged by a larger factor, 10, as they had a smaller semi-minor axis to all other digits. Only the semi-minor axes were enlarged as digits to be combined lie along the same line which is parallel to the minor-axis of the digit.
As with blob clustering, each digit was thought of as a node in a graph. An edge was formed between two digits (Di and Dj) if the ellipses around either of each digit intersected. However, links were then removed if the following conditions were not met:
(4)
(4)
(5)
(5)
h(D) is the height of digit D in pixels and
is the height of the image. Condition 5 states that the digits must have a similar height to each other.
and
were set to be 0.3 and 0.1 respectively.
As physiological vital signs in the medical devices used contained more than one digit, any classified digits that did not have a link to another digit were removed. Similarly, readings in any of the devices were a combination of at most 3 digits. Therefore, any group of digits that contain more than 3 digits was removed. A final check was placed based on the expected readings. The expected readings for each vital sign were:
Blood Glucose content (mmol/L): 2.8–21.1
Systolic Blood Pressure (mmHg): 70–210
Diastolic Blood Pressure (mmHg): 40–130
Heart Rate (bpm): 40–200
The labels of each digit were concatenated from left to right and if the value fell outside of the expected reading value, then the group was removed. This aided in removing some of the noise that was not filtered out by the previous algorithms.
5. Results
5.1. Digit location
shows the results of the digit location algorithm on a sample image from the blood glucose dataset. shows the blobs found by the blob extraction algorithm. shows the results of applying the blob filtering and clustering algorithm. Each different coloured area in the images represents a different blob.
Figure 9. Locating the digits in a sample image from a blood glucose metre. Each different coloured area in the image represents a different blob. (a) Blobs detected by the blob extraction algorithm. (b) Results of the filtering and blob clustering algorithms.
The accuracy of digit location was measured against the ground truth labels manually selected for each image in the datasets of medical devices (see Section 3.1). The ground truth labels were the smallest rectangle that contained each digit present in the image of the respective medical device screen. A blood glucose metre image that contained 3 digits defining the reading had, therefore, 3 ground truth labels defining the location of each digit.
The bounding box around a potential digit was compared to each ground truth label by the Jaccard index, J [Citation28]:
where, G is the area of the ground truth bounding box, and B is the area of the bounding box around a detected potential digit. Non-maximum suppression was used so that in cases where more than one potential digit overlaps with a single ground truth bounding box, only the potential digit with the largest Jaccard score was considered as a positive detection.
The evaluation of the pre-processing algorithm used precision and recall as metrics. Precision indicates the fraction of potential digits found that are true digits. Recall indicates the fraction of potential digits identified out of all digits to be found. The F1 score combines precision and recall to a measure of accuracy of digit location:
where, TP, FP and FN are the number of true positives, false positives and false negatives respectively.
We found that in segment detection, filtering or clustering, segments can potentially be ignored and thus the potential digit to be detected was different from the one actually in the image. For example, in one case of detecting a digit 8, the middle segment was not detected, the resulting digit still had the same bounding box as the digit 8 but was wrongly classified as a digit 0, thus these cases are not reflected in reductions in F1 score. True positives were therefore passed to the digit classifier. Significant differences between the classification accuracy scores of the true positives and the datasets tested on the digit classifier gave an indication of these errors. The Jaccard index threshold is the value of the Jaccard index required for the potential digit to be accepted as a true positive. Any potential digit with a Jaccard index less than the threshold were considered false positives.
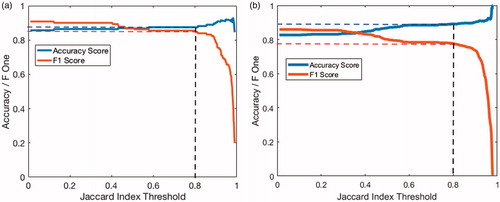
The variation of the F1 score and classifier accuracy as a function of the Jaccard index threshold is shown in for the training images of blood glucose () metres and blood pressure monitors (). The F1 score with a Jaccard threshold of 0.8 gives an indication of the accuracy of the digit location algorithm. At this threshold, the F1 score for the dataset of images of blood glucose metres was 0.85 with an accuracy of digit classification of 87.4%. For the dataset of images of blood pressure monitors, the F1 score was 0.78 with an accuracy of digit classification of 89.2%.
Figure 10. Changes in F1 and digit classification accuracy scores as the Jaccard index threshold is varied for images of: (a) blood glucose monitors and (b) blood pressure metres.
The parameters used in the digit location algorithm were optimised to maximise the F1 score using a Jaccard threshold of 0.8. The optimisation was performed using the Nelder-Mead simplex method [Citation29] found in Matlab’s optimisation toolbox. The new optimised parameters resulted in F1 scores of 0.87 and 0.80 with accuracy scores of 89.1% and 89.7% for blood glucose metre and blood pressure monitor images respectively.
5.2. Digit classification
The digit classifier was trained on the synthetic digits database. The synthetic digit dataset was generated to represent digits from many different devices. The performance scores of the digit classifier were optimised based on the performance scores on test set 1 (synthetic digits). The performance score on test set 2 (real digits) indicates how well the classification performs on unseen digits found on medical devices. The evaluation of the classification model was performed using accuracy as the metric.
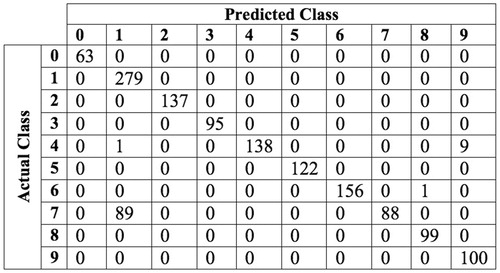
The MLP classifier using a HOG feature vector of cell size 8 × 8 gave an accuracy score of 100% and 93.0% for test sets 1 and 2 respectively. The confusion matrix for the results of classifying test set 2 using a MLP trained on HOG features is shown in .
Figure 11. Confusion matrix of classifying test set 2 (real digits) using a single layer MLP on an 8 × 8 HOG feature set.
5.3. Digit clustering and reading
A reading for a blood glucose metre was produced if there was only one cluster of connected digits. The given reading was the classified digits from left to right with a decimal point before the last digit. To measure the accuracy of the algorithm on blood glucose metres, each image was given a ground truth label of the exact reading of the digit. For example, the image shown in has a ground truth label of ’7.8’. A reading produced by the algorithm was marked as true when the algorithm was able to produce a reading (i.e., there was only one cluster of connected digits) and the given reading matched exactly with the ground truth label. For images in the training set 58.4% were marked as true. For images in the test set, 51.5% were marked as true.
A blood pressure monitor contains three values: systolic pressure, diastolic pressure and heart rate. A significant source of error comes from detecting the digits representing the clock reading at the top of the Microlife BP Home (see ). We assume that each reading can be automatically assigned to a physiological vital sign based on its value, heuristics (where it is located on the screen) and previous readings. Development of this automatic assignment is outside the scope of this paper. Therefore, a reading produced by the algorithm was marked as true when the algorithm found three clusters of connected digits, and the output readings matched with the ground truth labels. Alternatively, when the reading produced by the algorithm detected four clusters, three of which matched the ground truth labels, then the image was manually checked to see if the fourth cluster was from the clock digits. If so then the reading was assigned as true. For images in the training set, 56.8% were marked as true. For images in the test set 47.0% were marked as true.
6. Discussion
6.1. Digit location
The variation of the F1 score and classifier accuracy as a function of the Jaccard index threshold is shown in for the training images of (a) blood glucose metres and (b) blood pressure monitors. As the Jaccard index threshold was increased, a larger overlap between potential digit and ground truth was required to be accepted as a true positive. Hence the number of true positives decreased and, correspondingly, the F1 score decreased. At very large thresholds (around 0.8 and larger), the potential digit had to almost entirely overlap with the manual ground truth labels. Inaccuracies in the ground truth labelling could mean that it was more likely for a potential digit to be discarded as a false positive and therefore a rapid decrease in F1 score was observed. Conversely, as the Jaccard index threshold was increased, true positives were more likely to match their ground truth label and, therefore, the accuracy scores also increased.
At the chosen Jaccard index threshold of 0.8, the accuracy scores of digit classification (89.1% for blood glucose metres and 89.4% for blood pressure monitors) were slightly below the accuracy score of the classifier on the “real” digits (93.0%). This slight drop in performance was due to the blob extraction algorithm failing to detect certain segments (an eight with a missing middle segment will be classified as a zero).
6.2. Digit classification
As can be seen in , the digit ‘7’ was by far the most commonly misclassified as a digit ‘1’. This is explained by it’s similar pattern of active segments. The only component separating a digit ‘7’ to a digit ‘1’ is the top segment. A possible solution for this problem would be to run a separate classifier on digits detected as a seven or a one that locates only the top most segment. If this separate classifier was able to accurately distinguish between sevens and ones, the accuracy scores of the digit classifier would increase to near 100%.
For test set 2, the classifier gave accuracy scores of This test set was extracted from two different metres. Moreover, the training data set contained many variations of 7-segment digit styles. This opened the possibility for the proposed classifier to produce equally good accuracy scores on digits extracted from many different devices.
This paper, however, has assumed a specific glyph of the seven-segment display. The digits “6”, “7” and “9” can each be represented in one of two ways, with or without a “tail”. The glyph used in this paper was chosen as this was the format found in the medical devices available to us.
6.3. Digit clustering and reading
The proposed algorithm was able to correctly label 58.4% and 51.5% of images in the blood glucose training and test sets respectively. For blood pressure monitors, it was able to correctly label 56.8% and 47.0% in the training and test sets respectively. This algorithm was not the main aim for this paper and simply acts as a reference value for reading the physiological values such as heart rate from the medical devices. As discussed in Section 5.3 the digit clustering and reading algorithm can be improved by an automated assessment of readings based on their value, heuristics and previous readings. To the author’s knowledge, there is no documented work regarding reading more than one physiological value (such as seen on blood pressure monitors) that can be easily transferred to multiple devices.
6.4. Overall algorithm
As can be seen in , when taking an image of the blood pressure monitor the user is requested to focus on the whole screen with little background. This is due to the blood pressure metres containing digits on multiple lines and to allow the digit location algorithm to distinguish between these digits. A more robust algorithm can be developed which automatically locates the screen of the medical device, such as designed in [Citation17] using the Canny edge map. This would reduce the computational complexity of the algorithm by minimising the amount of noise in the selected region and allow more use cases for the image to be taken in (i.e., the image can be taken from further away). However, it was found to act as a significant source of error that can be ignored by asking the user to take the image closer to the screen. Future implementations of this work would need to consider a display recognition system. This would have two major advantages. Firstly, the dependence on the framing of the image taken by the user is reduced. Secondly a reduction in the computational load to locate digits on the screen is also achievable.
The algorithm should also be tested on a larger dataset. In order to perform this, one would need to find the optimum parameters using a new dataset of blood glucose metre or blood pressure monitor images and the Nelder-Mead simplex method as performed on our dataset.
7. Conclusion
In this paper we presented an automated process for the detection and reading of seven-segment digits from images of medical devices that used LCD screens, from two frequently-used medical devices: blood glucose metres and blood pressure monitors.
We outlined 3 major contributions, the first is our dataset of images of medical devices, seven-segment digits extracted from these devices and an open source synthetic 7-segment digit generator. These have been uploaded for public use including Matlab code and a GUI at [Citation18]. The second contribution is a seven-segment digit location algorithm for digits on devices using seven-segment displays. The algorithms were developed to take into consideration changes in ambient lighting, blur, rotation and to allow for the algorithm to be used on multiple devices. Finally, a seven-segment digit classifier using a neural network was trained on histogram-of-orientated-gradients feature vectors. When trained on a synthetic dataset that covers a wide range of seven-segment digit styles, this classifier had an accuracy of 93.0% on unseen” real” digits.
The digit location algorithm achieved an F1 score of 0.87 with a digit classification accuracy of 89.1% on images of blood glucose metres. For images of blood pressure monitors the digit location algorithm achieved an F1 score of 0.80 with a digit classification accuracy of 89.7%. This slight drop in performance was due to the blob extraction algorithm failing to detect certain segments (an eight with a missing middle segment will be classified as a zero). The developed algorithms were computationally inexpensive, allowing the possibility of implementation on a smartphone.
Disclosure statement
No potential conflict of interest was reported by the authors.
References
- National Institute for Clinical Excellence. Type 1 diabetes in adults: diagnosis and management — Guidance and guidelines; 2015. [cited 2019-01-07]; Available from: https://www.nice.org.uk/guidance/ng17/ifp/chapter/Testing-your-own-blood-glucose-and-target-levels.
- National Health Service. Blood pressure test; 2018. [cited 2018-10-30]; Available from: https://www.nhs.uk/conditions/blood-pressure-test/.
- National Health Service. How do I check my pulse? – Health questions; 2018. [cited 2018-04-30]; Available from: https://www.nhs.uk/chq/Pages/2024.aspx?CategoryID=52.
- Global Diabetes Community. Blood glucose meter guide; 2018. [cited 2018-10-30]; Available from: https://www.diabetes.co.uk/diabetes_care/blood_glucose_monitor_guide.html.
- British and Irish Hypertension Society. Validated BP monitors for home use; 2018. [cited 2018-11-20]; Available from: https://bihsoc.org/bp-monitors/for-home-use/.
- OneTouch. OneTouch UltraMini blood glucose meter; 2018. [cited 2018-05-06]; Available from: https://www.onetouch.com/products/glucose-meters/onetouch-ultramini.
- WatchBP. Microlife WatchBP home blood pressure monitor; 2012. [cited 2018-05-06]; Available from: https://www.watchbp.co.uk/index.php?id=dev_home_uk.
- Statista. Number of mobile phone users worldwide 2013-2019; 2018. [cited 2018-01-26]; Available from: https://www.statista.com/statistics/274774/forecast-of-mobile-phone-users-worldwide/.
- Morris T, Blenkhorn P, Crossey L, et al. Clearspeech: a display reader for the visually handicapped. IEEE Trans Neural Syst Rehabil Eng. 2006;14(4):492–500.
- Ghugardare R, Narote S, Mukherji P, et al. Optical character recognition system for seven segment display images of measuring instruments. TENCON 2009 – 2009 IEEE Region 10 Conference, Singapore, 23-26 Jan. 2009.
- Mariappan M, Ramu V, Ganesan T, et al. Virtual Medical Instrument for OTOROB based on LabView for acquiring multiple medical instrument LCD reading using optical charcater recognition. Proceedings from the International Conference on Biomedical Engineering and Technology (IPCBEE); Singapore, 2011;11:70–74.
- Tekin E, Coughlan JM, Shen H. Real-time detection and reading of LED/LCD displays for visually impaired persons. IEEE Workshop on Applications of Computer Vision (WACV), Kona, HI, USA, 5–7 Jan. 2011; p. 491–496.
- Rasines I, Iriondo P, Díez I. Real-Time display recognition system for visually impaired. In: Miesenberger K, Karshmer A, Penaz P, Zagler W, eds. Computers Helping People with Special Needs. ICCHP 2012. Heidelberg, Berlin: Springer; 2012. p. 623–629.
- Ghosh S, Shit S. A Low Cost Data Acquisition System from Digital Display Instruments Employing Image Processing Technique. 2014 International Conference on Advances in Computing, Communications and Informatics (ICACCI). New Delhi, India, 24–27 Sep. 2014. p. 1065–1068.
- Liu C. Digits Recognition on Medical Device. Electronic Thesis and Dissertation Repository 3683. 2016. Available from: https://ir.lib.uwo.ca/etd/3683.
- Li Y, Lu H. Scene text detection via stroke width. 21st International Conference on Pattern Recognition (ICPR), Tsukuba, Japan, 11–15 Nov. 2012. p. 681–684.
- Prakruthi M K, Vismaya K V, Suhas S, et al. Application of convolutional neural networks in mobile devices for inferring readings from medical apparatus. Int J Sci Res. 2017;4:2321–2705.
- Camera Lab Resources; 2019 [cited 2019-01-30]; Available from: https://cameralab.eng.ox.ac.uk/resources.html.
- 3Quarks. Segment Display; 2012. [cited 2018-01-31]; Available from: http://www.3quarks.com/en/SegmentDisplay/.
- Avtanski. LCD/LED Screenshot Generator; 2018. [cited 2018-01-31]; Available from: http://avtanski.net/projects/lcd/.
- Sauvola J, Seppanen T, Haapakoski S, et al. Adaptive document binarization. Pattern Recogn. 1997;1:147–152.
- Elad M. Retinex by two bilateral filters. International Conference on Scale-Space Theories in Computer Vision; Berlin, Heidelberg, 2005. 217–229.
- Sonker D, Parsai MP. Comparison of histogram equalization techniques for image enhancement of grayscale images of dawn and dusk. Int J Mod Eng Res. 2013;3(4):2476–2480. Available from: www.ijmer.com.
- Yin XC, Yin X, Huang K, et al. Robust text detection in natural scene images. IEEE Trans Pattern Anal Mach Intell. 2014;36(5):970–983.
- Neumann L, Matas J. Real-time scene text localization and recognition. 2012 IEEE Conference on Computer Vision and Pattern Recognition (CVPR). 2012. 3538–3545.
- Gonzalez A, Bergasa LM, Yebes JJ, et al. Text location in complex images. 21st International Conference on Pattern Recognition (ICPR), Tsukuba, Japan, 11–15 Nov. 2012. p. 617–620.
- Roweis S. Levenberg-Marquardt Optimization. Notes, University Of Toronto. 1996.
- Jaccard P. The Distribution of the flora in the alpine zone. New Phytol. 1912;11:37–50. doi:10.1111/j.1469-8137.1912.tb05611.x.
- Olsson DM, Nelson LS. The Nelder-Mead simplex procedure for function minimization. Technometrics. 1975;17(1):45–51.