
 ?Mathematical formulae have been encoded as MathML and are displayed in this HTML version using MathJax in order to improve their display. Uncheck the box to turn MathJax off. This feature requires Javascript. Click on a formula to zoom.
Abstract
The competing structural and hemodynamic considerations in valve design generally require a large amount of in vitro hydrodynamic and durability testing during development, often resulting in inefficient “trial-and-error” prototyping. While in silico modelling through finite element analysis (FEA) has been widely used to inform valve design by optimising structural performance, few studies have exploited the potential insight FEA could provide into critical hemodynamic performance characteristics of the valve. The objective of this study is to demonstrate the potential of FEA to predict the hydrodynamic performance of tri-leaflet aortic valve implants obtained during development through in vitro testing. Several variations of tri-leaflet aortic valves were designed and manufactured using a synthetic polymer and hydrodynamic testing carried out using a pulsatile flow rig according to ISO 5840, with bulk hydrodynamic parameters measured. In silico models were developed in tandem and suitable surrogate measures were investigated as predictors of the hydrodynamic parameters. Through regression analysis, the in silico parameters of leaflet coaptation area, geometric orifice area and opening pressure were found to be suitable indicators of experimental in vitro hydrodynamic parameters: regurgitant fraction, effective orifice area and transvalvular pressure drop performance, respectively.
1. Introduction
Aortic stenosis is a valvular heart disease, whereby calcification build-up on the native valve leaflets leads to restricted blood flow and increased left ventricular hypertrophy [Citation1]. Severe aortic stenosis is treated with either surgical or transcatheter aortic valve replacement (TAVR), with over 300,000 valve replacements performed in the developed world each year [Citation2]. This number is expected to increase in the coming years with ageing demographics [Citation3]. Bioprosthetic heart valves (BHV) are now widely used and consist of either bovine or porcine tissue leaflets mounted on a metallic stent frame, with the distinct advantage that they can be delivered minimally invasively. While these devices have demonstrated good clinical outcomes [Citation4], there is significant room for further design improvements to enhance structural durability and long-term hemodynamic performance. This is a problem particularly in younger patients where the onset of structural valve degeneration can occur 10 to 15 years post implantation, requiring reoperation [Citation5–8]. Recently, there has been increasing interest in developing synthetic polymer leaflets as an alternative to bioprosthetic tissue leaflets in TAVR devices. While these polymeric valve devices are at an earlier stage of development, they have the potential to provide superior patient outcomes, as well as vastly improved efficiency in the manufacturability and reproducibility of TAVR devices [Citation9,Citation10]. In developing the next generation of aortic valve replacements, there are significant challenges that must be overcome to achieve suitable designs capable of withstanding the demanding functional requirements at the native aortic root. This applies to both bioprosthetic and synthetic leaflet-based aortic valve replacements (both surgical and TAVR), which must undergo stringent functional mechanical testing during the certification process.
The key mechanical requirements for an implanted aortic valve relate to both structural and hemodynamic performance. Throughout their lifespan, aortic valve implants should be highly durable to withstand pressures and stresses experienced over the approximately 40 million beats per year. Over a cardiac cycle, aortic valve implants should provide minimal resistance to forward blood flow to maximise orifice area in the open configuration, have a low-pressure differential to revert to the closed configuration, and facilitate rapid closure to reduce volume regurgitation or forward flow energy loss. Development takes place through both in silico modelling and in vitro bench testing, with the latter the more widely used, readily available, and standardised approach. In vitro bench testing is underpinned by ISO 5840:2021 [Citation11–13], which is the international standard that provides guidelines, specifications and minimum design criteria that cardiac valve prostheses must fulfil to be deemed safe and effective for patients by the U.S. Food and Drug Administration (FDA) and relevant EU notified bodies. For durability testing, valve replacements with gradual degradation failure modes must be able to withstand 200 million consecutive cardiac cycles while valve replacements with the potential for immediate failure must withstand 400 million cycles to comply with the standard [Citation11]. Hydrodynamic assessments using pulsatile flow bench test systems simulate physiological conditions and are used to assess valve hemodynamic performance. ISO 5840 defines acceptable values for key performance parameters of effective orifice area (EOA) and regurgitant fraction (RF) for surgical and transcatheter valve replacements operating at normotensive conditions at a range of orifice sizes [Citation12,Citation13]. Many comprehensive studies comparing these parameters across valve designs have been carried out on commercial flow rigs [Citation9,Citation14,Citation15], which are also capable of investigating additional parameters such as the left ventricular energy loss, leakage volumes and transvalvular pressure drop (ΔP). These are further indicators of valve performance and useful in the design process. While durability and hydrodynamic testing according to ISO 5840 provides a comprehensive assessment of structural and hemodynamic performance of valves, the development pathway typically involves a trial-and-error process of design, prototyping and testing. Each design iteration requires an extensive suite of bench tests [Citation11–13] and relying solely on this method contributes to high development costs and increased time to market for aortic valve devices.
Computational modelling approaches have the potential to accelerate design timelines of aortic valves and optimise functional performance. However, predicting the structural and hemodynamic behaviour of aortic valve implants in silico represents a challenging multi-physics problem. For this, advanced fluid–structure interaction (FSI) simulations are used to analyse the flow profiles of valves [Citation16], as well as approximating EOA, RF and transvalvular ΔP [Citation17,Citation18]. The main drawbacks of FSI simulations are their complexity, robustness, large computational cost and development time, which has meant that uncoupled approaches are more widespread in the literature [Citation19]. Computational fluid dynamics approaches have been used to explore valve haemodynamics [Citation20–22], and typically focus on providing predictions of flow regimes, and parameters such as wall shear stress or velocities by assuming the valve as a rigid boundary [Citation20–22]. Despite providing highly detailed predictions of local flow profiles, computational fluid dynamics offers surprisingly little insight into the overall hemodynamic performance of the valve when considered in the context of the key parameters identified in ISO 5840 and in vitro bench testing. In particular, EOA, RF and transvalvular ΔP are bulk, or system-level, hemodynamic parameters and cannot be assessed based on the rigid boundary assumptions. On the other hand, finite element analysis (FEA) has been widely used for structural analysis of the aortic valve, predicting leaflet deformation in open and closed configurations [Citation10,Citation23–30]. To date, the vast majority of FEA studies focus on a traditional stress analysis, with a view to optimising leaflet or frame design to enhance fatigue behaviour and overall durability [Citation10,Citation26,Citation27]. While these approaches are providing insight into structural integrity of the valve, very few studies have sought to exploit the potential of FEA in predicting hydrodynamic parameters that are key valve design characteristics. Importantly, the bulk hemodynamic parameters measured according to ISO 5840 through in vitro bench testing (e.g. EOA, RF and transvalvular ΔP) are largely related to compliance of the valve, which provides an opportunity for FEA to provide critical insight into hemodynamic performance characteristics of valve design.
The objective of this study is to investigate the potential of FEA to predict the hydrodynamic performance of aortic valve implants during development. Several variations of tri-leaflet aortic valves were designed and manufactured using a synthetic polymer and hydrodynamic testing carried out using a pulsatile flow rig according to ISO 5840, with bulk hydrodynamic parameters measured. The in silico framework uses a mathematical model to apply pressure-based boundary conditions to three-dimensional finite element models of the aortic valves in systolic and diastolic configurations, with predicted outputs compared to the results from in vitro testing. Through regression analysis, the in silico parameters of leaflet coaptation area, geometric orifice area and opening pressure were investigated as surrogate predictors for in vitro hydrodynamic parameters, namely regurgitant fraction, effective orifice area and transvalvular pressure drop performance, respectively. While the developed methods are demonstrated on surgical aortic valves, they are applicable across both surgical and TAVR tri-leaflet valve designs.
2. Materials and methods
2.1. Valve designs
Three unique aortic valves (A, B & C) were designed and manufactured from a synthetic polymer, as shown in . Each valve featured a tri-leaflet design, with an internal orifice diameter of 23 mm (±0.2 mm) and an embedded steel wire frame to provide radial reinforcement, with a skirt/suture ring around the basal circumference to enable mounting during in vitro testing. Characteristic dimensions of each valve design are listed in and identified in , where D represents the internal diameter (mm), t the leaflet thickness (mm), h the maximum leaflet height (mm), α the lunula angle (°) and θ the insertion angle (°) of the leaflet. Valve A is a generic valve design representative of commercial pericardial surgical prostheses, while Valve B was modified by increasing the strut height and lunula angle, thereby decreasing the leaflet height at the centre of the valve. Valve C featured a unique free-edge profile that increased the free-edge perimeter length. A polyurethane elastomer variant developed at the National University of Ireland, Galway was used to manufacture the valves. The reacted polymer mixture was transferred to compression moulds, compressed by a clamp and cured in an oven at 50 °C for 4.5 h. Once cured, the moulds were removed from the oven and allowed to cool to ambient temperature before removing the valves from the moulds.
Figure 1. Unique valve designs A, B and C, where Valve A shows the finite element mesh. Design features of valves B and C are highlighted, while the characteristic valve dimensions are identified in the far-right schematic, where D represents the internal diameter (mm), t the leaflet thickness (mm), h the maximum leaflet height (mm), α the lunula angle (°) and θ the insertion angle (°) of the leaflet.
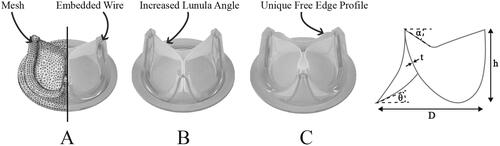
Table 1. Characteristic valve dimensions.
2.2. In vitro testing
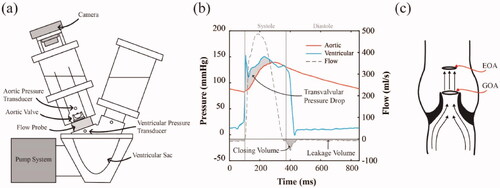
To evaluate the hydrodynamic performance of each valve, in vitro bench testing was performed using a Vivitro Pulse Duplicator () (Vivitro Labs, Inc. Victoria, B.C.) according to ISO 5840. Valves were sealed in a mounting ring and placed in the aortic position between the ventricular sac and aorta of the flow rig. This flow rig reproduced cardiac pulsatile flow by compressing the ventricular sac, ejecting fluid through the aortic valve according to assigned stroke volume, systolic waveform and heart rate. Pressure transducers recorded the aortic, ventricular and atrial pressures while a flow probe positioned directly below the valve took flow measurements during each cycle, as shown in . Valves were submerged in water for 2 h prior to testing in 0.9% NaCl solution at room temperature (20ᵒC). To investigate the hydrodynamic performance across a range of conditions, each valve was tested at increasing cardiac outputs of 2, 3, 4, 5, 6 and 7 L/min, while maintaining a constant mean aortic pressure of 100 mmHg, heart rate of 70 bpm and a systolic waveform occupying 35% of the cardiac cycle. High-speed images were captured using a Sony RX100 Mark IV camera () at a frame rate of 1000fps to visualise open and closing configurations of valves during testing. Vivitest software (Vivitro Labs, Inc. Victoria, B.C.) recorded pressure and flow measurements over 10 consecutive cycles, which were used to calculate several hydrodynamic parameters, namely the EOA, RF and transvalvular ΔP. The EOA is defined as the minimal cross-sectional area of the jet formed downstream of the aortic valve [Citation31,Citation32]. It is often used during cardiac catheterisation to assess the severity of aortic stenosis in patients [Citation8,Citation33]. It is calculated using the Gorlin Formula [Citation34] given by
(1)
(1)
where
is the root mean squared forward flow (ml/sec),
is the mean transvalvular pressure drop (mmHg) and
is the density of the test fluid (g/cm3). The RF is a measure of aortic valve leakage and is calculated by the regurgitant volume (
) as a fraction of the stroke volume (
), as in EquationEq. (2)
(2)
(2)
(2)
(2)
where
is the sum of the closing volume and leakage volume (). The transvalvular ΔP, shown in , refers to the pressure gradient across the valve during systole where the ventricles contract ejecting blood into the aorta and pulmonary artery. It is calculated as the mean pressure difference between the start and end of the systole positive pressure drop. It is used to assess aortic stenosis, with pressure drops of greater than 40 mmHg being considered severe [Citation35]. In the design of replacement valves, low-pressure drops indicate ease of opening, which translates to a more efficient valve.
Figure 2. (a) Schematic of Vivitro Pulse Duplicator with pressure transducers and a flow probe which was used to carry out in vitro hydrodynamic testing, (b) a typical diagram of average flow measurements, aortic and ventricular pressures measured over 10 cardiac cycles and (c) a schematic showing the effective orifice area (EOA) as a measure of the downstream jet from the aortic orifice, where geometric orifice area (GOA) is measured as the opening area of the leaflets.
2.3. In silico modelling framework
A three-dimensional finite element model of each tri-leaflet valve under systolic and diastolic pressure conditions was developed using the Abaqus/Explicit finite element code (Abaqus 2017, Simulia, RI, USA). Valve A, B and C models were meshed with approximately 29,000, 34,000 and 47,000 10-node modified quadratic tetrahedrons respectively, as shown for Valve A in . The wire frames were meshed using approximately 600 8-node linear brick, reduced integration, hourglass control elements, and assigned an embedded region constraint. This specifies the wire elements as embedded within the valve host and constrains the translational degrees of freedom of each embedded node to interpolated values of the corresponding degrees of freedom of the host element. The material behaviour of the synthetic polymer was determined based on displacement-controlled uniaxial tensile tests, carried out on a Zwick Roell Uniaxial Testing machine, at a 5 mm/min displacement rate on a 100 N Load cell. The D882–18 standard test method for tensile properties of thin plastic sheeting [Citation36] was modified for use with our reduced length testing specimens (Length = 50 mm), which were submerged in water at room temperature (20ᵒC) for at least 2 h prior to testing. A second-order non-linear isotropic Ogden (N = 2) material model given by
(3)
(3)
where
is the strain energy potential,
(
) are the deviatoric principal stretches,
is the elastic volume ratio and
and
are the material parameters shown in , was calibrated to the experimental data shown in .
Figure 3. An Ogden (N = 2) constitutive model was fitted to the experimental uniaxial tensile test results of the polymer.
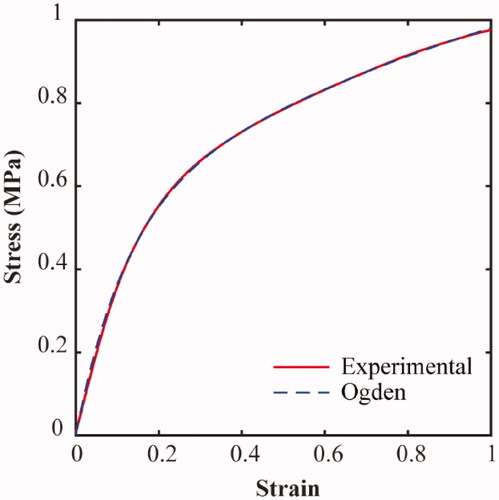
Table 2. Parameters for Ogden (N = 2) constitutive model.
Table 3. FE pressure boundary conditions generated from Windkessel and Bernoulli models.
The polymer was assigned a density of 1 g/cm3. The wire frame was modelled as linear elastic and assigned the material properties of steel, with a Young’s modulus of 200 GPa, a Poisson ratio of 0.3 and a density of 8.05 g/cm3. A mathematical model was used to determine pressure-based boundary conditions for the valve leaflets, to appropriately represent diastolic and systolic conditions during the cardiac cycle. A two-element Windkessel model and the simplified Bernoulli equation were used to determine pressure waveforms based on the prescribed inputs of cardiac output (L/min), heart rate (bpm) and mean aortic pressure (mmHg). These model inputs are the same parameters that were prescribed during in vitro experimental testing. For the diastolic pressure conditions, a two-element Windkessel model was used to generate a maximum aortic pressure for each cardiac output, given by
(4)
(4)
where
is the flow,
is the pressure,
is the resistance of the smaller arteries and
is the compliance of the aorta. For the systolic pressure condition, the Bernoulli equation was used to generate the estimated transvalvular ΔP for each cardiac output, given by
(5)
(5)
where ρ is the density of the test fluid,
is the velocity,
is the acceleration due to gravity and
is the height difference. These pressure conditions, shown in , were applied using a smooth step amplitude, to fully close and then fully open the valve.
2.4. Surrogate hydrodynamic measures
Hydrodynamic parameters of EOA, RF and transvalvular ΔP were measured during in vitro testing to provide a measure of valve performance. In this study, several measures from the finite element simulations were investigated as surrogate measures for these experimental parameters. Firstly, Geometric Orifice Area (GOA), which is the anatomical area of the valve orifice, was investigated as a surrogate measure for EOA. From the models, the GOA was evaluated as the simulated opening area of the valve at systole, using the image processing toolbox in MATLAB (Mathworks, Natick, MA, USA). As shown in , EOA and GOA are separate measurements which both relate to the opening area of the valve. The EOA has been shown to be influenced by the anatomical opening area of the orifice as well as the geometrical contraction profile of the orifice [Citation32]. Previous studies have already assumed that GOA was a suitable predictor of EOA [Citation29], although there are limited comparisons between these measures. Secondly, Leaflet Coaptation Area (LCA) upon valve closure was investigated as a surrogate measure for RF. As cardiac outputs are increased, the pressure gradient across the valve will rise. This will increase the amount of contact between the leaflets, which would reduce the amount of fluid regurgitation. Previous studies have suggested that LCA is a reflection of RF as it facilitates a larger surface area for distribution of the diastolic load across the leaflets [Citation10], however, again, a direct comparison between computational predictions and experimental observations has not been made. Therefore, this study measures LCA from the simulations and evaluates its potential as a surrogate measure for RF. Thirdly, the opening pressure required to achieve 40% of the maximum aortic valve orifice area (POA40%) was investigated as a surrogate measure for the transvalvular ΔP during systole. Similar approaches have been used previously, by observing the difference in time taken to open two valves, as well as the required pressures to open them when designing for a reduced transvalvular ΔP [Citation29].
3. Results
3.1. Evaluation of valve deformation
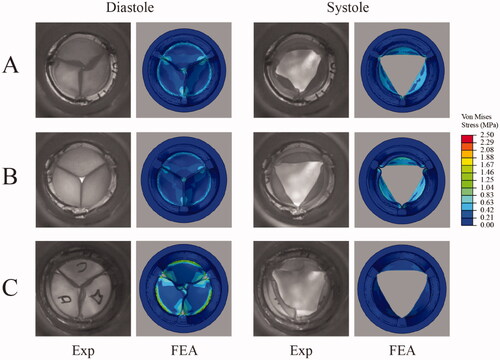
In vitro and in silico deformations of each valve under investigation during systole and diastole at normotensive conditions of cardiac output 5 L/min are shown in . In diastole, there was excellent qualitative agreement between in vitro and in silico results, with the FEA simulations predicting the twisting or pin-wheeling deformation in Valve A. Valve B demonstrated less compliance than Valve A, and this was captured in the FEA simulation. In the experimental test the orifice at closing was larger than the FEA prediction. Valve C also exhibited pin-wheeling which was captured in the FEA simulation. Also evident in both results is the gap between the leaflets during closure at the strut attachment points. In systole, there was reasonable qualitative agreement between in vitro and in silico opening configurations, although experimental results showed evidence of asymmetric opening in certain cases (likely caused by local flow instability), a feature that is not captured by FEA. The FEA contour plots highlight the von Mises stress distribution in each valve concentrated around the leaflet base attachment. The highest stress levels were observed in Valve C while Valve A had the lowest stress values.
Figure 4. The diastolic and systolic positions of the valves at normotensive conditions of 5 L/min were captured and viewed from the outflow (aortic) side of the valve. The experimental (EXP) in vitro hydrodynamic condition as viewed from the outflow tract, compared to the corresponding finite element analysis (FEA) valve simulation with stress contours showing the von Mises stress (MPa).
3.2. In vitro testing
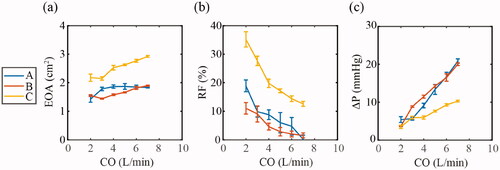
Based on in vitro hydrodynamic testing of each valve, the mean values of EOA, RF and transvalvular ΔP are shown in , with standard deviation represented by error bars (each valve tested over 10 cycles). The EOA was found to increase in each valve with increasing cardiac outputs, with the mean EOA over all the cardiac outputs for Valve A, B and C measured at 1.77 cm2, 1.66 cm2 and 2.53 cm2 respectively, while Valve C had the highest EOA at each cardiac output. RF decreased with increasing cardiac output in each valve, with the mean RF over the entire cardiac outputs for Valve A, B and C measured at 8.08%, 5.19% and 21.12% respectively, while Valve C had the largest RF over the range of cardiac outputs. The transvalvular ΔP increased in each valve with increasing cardiac output, with the mean transvalvular ΔP over the entire cardiac outputs for Valve A, B and C measured at 11.84 mmHg, 12.45 mmHg and 7.09 mmHg, respectively. Valve C had the lowest transvalvular ΔP generally over the range of cardiac outputs.
Figure 5. In vitro hydrodynamic parameters according to ISO 5840 of effective orifice area (EOA), regurgitant fraction (RF), and transvalvular pressure drop (ΔP), were measured with increasing cardiac output (CO) of 2–7 L/min and compared across the three valve geometries. Data are represented as the mean ± SD, n = 10 (each valve tested over 10 cycles), (a) EOA with increasing CO for Valves A, B and C. (b) RF with increasing CO for Valves A, B and C. (c) Transvalvular ΔP with increasing CO for Valves A, B and C.
3.3. Finite element analysis
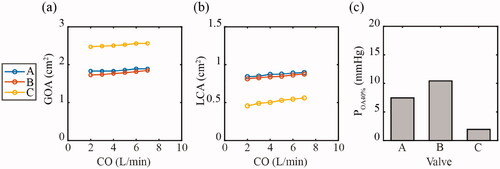
The predicted values of GOA, LCA and POA40% with increasing cardiac output from the in silico models are shown in . The GOA rose in each valve as the cardiac output increased. Valve C had the highest GOA consistently at each cardiac output, while Valve B was consistently lowest. The LCA also rose with increasing cardiac output in each valve, with Valve A and B producing similar results. Valve C consistently had the lowest LCA for each cardiac output. The POA40% was lowest in Valve C at 1.95 mmHg, while Valve A and B had a POA40% of 7.46 mmHg and 10.4 mmHg, respectively.
Figure 6 . In silico measured parameters of (a) geometric effective orifice area (GOA) and (b) leaflet coaptation area (LCA) were compared across the three valve geometries, A, B, and C for calculated pressures corresponding to increasing cardiac outputs (CO) of 2–7 L/min. (c) The pressure to achieve 40% of each valves orifice area (POA40%) was measured for valves A, B and C.
3.4. Surrogate measures
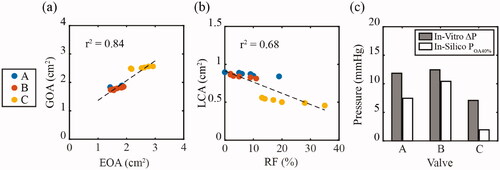
Regression analysis was used to determine correlations between the surrogate parameters evaluated in silico and the bulk hydrodynamic parameters determined through in vitro bench testing. shows the GOA (in silico) plotted against EOA (in vitro) for increasing cardiac output. A strong correlation between GOA and EOA was found with a r2 value of 0.84. shows the LCA (in silico) plotted against RF (in vitro). A good correlation between LCA and RF was observed with an r2 value of 0.68. shows the POA40% (in silico) plotted alongside the mean transvalvular ΔP over the entire cardiac outputs (in vitro). The lowest pressures were recorded in Valve C and is captured in both the POA40% and mean ΔP.
Figure 7. In silico surrogate measures were plotted against in vitro hydrodynamic parameters across the three valve geometries, A, B, and C. (a) Geometric effective orifice area (GOA) was plotted against the effective orifice area (EOA), while (b) leaflet coaptation area (LCA) was plotted against the regurgitant fraction (RF). (c) The pressure to achieve 40% of the orifice area (POA40%) was plotted against the mean transvalvular pressure drop (ΔP) over the range of cardiac outputs.
4. Discussion
Through in vitro and in silico testing, this study outlines the potential for three-dimensional finite element modelling to be used as a predictor of the in vitro hydrodynamic performance of tri-leaflet aortic valve implants. Several variations of tri-leaflet polymeric aortic valves were designed and manufactured and hydrodynamic testing carried out using a pulsatile flow rig according to ISO 5840. The in silico framework was developed to closely re-create these testing regimes and several of the predicted outputs were found to correlate with bulk hydrodynamic parameters measured experimentally across each valve type. These proposed surrogate measures consider in silico GOA as a surrogate measure for in vitro EOA, in silico LCA as a surrogate measure for in vitro RF and in silico POA40% as a surrogate measure for the in vitro transvalvular ΔP. Importantly, the in silico framework used Windkessel and Bernoulli models to generate pressure-based boundary conditions for all cardiac outputs considered, and thereby remained independent from the in vitro tests (e.g. was not calibrated to them). The results of this study demonstrate that this in silico testing framework can provide insight into both the structural and hemodynamic performance of aortic valve designs, which could potentially streamline the development process and reduce the need for trial-and-error prototyping in the early design phase.
The use of finite element modelling in the design and analysis of aortic valve replacements has been widespread [Citation10,Citation23–30]. The vast majority of these studies have been limited to predictions of structural performance, generally focussing on stress optimisation of the valve leaflets to optimise their long-term durability [Citation10,Citation26,Citation27]. Indeed, certain studies have suggested that predictions of GOA could be used to reflect EOA [Citation29], and/or that LCA may be used to indicate RF [Citation10,Citation37]. However, our study is the first to demonstrate the suitability of such surrogate measures by comparing in silico and in vitro performance through regression analysis across several different valve designs and over a range of cardiac outputs. At systole, there were expected increases in both GOA and EOA observed as cardiac output increased, with an r2 value of 0.84. This strong correlation supports the use of this FE measure as a surrogate for use with tri-leaflet valves. At diastole, the proposed surrogate measure for RF was the LCA between the leaflets. Increasing the coaptation area between leaflets has previously been assumed to improve hydrodynamic performance [Citation10,Citation37], but has not been validated as a measurement. In our testing, we demonstrated a direct inverse relation between the RF and LCA, with increasing cardiac outputs for three separate valve designs, with an r2 value of 0.68. This good correlation shows that maximising LCA between leaflets in FEA modelling should produce lower regurgitant fractions in a valve. It is not however the only factor to consider for regurgitant fraction. At valve closure, noticeable openings in the orifice for potential backflow were particularly prominent in Valve C due to the expanded free edge profile, while still present on a smaller scale in Valve A and B. This was thought to affect the overall RF of the valves. To identify a measure of the transvalvular ΔP, we explored the systolic opening of the three valves and measured the predicted pressure at 40% of the maximum opening area (POA40%). Similar approaches for transvalvular ΔP were proposed by Burriesci et al. where two valve designs were compared using FEA and in vitro testing and a reduced transvalvular ΔP was found to coincide with reduced stress levels and lower opening pressures [Citation29]. Our reported values clearly show that the measured transvalvular ΔP values across all valves coincide with trends predicted for POA40% in all valves. This demonstrates the potential of POA40% to be used as a surrogate measure when trying to minimise transvalvular ΔP during the valve design process. Taken together, these results demonstrate the ability of FEA models to provide surrogate predictions of the bulk hydrodynamic performance of valves. However, it is important to note that the correlations presented here may not translate to other valve types/designs, and therefore it may not be possible to determine actual values from the surrogate measures. Despite this, the study should encourage the use of FEA to provide an indicator of hydrodynamic performance before needing to develop more complex FSI models or prototyping valves for experimental testing, particularly when comparing early design variations.
Both the experimental and in silico models provide detailed information on both structural and hydrodynamic performance for each of the three tri-leaflet valves considered. The in vitro hydrodynamic testing shows that all three 23 mm valves meet the minimum requirements for EOA set out by ISO 5840, which is greater than or equal to 1.25 cm2 at 5 L/min [Citation38]. Valve C consistently showed the largest EOAs at each cardiac output and the lowest levels of transvalvular ΔP at higher cardiac outputs. This performance is likely attributed to the increased insertion angle () and reduced curvature of the leaflet belly, which reduces the pressure required to open the leaflet. However, Valve C showed high levels of leakage, well above the ISO 5840 requirements of less than or equal to 10% RF at 5 L/min for a size 23 mm valve, which was also reflected in the FEA with low levels of LCA. Valves A and B both met the ISO 5840 requirement for RF. Improvements to Valve C could be made by reducing the gap between the leaflets brought about by the unique orifice profile, in an effort to reduce the high levels of RF, but otherwise Valve C performed well. While not the purpose of this study, the FEA also provided predictions of structural performance (), highlighting the stress profile across the leaflets in each valve. Noticeably higher peak stresses around the leaflet basal attachment zones were evident in Valve C, which would suggest that this area should be reinforced for greater long-term performance. In addition, the pin-wheeling effect, a diastolic deformation of the leaflets, was observed in in vitro testing and replicated in the FEA. This effect can lower the long-term performance of a valve by accelerating the fatigue damage of the leaflets [Citation39]. Together with the in silico surrogate measures proposed in this study, this in silico framework may be used in combination to provide insight into both hydrodynamic and structural performance of valve designs.
There were certain limitations in this study. Peak pressure conditions were applied for the systolic and diastolic configurations; however, a better representation would be to apply a physiological pressure profile. Previous studies that have implemented this in their models typically simplify the valve model down to isolated leaflets [Citation23,Citation29], whereas our models represented the entire 3 D geometry and included the embedded wire stent. This resulted in convergence issues when using a physiological pressure profile. Another limitation was found in the experimental testing where asymmetrical opening of the leaflets was observed, whereas the FEA models opened symmetrically. This has been previously described as a disadvantage of FEA compared to FSI models [Citation40], however since the results are based on the incremental changes of final valve configurations it is not necessary for the purposes of this study. It is also worth noting that while three unique valve designs were investigated, Valves A and B showed similar responses for EOA, transvalvular ΔP and RF. Increasing the range of this study by comparing a larger cohort of valves would support the results, but was decided to be out of the scope of this study which was considered adequate as an evaluation of the surrogate measures.
5. Conclusion
An in silico framework has demonstrated that finite element models can predict several surrogate measures for bulk hydrodynamic performance of aortic valves. Here, in silico GOA can act as a surrogate measure for in vitro EOA, in silico LCA can act as a surrogate measure for in vitro RF, while in silico POA40% can act as a surrogate measure for the in vitro transvalvular ΔP. The results of this study demonstrate that this in silico testing framework can provide insight into both structural and hemodynamic performance of aortic valve designs, which could potentially streamline the development process of aortic valve implants.
| Nomenclature | ||
| TAVR | = | Transcatheter aortic valve replacement |
| BHV | = | Bioprosthetic heart valve |
| EOA | = | Effective orifice area (cm2) |
| RF | = | Regurgitant fraction |
| ΔP | = | Pressure drop (mmHg) |
| FSI | = | Fluid-structure interaction |
| FEA | = | Finite element analysis |
| GOA | = | Geometric orifice area (cm2) |
| LCA | = | Leaflet coaptation area (cm2) |
| POA40% | = | Opening pressure required to achieve 40% of the maximum aortic valve orifice area (mmHg) |
Acknowledgement
The authors wish to gratefully acknowledge William Hickey for his help with sample preparation and in vitro hydrodynamic testing.
Disclosure statement
The authors report no conflicts of interest.
Additional information
Funding
References
- Adams HSL, Ashokkumar S, Newcomb A, et al. Contemporary review of severe aortic stenosis. Intern Med J. 2019;49(3):297–305.
- Manji RA, Menkis AH, Ekser B, et al. The future of bioprosthetic heart valves. Indian J Med Res. 2012;135:150–151.
- Osnabrugge RLJ, Mylotte D, Head SJ, et al. Aortic stenosis in the elderly: Disease prevalence and number of candidates for transcatheter aortic valve replacement: a meta-analysis and modeling study. J Am Coll Cardiol. 2013;62(11):1002–1012.
- Daubert MA, Weissman NJ, Hahn RT, et al. Long-term valve performance of TAVR and SAVR: a report from the PARTNER I trial. JACC Cardiovasc. Imaging. 2017;10(1):15–25.
- Friedewald VE, Bonow RO, Borer JS, et al. The editor's roundtable: cardiac valve surgery. Am J Cardiol. 2007;99(9):1269–1278.
- Bradley SM. Aortic valve insufficiency in the teenager and young adult: the role of prosthetic valve replacement. World J Pediatr Congenit Heart Surg. 2013;4(4):397–402.
- Kostyunin AE, Yuzhalin AE, Rezvova MA, et al. Degeneration of bioprosthetic heart valves: Update 2020. J. Am. Heart Assoc. 2020;9:1–19.
- Nishimura RA, Otto CM, Bonow RO, et al. 2014 AHA/ACC guideline for the management of patients with valvular heart disease: a report of the American college of cardiology/American heart association task force on practice guidelines. J. Am. Coll. Cardiol. 2014;63:e57–e185.
- Rotman OM, Kovarovic B, Chiu WC, et al. Novel polymeric valve for transcatheter aortic valve replacement applications: in vitro hemodynamic study. Ann Biomed Eng. 2019;47(1):113–125.
- Claiborne TE, Sheriff J, Kuetting M, et al. In vitro evaluation of a novel hemodynamically optimized trileaflet polymeric prosthetic heart valve. J Biomech Eng. 2013;135(2):021021.
- International Organisation for Standardisation, ISO 5840:2021 Part 1: General requirements, 2021.
- International Organisation for Standardisation, ISO 5840:2021 Part 2: Surgically implanted heart valve substitutes, 2021.
- International Organisation for Standardisation, ISO 5840:2021 Part 3: Heart valve substitutes implanted by transcatheter techniques, 2021.
- Rahmani B, Tzamtzis S, Sheridan R, et al. In vitro hydrodynamic assessment of a new transcatheter heart valve concept (the TRISKELE). J Cardiovasc Transl Res. 2017;10(2):104–115.
- Rahmani B, Tzamtzis S, Ghanbari H, et al. Manufacturing and hydrodynamic assessment of a novel aortic valve made of a new nanocomposite polymer. J. Biomech. 2012;45(7):1205–1211.
- Kandail HS, Trivedi SD, Shaikh AC, et al. Impact of annular and supra-annular CoreValve deployment locations on aortic and coronary artery hemodynamics. J. Mech. Behav. Biomed. Mater. 2018;86:131–142.
- Mao W, Li K, Sun W. Fluid-structure interaction study of transcatheter aortic valve dynamics using smoothed particle hydrodynamics. Cardiovasc Eng Technol. 2016;7(4):374–388.
- Gharaie SH, Morsi Y. A novel design of a polymeric aortic valve. Int J Artif Organs. 2015;38(5):259–270.
- Claiborne TE, Xenos M, Sheriff J, et al. Toward optimization of a novel trileaflet polymeric prosthetic heart valve via device thrombogenicity emulation. Asaio J. 2013;59(3):275–283.
- Dwyer HA, Matthews PB, Azadani A, et al. Computational fluid dynamics simulation of transcatheter aortic valve degeneration⋆⋆⋆. Interact Cardiovasc Thorac Surg. 2009;9(2):301–308.
- Ge L, Leo HL, Sotiropoulos F, et al. Flow in a mechanical bileaflet heart valve at laminar and near-peak systole flow rates: CFD simulations and experiments. J Biomech Eng. 2005;127(5):782–797.
- Bluestein D, Rambod E, Gharib M. Vortex shedding as a mechanism for free emboli formation in mechanical heart valves. J Biomech Eng. 2000;122(2):125–134.
- Arcidiacono G, Corvi A, Severi T. Functional analysis of bioprosthetic heart valves. J Biomech. 2005;38(7):1483–1490.
- Li K, Sun W. Simulated thin pericardial bioprosthetic valve leaflet deformation under static pressure-only loading conditions: Implications for percutaneous valves. Ann Biomed Eng. 2010;38(8):2690–2701.
- Kim H, Lu J, Sacks MS, et al. Dynamic simulation of bioprosthetic heart valves using a stress resultant shell model. Ann Biomed Eng. 2008;36(2):262–275.
- Serrani M, Brubert J, Stasiak J, et al. A computational tool for the microstructure optimization of a polymeric heart valve prosthesis. J. Biomech. Eng. 2016;138(6):061001.
- Smuts AN, Blaine DC, Scheffer C, et al. Application of finite element analysis to the design of tissue leaflets for a percutaneous aortic valve. J Mech Behav Biomed Mater. 2011;4(1):85–98.
- Li K, Sun W. Simulated transcatheter aortic valve deformation: a parametric study on the impact of leaflet geometry on valve peak stress. Int J Numer Method Biomed Eng. 2017;33:1–14.
- Burriesci G, Marincola FC, Zervides C. Design of a novel polymeric heart valve. J Med Eng Technol. 2010;34(1):7–22.
- Haj-Ali R, Dasi LP, Kim HS, et al. Structural simulations of prosthetic tri-leaflet aortic heart valves. J Biomech. 2008;41(7):1510–1519.
- What do you mean by aortic valve area: Geometric orifice area, effective orifice area, or Gorlin area?. 2006.
- Akins CW, Travis B, Yoganathan AP. Energy loss for evaluating heart valve performance. J Thorac Cardiovasc Surg. 2008;136(4):820–833.
- Baumgartner H, Falk V, Bax JJ, et al. 2017 ESC/EACTS Guidelines for the Management of Valvular Heart Disease. 2017;38:2739–2791.
- Gorlin R, Gorlin SG. Hydraulic formula for calculation of the area of the stenotic mitral valve, other cardiac valves, and Central circulatory shunts. I. Am Heart J. 1951;41(1):1–29.
- Baumgartner H, Hung J, Bermejo J, European Association of Echocardiography, et al. Echocardiographic assessment of valve stenosis: EAE/ASE recommendations for clinical practice. J Am Soc Echocardiogr. 2009;22(1):1–23.
- American Society for Testing and Materials, Standard Test Method for Tensile Properties of Thin Plastic Sheeting, ASTM International, ASTM D882-18, Stand. Test Method Tensile Prop. Thin Plast. Sheeting, ASTM Int. West Conshohocken, PA, 2018, www.astm.org 2018. 1–12.
- Xiong FL, Goetz WA, Chong CK, et al. Finite element investigation of stentless pericardial aortic valves: Relevance of leaflet geometry. Ann Biomed Eng. 2010;38(5):1908–1918.
- International Standard, Cardiovascular implants - cardiac valve prostheses. Part 2: Surgically implanted heart valve substitutes, 44 2015. 55p.
- Rotman OM, Bianchi M, Ghosh RP, et al. Principles of TAVR valve design, modelling, and testing. Expert Rev Med Devices. 2018;15(11):771–791.
- Luraghi G, Wu W, Gaetano FD, et al. Evaluation of an aortic valve prosthesis: Fluid-structure interaction or structural simulation? J Biomech. 2017;58:45–51.