
Abstract
The balloon surface temperature (BST) should be monitored to ensure the success of the ablation procedure using the HotBalloonTM ablation catheter (HBC) in clinical settings. Therefore, we sought to develop a new HBC equipped with a surface temperature monitoring sensor. The BST was evaluated using a pseudo-tissue model and a thermocouple to imitate catheter insertion into the pulmonary vein. Thermo-fluid analysis with computer-aided engineering (CAE) was performed to analyse the temperature distribution in the catheter and the balloon. The CAE analysis reproduced the results from a pseudo-tissue model experiment and demonstrated that some fluid zones inside the catheter shaft had a nearly identical temperature as the BST during the liquid suction period. The pseudo-tissue model experiment confirmed that the temperature was almost the same between the balloon surface and the position of 5 mm inside the catheter shaft from the proximal end of the balloon. A thermocouple placed at 5 mm or 25 mm from the proximal end of the balloon within the catheter shaft showed an equivalent temperature result. This 5–25-mm distance is acceptable to set the BST monitoring sensor inside the catheter shaft, since the sensor can help accurately estimate the BST.
Introduction
The HotBalloonTM ablation catheter (HBC) system for pulmonary vein isolation has been clinically approved and used for the treatment of atrial fibrillation in Japan [Citation1–4]. By using a compliant balloon filled with a diluted contrast medium warmed at approximately 60 °C with a radio frequency electric current, it is possible to heat a wide range of pulmonary veins and perform ablation procedure safely within a short period. Ablating the pulmonary vein with heat conduction from the heated balloon is expected to reduce cardiac complications due to overheating, which is sometimes observed with a conventional radiofrequency ablation catheter [Citation5]. Additionally, the balloon diameter can be adjusted by changing the injected fluid volume so that it can make close contact with the pulmonary vein depending on its diameter.
Conventional HBC systems are equipped with sensors to monitor the temperature of the fluid at the coil electrode inside the balloon. However, the temperature of the balloon surface that contacts the target tissue cannot be monitored using the conventional system. The lack of an index such as the ablation temperature during energy delivery might cause inadequate lesion formation.
Therefore, real-time monitoring of the surface temperature of the HBC system has been a sought-after feature from clinical sites. Using periodic injections and suction flow from the catheter shaft, the intra-balloon fluid was agitated to get a uniform BST distribution. Considering this mechanism, we posited a hypothesis that there were some fluid zones inside the catheter whose temperatures were nearly the same as the BST and sought to develop a new HBC system equipped with a balloon surface temperature (BST) monitoring sensor inside the catheter. We also aimed to investigate how and where the surface temperature monitoring sensor could be installed in the catheter.
Materials and methods
Measurement of the balloon surface temperature with a polyacrylamide gel pseudo-tissue model
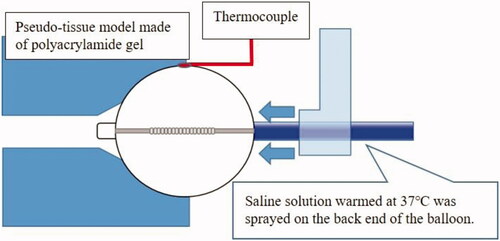
The balloon was inflated with 10 mL of a diluted contrast medium (Iopamiron 300; Bayer Yakuhin, Ltd, Osaka, Japan), warmed to the coil electrode setting temperature of 70 °C, and wedged in close contact with the polyacrylamide pseudo-tissue placed in a water bath controlled at 37 °C. Subsequently, a temperature sensor (T-type thermocouple) was placed between the outer surface of the balloon and the pseudo-tissue. The pseudo-tissue was prepared from water (89 wt%), NaCl (1 wt%), and acrylamide (8 wt%). The pseudo-tissue had good transparency that allowed the observation of the contact point of the balloon. The electrical properties of the pseudo-tissue could be adjusted to mimic the properties of biological tissues by adding an appropriate amount of ionic material such as NaCl [Citation6]. To imitate the pulmonary vein, a hole with a diameter of 26 mm was made in the pseudo-tissue. Considering the cooling effect due to the blood flow in the left atrium in the clinical setting, saline solution warmed to 37 °C was sprayed on the back end of the balloon at a flow rate of 2 L/min. A schematic diagram is shown in . The testing was performed at the laboratories of Toray Industries, Inc., Japan.
Figure 1. Schematic diagram showing measurement of the balloon surface temperature in a pseudo-tissue model.
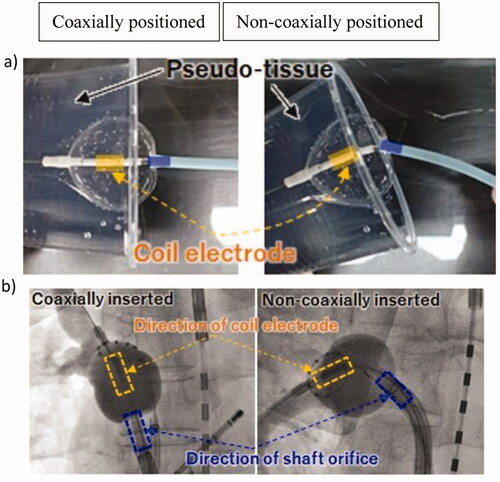
To evaluate the difference in the BST depending on the balloon positioning coaxially or non-coaxially inserted, we wedged the balloon catheter closely to the pseudo-tissue, as shown in .
Figure 2. Different positionings of the balloon catheter. Coaxial position: the direction of the coil electrode within the balloon is the same as that of the catheter shaft. (a) Experiment with the pseudo-tissue model, (b) fluoroscopic radiographic image of two cases of coaxial and non-coaxial insertion observed in clinical settings.
Intra-balloon thermo-fluid analysis with computer-aided engineering
Computer-aided engineering (CAE) is a design technology that allows performing satisfactory virtual trial production using a computer from the initial stage of product development and is expected to help develop high-quality products with a minimum number of trial productions [Citation7]. Thermo-fluid analysis was performed to visualise the flow and the temperature inside of the balloon using the finite element method for CAE. The parameters for CAE analysis were set such that the same conditions as in the experiment with a pseudo-tissue model could be obtained (). The CAE analysis was performed at the laboratories of Toray Industries, Inc., Japan.
Table 1. Parameters set for computer-aided engineering analysis of the HotBalloonTM ablation catheter.
Results
Balloon surface temperature in the pseudo-tissue model
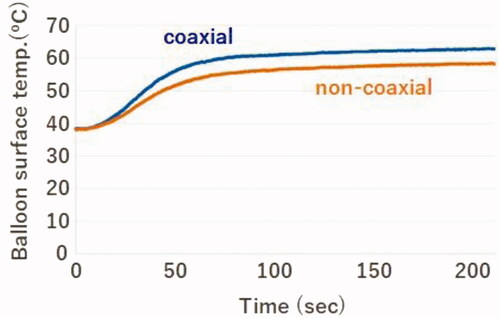
The BST measured using the temperature sensor placed between the outer surface of the balloon and pseudo-tissue was different depending on the positioning of the catheter. It was approximately 5 °C lower than the coaxial position over time when the balloon was positioned non-coaxially ().
Figure 3. Difference in the balloon surface temperature depending on the balloon insertion positioning.
Intra-balloon thermo-fluid analysis with computer-aided engineering
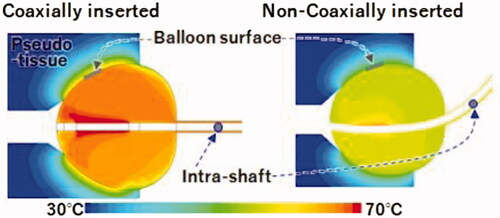
As illustrated in , the BST was affected by the catheter positioning. The BST was approximately 65 °C when coaxially inserted and approximately 60 °C when non-coaxially inserted. It was approximately 5 °C lower when inserted non-coaxially than when inserted coaxially. The CAE analysis reproduced the results () obtained using a pseudo-tissue model. Additionally, the temperature around the balloon surface in contact with the pseudo-tissue was nearly homogeneous in each case despite the different positions of inserting the HBC ().
Figure 4. Temperature distribution in the pseudo-tissue model inside the balloon and inside the shaft with computer-aided engineering analysis. Yellow indicates a higher temperature area than green.
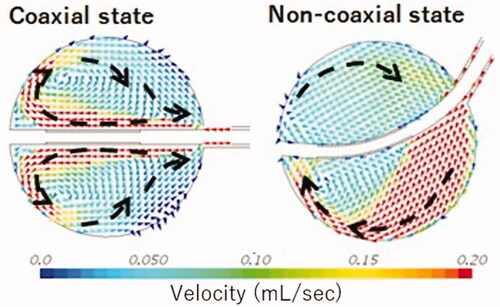
As illustrated in , the intra-balloon fluid flow analysed using CAE was different between the two cases of balloon positioning. In the non-coaxial case, it was assumed that the fluid warmed adjacent to the electrode could not be supplied to the balloon’s inner surface efficiently because of the swirl flow along the balloon shape by the injection from the catheter shaft. Thus, the warmed fluid tended to remain near the electrode. However, in the coaxial case, it was assumed that the fluid warmed adjacent to the electrode could be removed efficiently to cool the electrode and provide a sufficient radio frequency output. This difference was indicated to cause a lower BST in the case non-coaxially inserted cases than in the coaxially inserted cases.
Figure 5. Intra-balloon fluid flow analysis with computer-aided engineering. The fluid flow velocity becomes high following the colour changes from blue to red. The black arrow indicates the direction of the intra-balloon fluid flow. The dotted line indicates broad fluid flow.
Computer-aided engineering findings of the position of the temperature monitoring sensor inside the catheter shaft
The fluid inside the balloon was warmed by Joule heating adjacent to the coil electrode by radiofrequency conduction. A temperature sensor attached to the proximal end of the coil electrode automatically controlled the radiofrequency current output such that the coil electrode temperature reached the target temperature. The intra-balloon fluid was agitated by periodic injections and suction flow from the catheter shaft to realise a uniform temperature distribution inside the balloon. Based on the results of temperature distribution analysis (), in the coaxially inserted case, the maximum BST and maximum intra-shaft temperature were 64.6 and 66.2 °C, respectively, and the difference between the two was 1.6 °C. In the non-coaxially inserted case, the maximum BST and maximum intra-shaft temperature were 58.1 and 59.2 °C, respectively, and the difference between the two was 1.1 °C. Thus, the temperature inside the catheter shaft was almost the same as inside the BST.
Positioning of the temperature monitoring sensor placed inside the catheter shaft in the pseudo-tissue model
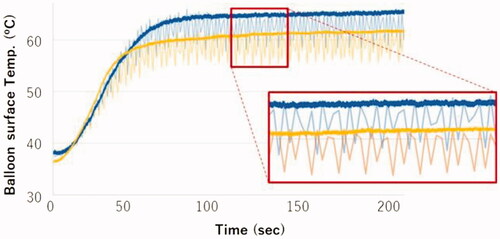
The BST monitoring sensor was placed 5 mm from the proximal end of the balloon inside the catheter shaft. The temperature inside the catheter shaft was higher in the coaxial position than in the non-coaxial position (), which gave the same results as shown in . The temperature inside the catheter shaft varied synchronously with the injection and suction cycles of the fluid. suggests that the BST could be precisely monitored by measuring the maximum fluid temperature during the suction period inside the catheter shaft. The maximum temperatures of the balloon surface and inside of the catheter shaft were 62.5 and 63.0 °C, respectively, in the coaxially inserted case. Thus, the maximum temperatures at the balloon surface and inside the catheter shaft were nearly identical.
Figure 6. Temperature inside the catheter shaft and at the balloon surface in the coaxial and non-coaxial positions.
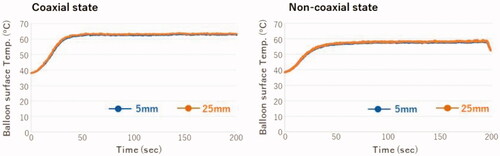
Based on the calculation of the flow volume (approximately 0.4 mL) during the injection and suction cycle between the balloon and catheter shaft (cross-section area, 4.8 mm2), we estimated that the intra-balloon fluid could be pulled back to 100 mm inside the catheter shaft from the proximal end of the balloon. The temperature inside the catheter shaft was evaluated in two cases: coaxial and non-coaxially inserted condition. The temperature sensor was placed 5 or 25 mm from the proximal end of the balloon. As shown in , the temperature was the same in both positions, not only in the coaxially inserted condition but also in the non-coaxial inserted condition. This finding suggested that a surface temperature monitoring sensor could be placed 5–25 mm from the proximal end of the balloon inside the catheter shaft.
Figure 7. Temperature inside the catheter shaft at a 5 or 25 mm distance from the proximal end of the balloon.
Discussion
We developed a new HBC that was enhanced using a BST monitoring sensor within a catheter shaft. The CAE analysis reproduced the results obtained from the experiment using a pseudo-tissue model. Based on these results, we determined an adequate position to set the BST monitoring sensor inside the catheter shaft that indicated the same temperature as the BST.
Recently, useful clinical evaluation data have been reported using this newly developed HBC [Citation8]. The following new findings were obtained after using the HBC in 30 patients: (1) the mean BST at the documentation of pulmonary vein isolation (PVI) was 49.4 °C, (b) median BST and time-to-isolation (TTI) were shown to be predictors for PVI attempted by the single‐shot technique, and (c) a median BST cut-off value of >58.7 °C and a TTI of 30.0 sec was predictive of the achievement of HBC ablation-based PVI. To identify the clinical benefits of the BST monitoring model, the aforementioned study compared the patient characteristics and procedural parameters between the 30 patients in this new BST monitoring model cohort and 88 consecutive patients in the old non‐BST monitoring model. After propensity score matching, 28 patients’ pairs were created. Patient characteristics did not differ significantly between the groups. However, the BST monitoring group had a significantly shorter procedure and ablation times, lower touch-up rates, and significantly higher single-shot PVI success rates than the non-BST monitoring group. As a result of BST monitoring in real-time with this newly developed HBC, higher single-shot PVI success rates became possible. It was also suggested that the HBC was likely to help avoid excessive energy application and prevent pulmonary vein stenosis and phrenic nerve injury in the chronic phase by setting the ablation time based on the TTI and median BST. These clinical findings prove that the pseudo-tissue model and CAE analysis we used are adequate methods to verify the surface temperature of the HBC, and the newly developed BST monitoring model of the HBC may improve the existing clinical procedure and efficacy.
Limitation
The cooling effect of the tissue by capillaries was not taken into consideration in detail when evaluating the device using the pseudo-tissue model. Therefore, the conditions may be different from the actual clinical conditions. Therefore, it may be necessary to carry out animal experiments that imitate clinical conditions.
Conclusions
The BST monitoring sensor placed at 5–25 mm from the proximal end of the balloon within the catheter shaft can help accurately measure the BST. The usefulness of this newly developed catheter has been demonstrated in clinical applications.
Acknowledgements
We would like to express our greatest appreciation to Shutaro Satake, an inventor of the HBC. The authors also want to thank Hisataka Shoji and Editage for providing medical writing support.
Disclosure statement
K.T., A.T., H.H., and M.T. are employees of Toray Industries, Inc., and H.S. received remuneration from Toray Industries, Inc.
Data availability statement
Participant data will not be shared.
References
- Wakamatsu Y, Nakahara S, Nagashima K, et al. Hot balloon versus cryoballoon ablation for persistent atrial fibrillation: lesion area, efficacy, and safety. J Cardiovasc Electrophysiol. 2020;31(9):2310–2318.
- Yamasaki H, Aonuma K, Shinoda Y, et al. Initial result of antrum pulmonary vein isolation using the radiofrequency hot-balloon catheter with single-shot technique. JACC Clin Electrophysiol. 2019;5(3):354–363.
- Yoshida Y, Yamane T, Nakahara S, HotBalloon PMS Study Investigators, et al. Efficacy and safety of SATAKE HotBalloon® catheter for treatment of paroxysmal atrial fibrillation -a post-marketing surveillance study. Circ J. 2021;85(8):1314–1320.
- Chikata A, Kato T, Usuda K, et al. Optimization of the hot balloon ablation strategy using real‐time pulmonary vein potential monitoring. J Cardiovasc Electrophysiol. 2020;31(1):163–173.
- Nakagawa H, Yamanashi WS, Pitha JV, et al. Comparison of in vivo tissue temperature profile and lesion geometry for radiofrequency ablation with a saline-irrigated electrode versus temperature control in a canine thigh muscle preparation. Circulation. 1995;91(8):2264–2273.
- Hoshina S, Miyakawa M. A method for observing the heated region in a three-dimensional way by use of high molecular gel phantoms – phantoms made of gellan gum and polyacrylamide gel. Jpn J Hyperthermic Oncol. 1993;9(1):31–39.
- Dou K, Lordan E, Zhang YJ, et al. A complete computer aided engineering (CAE) modelling and optimization of high pressure die casting (HPDC) process. J Manuf Process. 2020;60:435–446.
- Nakahara S, Wakamatsu Y, Fukuda R, et al. Utility of hot-balloon-based pulmonary vein isolation under balloon surface temperature monitoring: first clinical experience. J Cardiovasc Electrophysiol. 2021;32(10):2625–2635.