
Abstract
An exploratory study was performed to determine the distribution of surgical smoke particulate matter (SSPM) and evacuation times within an AirSeal® System and a traditional insufflation access system in various simulated surgical scenarios. Identified trends showed statistical significance when setting the AirSeal® System to Low smoke evacuation that it reduces the percentage of particulate matter at the Access Port opening. Additionally, it was observed that when utilising a laparoscopic tool a similar trend in particle distributions were seen between either insufflation and access system at the opening of the Access Port and trocar. Evacuation times for SSPM removal within the AirSeal® System showed an overall average to ≥95% reduction of 5.64 min within the surgical cavity, 3.69 min at the Access Port opening, and 3.61 min within the smoke evacuation line. The overall average for the traditional insufflation and access system was 9.38 min within the surgical cavity and 6.06 min at the trocar opening. Results showed that when using the traditional system compared to the AirSeal® System, it resulted in a percent change increase in evacuation times of 66.31% within the surgical cavity and 64.23% at the trocar opening.
1. Introduction
Laparoscopic surgery is a minimally invasive procedure that allows for surgical procedures, diagnostic or therapeutic treatment, to be performed within the surgical cavity [Citation1]. This type of surgery requires small incisions to made through the abdominal wall to gain access to the surgical cavity and that the surgical cavity needs to be inflated with a gas to provide space for operating. Approximately 15 million laparoscopic procedures are performed each year, globally, and approximately 3.1–4.8 million procedures are performed each year within the U.S. [Citation2,Citation3].
These laparoscopic procedures require various types of equipment to gain access and interact with the surgical cavity [Citation4]. To gain access and provide interaction with the surgical cavity, an insufflation system, trocar, laparoscope and visualisation system, and laparoscopic surgical instruments are required [Citation4]. These pieces of equipment allow for a working space within the cavity to be generated, instruments and other equipment to be passed through the abdominal wall, and visualisation inside the surgical cavity to perform procedures.
During surgery, it is common that frequent cauterisation events will take place on tissue structures for hemostasis. When cauterisation occurs, it generates surgical smoke that is composed of 95% water vapour and 5% biological components in the form of particulate matter [Citation5–7], which is referred to as surgical smoke particulate matter (SSPM). These biological components, which include tissue fragments and blood cells, potential viruses and bacteria, and chemicals, then become aerosolized and can travel/disperse within the surgical cavity.
Due to the type of equipment used, there are concerns about SSPM being able to escape the surgical cavity and interact with operating room (OR) personnel or the patient. This interaction can occur due to the trocar(s), insufflation system used, and the process of instrumentation insertion and removal. The trocar(s) provide access to the surgical cavity, and therefore a path for SSPM to escape the surgical cavity around and through these trocars. In addition, the insufflation system creates a pressurised cavity, referred to as pneumoperitoneum, that generates a pressure gradient between the surgical cavity and the OR.
These SSPM’s are of a concern because they can have particle diameters in the range of 0.01–10 µm [Citation6–10], which can travel and be deposited in the respiratory system, with ultrafine particle diameters, below 0.1 µm, being able to be deposited in the small peripheral airways and alveoli [Citation8,Citation10–12]. These particles, if deposited within the respiratory system, can cause adverse respiratory, cardiovascular, and gastrointestinal effects, infection, potential carcinoma, dizziness, headaches, and irritation to the eyes and skin, along with many other concerns [Citation10,Citation11,Citation13–16].
Based on the concern and safety for SSPM exposure to OR personnel and the patient, an exploratory study was performed to determine the distribution of SSPM within an AirSeal® System and how it compares to a traditional laparoscopic insufflation and access system. Additionally, the study evaluated the evacuation time of SSPM from within the system, the effect a suction assist system would have on SSPM distribution and evacuation times, along with the impact of inserted laparoscopic tools within either system. Testing was performed with the use of a simulated laparoscopic test cavity, ex vivo tissue, high (15 mmHg) and low (8 mmHg) pneumoperitoneum, High and Low smoke evacuation rates (SER), with and without the use of a suction assist system (SAS), and with laparoscopic surgical instruments to replicate various surgical scenarios.
2. Materials and methods
2.1. Simulated laparoscopic cavity
To determine the distribution of SSPM within the AirSeal® System (AS) and traditional insufflation and access system (TIAS), a simulated laparoscopic cavity (SLC) was developed, and ; the TIAS used the AirSeal® iFS in standard insufflation mode with a traditional trocar for testing. The simulated laparoscopic cavity was constructed with five clear rigid sides, made with 13 mm thick acrylic sheets, and a compliant clear surface, made with 4-gauge (0.01 mm) thick Polyvinyl Chloride film.
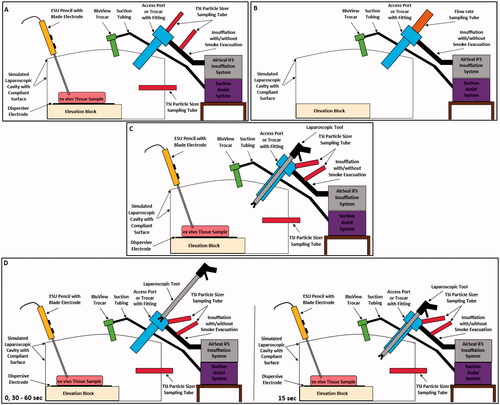
Figure 1. Schematics of the various test setups used for particle and flow measurements. (A) Simulated laparoscopic cavity with the equipment surface layout, (B) Simulated laparoscopic cavity test setup for standardised flow rate measurement, (C) Test setup for testing with a laparoscopic tool fixed within the Access Port or trocar, and (D) Step through of the laparoscopic tool position during automated insertion and removal through the Access Port or trocar. Schematic shows the tool position at 0 and 30–60 s, and at 15 s.
The SLC has an internal volume of approximately four Litres when inflated, causing the compliant surface to create a dome shape; the cavity has an internal volume of 4.68 Litres with dimensions of 264.60 × 180.00 × 98.30 mm when not inflated. Additionally, the internal volume is decreased with the use of an elevation block, to provide easier interactions with tissue, causing the uninflated volume to decrease to 3.79 Litres.
The compliant surface of the SLC also allowed for clamping rings with flexible silicone inserts to be used to provide reusable ports for laparoscopic surgical equipment. These ports were used to provide insufflation, surgical smoke generation, access to cavity, and allowed for the use of an SAS, and . The use of clear rigid walls, compliant surface, reusable ports, and a comparative internal volume [Citation17] allowed for the laparoscopic surgical abdominal cavity to be simulated, while maintaining a controlled test environment with high visibility.
2.2. Surgical smoke generation and tissue source
To generate surgical smoke within the SLC, an electrosurgical unit (ESU), blade electrode, and reusable dispersive electrode was utilised. A CONMED System 5000™ ESU set to 40 W in pure cut mode, GoldLine® electrosurgical pencil with six-inch GoldVac™ UltraClean® blade, and stainless-steel dispersive electrode were specifically used to apply monopolar radiofrequency (RF) energy for surgical smoke generation.
The electrosurgical pencil with six-inch blade electrode was used as it provided enough length to contact and distribute monopolar RF energy to the tissue, and allowed for easy manipulation of the blade and RF energy activation compared to traditional laparoscopic tools used for cauterisation within a surgical cavity.
Additionally, ex vivo porcine tissue [Citation16], specifically USDA pork chop, was used as an analogous tissue to generate surgical smoke. Even though this specific porcine tissue is not located within the abdominal cavity, it was used since it provided a balance of adipose and skeletal muscle, generated SSPM in high concentrations within the entire particle diameter range of the particle measurement system used for testing, and was readily available for testing. Since the main end point for this study was to determine the distribution of SSPM within either insufflation system, this tissue source was found to be acceptable since it provided the range of particle diameters and concentration amounts needed for testing and analysis.
2.3. Insufflation and access systems
Insufflation and access systems (IAS) used to perform the particle distribution testing required the AirSeal® iFS, 12 mm AirSeal® Access Port, AirSeal® Tri-Lumen Filtered Tube Set, Applied Medical 12 mm Z-Thread Kii Shielded Bladed trocar, Single-Lumen Filtered Tube Set, and medical grade CO2.
For testing with the AS, the AirSeal® iFS, 12 mm AirSeal® Access Port, and AirSeal® Tri-Lumen Filtered Tube Set were required, and when testing with the TIAS, the AirSeal® iFS, Applied Medical 12 mm Z-Thread Kii Shielded Bladed trocar, and Single Lumen Filtered tube set were required. When using either insufflation and access system, the 12 mm Access Port and Trocar were chosen since they provide the potential for a worst-case scenario for SSPM concentrations at the opening of either device due to their increased cross-sectional area.
These two IAS were chosen since they provided two distinctly different test setups for providing insufflation during laparoscopic surgery. The TIAS only provides insufflation for pneumoperitoneum without smoke evacuation and a valved trocar to access the surgical cavity. Whereas the AS provides insufflation, along with constant surgical smoke evacuation and filtration, and utilises a valve-less trocar (Access Port) design that allows for frictionless insertion and removal of tools and specimens while maintaining constant pneumoperitoneum. This valve-less design is generated through high-pressure jets creating a gas barrier near the opening of the Access Port.
Due to the design of the AS, it relies on three mass flow rate equilibrium locations to provide insufflation, surgical smoke evacuation, and pneumoperitoneum. The first equilibrium is located within the Access Port at the gas pressure barrier. The second equilibrium occurs within the SLC/surgical cavity in order to provide stable pneumoperitoneum and constant surgical smoke evacuation. When surgical smoke is removed from the cavity it is replaced with an equal amount of CO2 to replace the volume loss, thus creating an equilibrium state. The third equilibrium occurs at the opening of the Access Port and with the external environment to provide whole system equilibrium. This equilibrium balances the flow of gas travelling within the cannula portion of the Access Port. Since equilibriums one and two are previously established, equilibrium three allows for the flow through the cannula to be balanced, through outward gas flow. This outward gas flow was measured to determine the volumetric gas flow rate at different AirSeal® iFS settings and with the addition of an SAS, and is evaluated within this study.
2.4. Suction assist system
The SAS used in this study utilised a Plume Port ActiV®, CONMED 5 mm BluView™ trocar, and a Buffalo Filter® ViroVac®. When utilising the previous equipment, with the Plume Port ActiV® set to three and the ViroVac® set to high, a four Liter/min (LPM) suction was generated.
2.5. Laparoscopic surgical tools and automated tool insertion and removal
Laparoscopic surgical tools used within this study were the 12 mm Endo GIA™ Ultra Universal Stapler with 60 mm loading unit and 10 mm CONMED Reflex® ELC530 clip applier. These tools were used since they provided a maximum diameter size tool for insertion in to either the 12 mm Access Port or trocar and a smaller tool size that is commonly used with a 12 mm Access Port or trocar.
For inserting and removing either tool for both test setups, an automated test setup was used to eliminate user error and provide consistent insertion and removal times, and . To automate the process, a Mark − 10 linear actuator, model ESM303, and attachment fixation device were used to provide insertion and removal of the 12 mm and 10 mm tools.
2.6. SSPM measurement and test fixtures
Measurement of SSPM was performed with the use of three TSI NanoScan Scanning Mobility Particle Sizer (SMPS), model 3910, and sample collection tubing, TSI Conductive 1 m tubing (SKU: 801688), to determine the concentration and particle diameters present during surgical smoke generation within either IAS. The particles sizers were chosen since they can measure particle diameters from 0.01 to 0.42 µm, the concentration of each diameter present, and can accommodate concentrations up to 1 × 10⁶ particles/cm3 every second within a 60 s scan. The particle sizers are cable of taking sample measurements every second but can only measure one diameter in this setting, therefore to capture particles across the entire range, a 60 s scan of each sample is required.
These particle sizers (PS) were used to capture SSPM within the SLC, at the opening of the Access Port and trocar, and within the smoke evacuation line of the Tri-Lumen tube set. In order to measure the size and amount of SSPM within the SLC, the sample collection tubing was placed within the cavity below and behind the Access Port or trocar placement, and centred to the ex vivo tissue sample, .
To collect from the other two locations, four additional fixtures were developed to allow for SSPM measurements without impeding the performance and functions of the AirSeal® iFS and Access Port/trocar. For measurements at the opening of the Access Port or trocar without the use of laparoscopic tools, a compression funnel fitting was developed to contain any SSPM from being vented or escaping and directed to the PS, .
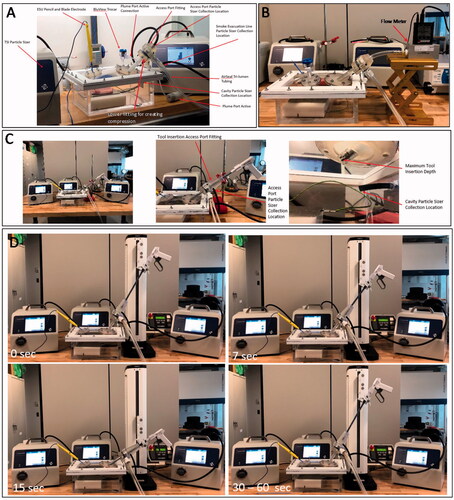
Figure 2. (A) Image showing the simulated laparoscopic cavity with the equipment surface layout, (B) Simulated laparoscopic cavity test setup for standardised flow rate measurement, (C) Test setup for testing with a laparoscopic tool fixed within the Access Port or trocar, and (D) Step through of the laparoscopic tool position during automated insertion and removal through the Access Port or trocar.
The fixture used for capturing particles at the opening with laparoscopic tools used a similar funnel design but with an extended overall height, re-orientation of the sample collection tubing, and the use of a low friction slip fitting design for tool manipulation, . The extended height allows for the laparoscopic tool to be inserted and removed from the Access Port/trocar while still being contained within the fitting to prevent SSPM lose and outside airborne particles from entering the PS. Additionally, the slip fitting allows for manipulation of the tool while maintaining centre alignment of the tool within the Access Port/trocar during insertion and removal.
Lastly, to measure SSPM within the smoke evacuation line of the Tri-Lumen tube set, a syphon fitting, within internal pitot tube design, was developed for SSPM collection, . This design allows for SSPM to be directed to the PS without impeding the performance of the AirSeal® iFS.
2.7. SSPM distribution test methods
To determine the SSPM distribution within either IAS in various clinical scenarios, four test setups at various AirSeal® iFS settings were performed. A sample size of five (N = 5), performed on one ex vivo tissue sample, was used to determine the distribution of SSPM within each test setup at each AirSeal® iFS setting; all test setups used an AirSeal iFS insufflation setting of 20 L/min for initial cavity pressurisation.
The first test setup, and , was used to determine the flow rate at the top of the Access Port at different AirSeal® iFS settings to provide a relationship to the amount of SSPM present during the different clinical scenario test setups. Test setup one used only the SLC and AS equipment, with and without the addition of the SAS, and an AliCat Whisper Flow Rate Metre (MW-40SLPM) to measure the standardised flow rate of CO2 at the opening of the Access Port without the use of laparoscopic tools. Flow rate testing was only performed with the AS due to the active exchange or outward flow of gas that is only present with the Access Port and not when using a trocar without any laparoscopic tools.
Flow rate measurements used one sample taken for 100 s with AirSeal® iFS settings at 15 and 8 mmHg with High and Low SER, and with and without the use of an SAS to provide representative data of what flow rate is present when the AS is used without any tool interactions.
Test setup two used the SLC, both IAS, all three PS (only two PS when testing with the TIAS), fixtures for PS to interface with equipment, and SAS to establish baseline test results. Baseline testing was not performed when using the TIAS without a suction assist as no valuable results could be achieved. When using the TIAS, without any suction assist or tool insertion/removal, the cavity is pressurised and the valve(s) within the trocar are unbroken creating a sealed cavity with no route for gas or SSPM to travel.
Baseline particle distribution results were collected by performing the following steps:
Set AirSeal® iFS settings and wait until steady state is reached.
Activate SAS, if applicable.
Set the PS to scan and sample for 15 mins, allowing for fifteen 60 sec scans to be performed.
Create one 5 sec incision, approximately 40 mm in length, at the start of PS collection.
The 5 sec incision is initiated when the PS collection timer reads one second, Tinitial = 1 second, and terminates when the PS collection timer reads six seconds, Tterminate = 6 seconds. After PS collection is complete, repeat steps until sample size is reached.
Discard ex vivo tissue sample and prepare next test setup.
Lastly, test setups three and four used the SLC, both IAS, all three PS (only two PS when testing with the TIAS), 12 and 10 mm laparoscopic tools, fixtures for PS and tools to interface with equipment, and SAS to provide simulated clinical scenario test results. Laparoscopic tools were either inserted into the Access Port or trocar and remained fixed for the duration of testing, test setup three, or they were actively inserted and removed through the Access Port or trocar using the Mark − 10 linear actuator, test setup four.
For either test setup, the tools were inserted past the gas barrier of the Access Port or both valves of the trocar until they reached the distal end of either device. Tools were inserted to the end of either device to ensure interference with the sealing mechanism of each device. Additionally, when tools were removed during the active insertion and removal testing, they were removed until they were past the collection point of the PS tubing and remained there, contained within the PS test fixture, until the next cycle began, see and .
Fixed tool insertion particle distribution results were collected by performing the following steps:
Set AirSeal® iFS settings and wait until steady state is reached.
Activate SAS, if applicable.
Set the PS to scan and sample for 15 mins, allowing for fifteen 60 sec scans to be performed.
Insert tool into fixed position within Access Port or Trocar
Create one 5 sec incision, approximately 40 mm in length, at the start of PS collection.
The 5 sec incision is initiated when the PS collection timer reads one second, Tinitial = 1 second, and terminates when the PS collection timer reads six seconds, Tterminate = 6 seconds.
After PS collection is complete, repeat steps until sample size is reached.
Discard ex vivo tissue sample and prepare next test setup.
Automated tool insertion and removal particle distribution results were collected by performing the following steps:
Set AirSeal® iFS settings and wait until steady state is reached.
Activate SAS, if applicable.
Set the PS to scan and sample for 15 mins, allowing for fifteen 60 sec scans to be performed.
Place tool into Mark – 10 fixation device and start Mark – 10.
Set Mark – 10 to perform a cycle consisting of a 30 insertion and removal time (15 sec in each direction) with a 30 sec dwell time after removal of tool to align with the 60 sec sample scan of the PS. This cycle will then repeat 15 times to allow for one tool insertion and removal for each PS scan.
Create one 5 sec incision, approximately 40 mm in length, at the start of PS collection.
The 5 sec incision is initiated when the PS collection timer reads one second, Tinitial = 1 second, and terminates when the PS collection timer reads six seconds, Tterminate = 6 seconds. After PS collection is complete, repeat steps until sample size is reached.
Discard ex vivo tissue sample and prepare next test setup.
2.8. Statistical analysis method
Statistical analysis was performed with Mintab® and used sample means and standard deviations (SD) as inputs. Paired T-Tests were performed to evaluate whether a change was present in SSPM distribution when modifying AirSeal® iFS smoke evacuation rates or pressure, and with and without the use of an SAS. Statistical results were considered statistically significant with p ≤ 0.05.
3. Results
3.1. AirSeal flow rate
Standardised flow rate averages with SD, and flow rate vs time plots, with five-point moving averages, are shown in and . Results establish a baseline outward flow rate at the opening of the AirSeal® Access Port along with changes when utilising an SAS. Sample baseline (15 and 8 mmHg) averages show that a lower cavity pressure (8 mmHg) results in a reduction of flow rate and when reducing the AirSeal® iFS smoke evacuation rate from High to Low SER that an additional reduction in flow rate can be achieved. When reducing from High to Low SER at 15 mmHg there is a 2.25 L/min average reduction (%Δ of 65.79), and at 8 mmHg there is a 0.09 L/min average reduction (%Δ of 45.00). Additionally, when the SAS was active, the same trend with greater reductions in baseline flow rate were observed. At 15 mmHg, there was a reduction of 1.80 L/min (%Δ of 52.63) and 0.86 L/min (%Δ of 73.50) for High and Low smoke evacuation, respectively, and at 8 mmHg, there was a reduction of 1.50 L/min (%Δ of 75.00%) and 0.98 L/min (%Δ of 89.09) for High and Low smoke evacuation, respectively, when compared to the outward gas flow rate without an SAS.
Figure 3. Cross sectional schematics of the fittings used for flow rate and SSPM measurement with the particle sizers at the opening of the Access Port and trocar, with laparoscopic tool insertion, and from the smoke evacuation line of the tri-lumen tube set.
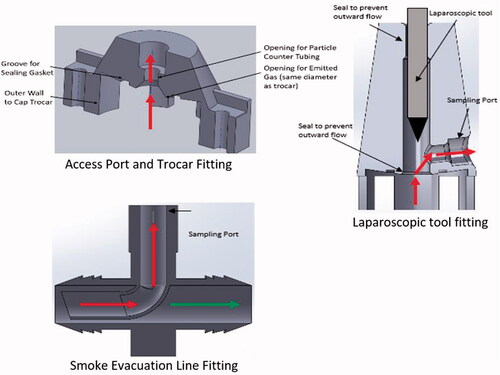
Table 1. Average AirSeal access port flow rates.
Baseline flow rate vs time plots show that a constant flow rate with minimal fluctuations was observed, with flow rate at 8 mmHg and High smoke evacuation having an increased amount of fluctuation. This increased fluctuation can be seen when comparing the coefficient of variation (CV) for each setting, 15 mmHg and High SER = 28.36, 15 mmHg and Low SER = 33.33, 8 mmHg and High SER = 44.50, and 8 mmHg and Low SER = 33.63. Time plots with the SAS active showed similar results when using High smoke evacuation rate for either pressure settings, but that flow rates when using Low smoke evacuation rate for either pressure showed a unique characteristic. When using the SAS at a Low smoke evacuation rate, the flow rate at the opening of the Access Ports shows two set phases with a negative flow rate, resulting in air flow into the SLC, followed by a positive, outward flow rate. This cycle resulted in CV’s for 15 mmHg at Low smoke evacuation of 351.61 and for 8mmhg at Low smoke evacuation of 741.67
3.2. Particle percent distribution and SSPM evacuation times
Results for the particle percent distributions, , , and , used cumulative sample averages with SD for analysis. This was performed by using the total particle concentration (# of particles/cm3) at each measurement location at the end of the 15 min collection time, summing the total of all three locations, and then determining the percentage that each measurement location represents to the total particle concentration measurement for each test setup. By using this method, we can determine the percent distribution of SSPM within either IAS, and the relative, cumulative SD at each measurement location.
Figure 4. Standardised flow rate graph showing the fluctuations of gas flow at the top of the Access Port with and without the suction assist device active. Graph utilises a 5-point moving average.
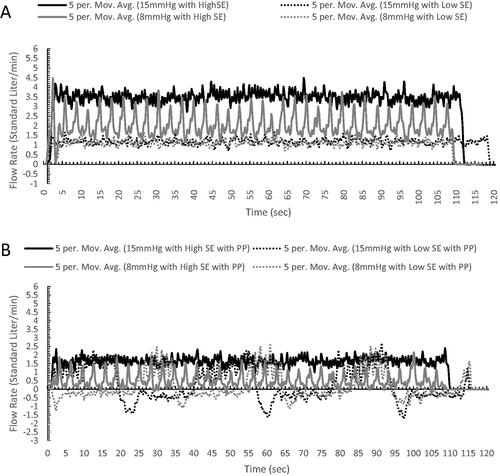
Figure 5. Bar graphs (A and B) show the cumulative particle % distribution over the 15 min measurement time and the table shows the time until ≥95% particle reduction from each measurement location when testing with the AirSeal® System at 15 mmHg. The cumulative particle % distribution totals for each test setup and measurement location are reached, at least 95% of the total, at the evacuation time shown in the table.
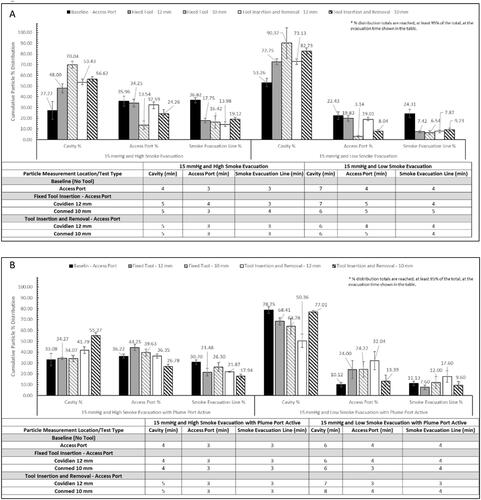
SSPM evacuation times, , , and , were calculated to determine the time it takes to reduce the SSPM concentration at each location to ≤95% of the total concentration. These results demonstrate the particle evacuation rates of either IAS, and the impact of an SAS for providing additional SSPM capture. Overall, the combined average, with and without an SAS and/or laparoscopic tools, for the AS was 5.64 min for the SLC, 3.69 min for the Access Port, and 3.61 min for the smoke evacuation line. The combined average for the TIAS was 9.38 min for the SLC and 6.06 min for the trocar. When using the TIAS compared to the AS, it resulted in a percent change increase in evacuation times of 66.31% within the SLC and 64.23% at the trocar opening.
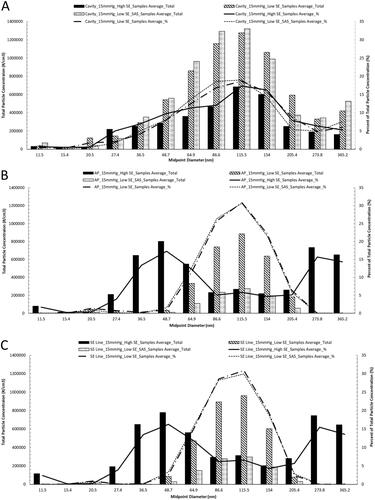
Lastly, particle concentration profile and percent distribution representative plots, , are used to provide a representation of the amount of particle concentrations at each measured particle diameter and the percentage each diameter represents; each diameter shown in the figure represents a midpoint and contains a range of particle diameters, see . Data shown within the representative plots uses results from baseline testing with the AS at 15 mmHg with High and Low SER, and at Low smoke evacuation rate with the SAS. These settings were chosen since they demonstrate the entire range of particle concentrations seen within the testing performed.
Figure 6. Bar graphs (A and B) show the cumulative particle % distribution over the 15 min measurement time and the table shows the time until ≥95% particle reduction from each measurement location when testing with the AirSeal® System at 8 mmHg. The cumulative particle % distribution totals for each test setup and measurement location are reached, at least 95% of the total, at the evacuation time shown in the table.
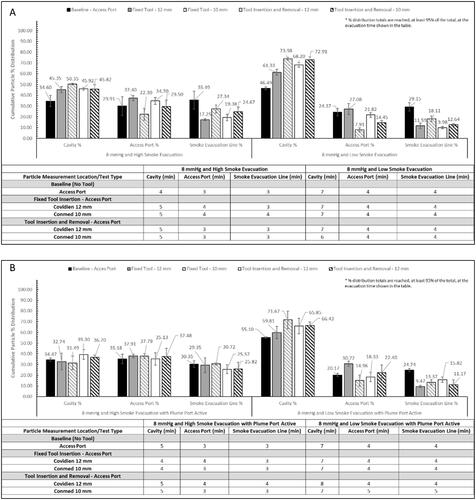
Table 2. Range of particle diameters associated with midpoint diameter.
3.3. Particle percent change distribution
After analysing the particle percent distribution results, the change in particle percent distribution, and , when going from High to Low smoke evacuation at either pressure, with and without the SAS, 15 to 8 mmHg, and from the 12 mm to 10 mm tool was analysed. Additionally, paired T-tests were performed to determine the statistical significance of each test setup adjustment and if the adjustment caused any significant change to SSPM concentrations. To note, not being statistically significant does not mean that the test setup was invalid, only that the adjustment did not make an impact on the SSPM concentrations at each location. Any test setup adjustments that were not statistically significant or had borderline significance, 0.05 ≥ p value ≥ 0.10, are noted on and .
Figure 7. Bar graphs (A and B) show the cumulative particle % distribution over the 15 min measurement time and the table shows the time until ≥95% particle reduction from each measurement location when testing with the traditional insufflation and access system. The cumulative particle % distribution totals for each test setup and measurement location are reached, at least 95% of the total, at the evacuation time shown in the table.
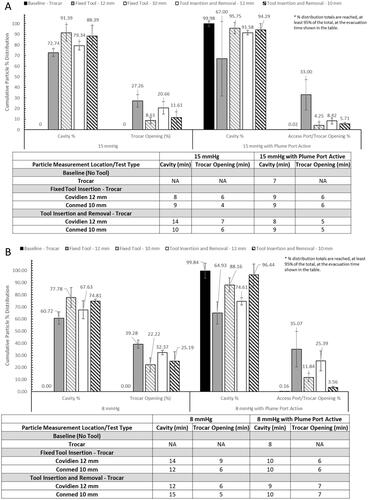
Figure 8. Representative graphs of the particle diameter concentration profile and percent distribution of each diameter seen during surgical smoke generation within the (A) SLC, (B) at the opening of the Access Port, and (C) within the smoke evacuation line. Data shown uses results from testing at 15 mmHg with High and Low smoke evacuation rates, and at Low smoke evacuation rate with the SAS.
Testing with the AS showed that going from High to Low SER with and without the SAS are statistically significant, with exceptions for measurements at the Access Port and smoke evacuation line for 8 mmHg when going from High to Low SER. When testing with a fixed tool, or tool inserted and removed, results are also statistically significant, with exceptions for measurements at the Access Port and smoke evacuation line for 15 mmHg when going from High to Low SER with the SAS active.
Results for the TIAS at baseline showed no significance when going from 15 to 8 mmHg with the SAS active, and had varying results when testing with a fixed tool or tool inserted and removed. Testing with fixed tools showed a majority of not significant or borderline significant results across all test setup, with a few exceptions, and when testing with tools inserted and removed showed significance across all test setups, except for when going from 15 to 8 mmHg using the 12 mm tool within the SLC.
Lastly, either IAS was reviewed to see if going from the 12 to 10 mm tool had an impact on the amount of SSPM at any measurement location. Paired T-tests showed no consist trends in significance when going from the 12 to 10 mm tool in a fixed or insertion and removal position.
These results show that when adjusting AirSeal® iFS settings or using laparoscopic tools, either fixed or inserted and removed, that a significant impact can be achieved. In comparison, when using the TIAS, a significant impact can only be achieved when inserting and removing tools, and that all other test setups showed mixed results. Additionally, it was observed that when using the TIAS, there are certain test setups where there can be an increase in SSPM distribution at the opening of the trocar, which was not seen with the AS.
4. Discussion
4.1. AirSeal flow rate
Standardised flow rate measurements show the amount and direction of gas flow at the opening of the AS with and without an SAS. Flow rate testing was not performed with any laparoscopic tools or with the TIAS due to the difficulty in creating a seal around the tool during insertion and removal and the lack of flow at the opening of the trocar when not using a tool.
Result averages showed that an outward, positive flow rate, referred to as venting by the Access Port, was present with all AirSeal® iFS settings and with the SAS. Flow rate results, when using a set SLC pressure of 15 or 8 mmHg with Low smoke evacuation and an SAS, show that there are two cyclic phases present. The two phases cycle between having an outward, positive flow and an inward, negative flow, referred to as entrainment of air by the Access Port. These two cycles are present only when using Low smoke evacuation with an SAS due to the combination of low smoke evacuation rate from the AirSeal® iFS and the constant suction from the SAS. When the AS senses a negative flow rate through the Access Port, it compensates by supplying a temporarily higher CO2 flow rate to the SLC to overcome the gas loss, then returns to baseline CO2 flow rates until another negative flow is determined, thus causing the cyclic behaviour at the Access Port opening.
4.2. Particle percent distribution and percent change distribution
AS particle percent and percent change distribution results showed a trend that when reducing the smoke evacuation rate to Low, with and without an SAS, that there was an increase in SSPM within the SLC, and a decrease at the Access Port opening and within the smoke evacuation line of the Tri-lumen tube set.
Another trend observed was when using a laparoscopic tool, either fixed or inserted and removed, without an SAS that when compared to baseline resulted in a higher distribution of SSPM within the SLC and a decrease at the Access Port opening and within the smoke evacuation line, with an exception when using the 12 mm tool at 8 mmHg with High smoke evacuation and when the 12 mm tool remained fixed at 8 mmHg with Low smoke evacuation.
This same consistent trend was not present at 15 mmHg when the SAS was active and resulted in an increase in percent distribution at the Access Port opening and a decrease within the smoke evacuation line. When using a set pressure of 8 mmHg with the SAS, the distribution remained relatively the same at High smoke evacuation but did show improvements when using a Low smoke evacuation rate. This test configuration resulted in an increased distribution within the SLC and an overall decreased distribution at the Access Port opening and within the smoke evacuation line.
The last trend observed was that when using an SAS with a laparoscopic tool, the percent distribution when compared to the distribution without an SAS at the Access Port opening resulted in a general increase in percent distribution. This increase is not associated with a higher concentration of SPPM, as seen in the percent distribution representative plots, but is due to the added suction within the SLC, caused by the SAS. The SAS captures SSPM, that were not measured within this study, from the SLC and causes the overall total SSPM concentration to be reduced since the SSPM capture by the SAS are not contained within the total. This results in a greater percentage representation at the Access Port opening.
Results from the TIAS showed similar trends to the AS testing, that when the SAS was active, with cavity pressure remaining the same, that there was an increase in the distribution within the SLC and a decrease at the trocar opening. It was also observed that there were a few non or borderline significant Paired T-test results for the cavity measurements only, which show that the SAS might have a greater impact on reducing the SSPM concentrations at the trocar opening but minimal impact on reducing the SSPM concentrations within the cavity.
A unique trend was also seen when decreasing the pressure from 15 to 8 mmHg, it caused the particle distribution to increase at the trocar opening. This trend is hypothesised to be due to the lack of back pressure on the trocar valves, resulting in a decrease in seal performance around the laparoscopic tool. When comparing the results between 15 and 8 mmHg with the AS, no trends were present which is why those results are not shown. It is hypothesised that the pressure difference between 15 and 8 mmHg is not enough to modify the SSPM distribution characteristic when using an AS.
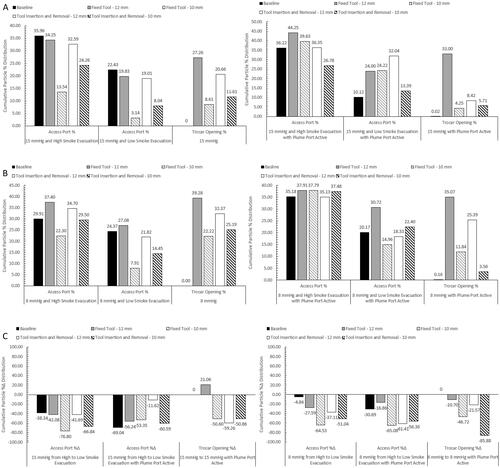
Lastly, when comparing the percent distribution between the Access Port and Trocar opening only, , it was observed that when using a laparoscopic tool, without an SAS, either system performed similarly. Percent distribution at the trocar opening did show a general improved reduction when compared to the Access Port when using an SAS, but showed similar results when using the 12 mm tool fixed within the trocar. The fixed 12 mm tool appears to show difficulty for the trocar due to the large diameter of the tool disrupting the seals and creating small openings around the tool for SSPM to escape.
4.3. SSPM evacuation time
Evacuation time trends when using either system showed an increase evacuation time when reducing the smoke evacuation rate, a decrease evacuation time when using the SAS, and a decrease in evacuation time when decreasing the SLC pressure from 15 to 8 mmHg. When comparing the two systems, the AS has reduced evacuation times to remove ≥95% of SSPM at any measurement location in any test setup due to the constant smoke evacuation (, , and ).
Figure 9. Bar graphs (A and B) show the cumulative particle %Δ distribution over the 15 min measurement time for either insufflation and access system.
*Not statistically significant, Paired T-test p value ≥ 0.10
**Borderline statistically significant, Paired T-test 0.05 ≥ p value ≥ 0.10
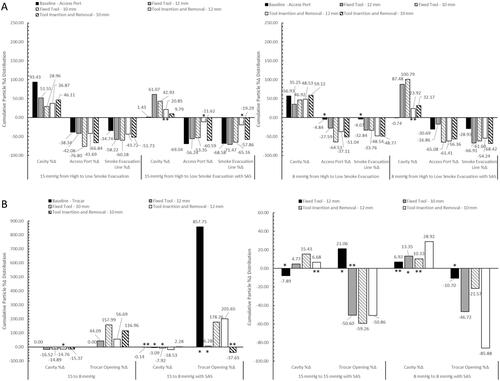
Figure 10. Particle percent distribution (A and B) and percent change distribution (C) bar graphs of Access Port and trocar opening only at 15 and 8 mmHg cavity pressure.
4.4. Limitations of study and future steps
This exploratory study was designed to provide insights and trends in SSPM distributions within two IAS, and therefore used an ex vivo model with a small sample size to be able to test multiple setups to show different simulated clinical scenarios. To improve upon our results, a study with a larger sample size, varying incision lengths and ESU settings will be needed to validate the trends and conclusions drawn from these results. Additionally, the study will be performed with an in vivo model to provide improved correlation to the surgical environment.
Future steps will also involve testing with a larger difference in cavity pressure to see if any differences can be seen in SSPM distribution. This study will be performed with the same two systems to see if any trends can be observed when using the AS and to verify the theory that the lack of backpressure has an impact on the seal quality of the trocar.
5. Conclusion
With this exploratory study, we were able to identify trends in SSPM distribution within the AirSeal® System and TIAS in various simulated surgical scenarios. The identified trends show that setting the AirSeal® iFS to Low smoke evacuation reduces the percentage of SSPM at the Access Port opening, which correlates with the flow rate measurements, and that utilising an SAS, with either IAS, can further improve SSPM reductions at either SLC pressure or smoke evacuation rate settings.
Additionally, we observed that when utilising a laparoscopic tool in a fixed, or inserted and removed position, that a similar trend in SSPM percent distributions were seen between either IAS without the use of an SAS at the opening of the Access Port and trocar. There were some increased SSPM percent distribution reductions when using an SAS with the TIAS, but not enough to prevent SSPM from being present at the opening of the trocar.
Due to the lack of current standards to regulate SSPM within the OR during laparoscopic surgery [Citation5,Citation18–20], these trends can help provide insight into what distribution of SSPM could potentially be present within the surgical cavity, at the opening of an Access Port or trocar, and within the smoke evacuation line of an AirSeal® Tri-lumen tube set. These trends also provide insight into what AirSeal® System settings could be used when either trying to reduce the amount of SSPM concentrations at the Access Port opening or improving the evacuation time for SSPM within the surgical cavity.
Disclosure statement
The authors (SL, MK, and GT) are employees of Conmed, Inc and were employed during the testing and writing of this manuscript.
Correction Statement
This article has been republished with minor changes. These changes do not impact the academic content of the article.
References
- Antoniou SA, Antoniou AI, Granderath FA, et al. Past, present, and future of minimally invasive abdominal surgery. JSLS. 2015;19(3):e2015.00052.
- Global Laparoscopy and Endoscopy Devices Market: focus on surgical procedures (cholecystectomy and hysterectomy) and product types (arthroscopes, neuroendoscopes, cystoscope, and bronchoscopes) – analysis and forecast, 2018–2025, Dublin, Research and Markets; 2018. p. 480.
- Laparoscopic Devices | Medtech 360 | Market Analysis | US | 2019. (M360LA0053), Toronto, Ontario, Millennium Research Group, Inc; 2018. p. 233.
- Agarwal M, Alkatout I, Mettler L. A manual of minimally invasive gynecological surgery. New Delhi: Jaypee Brothers Medical Publishers (P) Ltd; 2015. p. 316.
- Hill DS, Oliver DW, O’Neill JK, et al. Surgical smoke–a health hazard in the operating theatre: a study to quantify exposure and a survey of the use of smoke extractor systems in UK plastic surgery units. J Plastic Reconstruct Aesthetic Surg. 2012;65(7):911–916.
- Ulmer BC. The hazards of surgical smoke. Aorn J. 2008;87(4):721–738.
- Barrett WL, Garber SM. Surgical smoke: a review of the literature. Surg Endosc. 2003;17(6):979–987.
- Okoshi K, Kinoshita K, Kobayashi K, et al. Health risks associated with exposure to surgical smoke for surgeons and operation room personnel. Surg Today. 2015;45(8):957–965.
- Brüske-Hohlfeld I, Peters A, Nowak D, et al. Surgical smoke and ultrafine particles. J Occup Med Toxicol. 2008;3(1):31–36.
- Alp E, Voss A, Hansson B, et al. Surgical smoke and infection control. J Hosp Infect. 2006;62(1):1–5.
- Liu Y, Yan L, Hu X, et al. Awareness of surgical smoke hazards and enhancement of surgical smoke prevention among the gynecologists. J Cancer. 2019;10(12):2788–2799.
- Addley S, Quinn D. Surgical smoke–what are the risks? Obstet Gynecol. 2019;21(2):102–106.
- Mowbray NG, Parker A, Spinell A, et al. Safe management of surgical smoke in the age of COVID-19. Br J Surg. 2020;107(11):1406–1413.
- Fencl JL. Guideline implementation: surgical smoke safety. Aorn J. 2017;105(5):488–497.
- Fan JKM, Chan FSY, Chu KM. Surgical smoke. Asian J Surg. 2009;32(4):253–257.
- Karjalainen M, Kontunen A, Roine A, et al. The characterization of surgical smoke from various tissues and its implications for occupational safety. PLoS One. 2018;13(4):e0195274.
- Ott DE. Abdominal compliance and laparoscopy: a review. JSLS. 2019;23(1):e2018.00080.
- Edwards BE, Reiman RE. Results of a survey on current surgical smoke control practices. Aorn J. 2008;87(4):739–749.
- Edwards BE, Reiman RE. Comparison of current and past surgical smoke control practices. Aorn J. 2012;95(3):337–350.
- Steege AL, Boiano JM, Sweeney MH. Secondhand smoke in the operating room? Precautionary practices lacking for surgical smoke. Am J Ind Med. 2016;59(11):1020–1031.