
 ?Mathematical formulae have been encoded as MathML and are displayed in this HTML version using MathJax in order to improve their display. Uncheck the box to turn MathJax off. This feature requires Javascript. Click on a formula to zoom.
Abstract
Thermal threshold testing is important for evaluating the thermal function of small-fibre nerve types C and A-delta. This study investigated the reliability and validity of a novel nerve testing device (NNTD) in evaluating thermal detection and thermal pain thresholds. Test-retest reliability of the NNTD and its concurrent validity compared to the current technology (Medoc TSA-2, Advanced Thermosensory Stimulator, Israel) were investigated among 10 healthy participants. Each participant was tested for the warm detection threshold (WDT), cold detection threshold (CDT), hot pain threshold (HPT) and cold pain threshold (CPT) on the medial forearm with NNTD for two trials and the Medoc TSA-2 for one trial over two consecutive days. Intraclass Correlation Coefficient values, Standard Error of Measurement and Bland Altman plots were calculated for test-retest reliability. One-way ANOVA and Bland Altman plots were calculated for validity. The test-retest reliability of the NNTD was good for CPT (ICC = 0.88), moderate for WDT (ICC = 0.545) and HPT (ICC = 0.710). The NNTD was valid for both trials of HPT and CPT and one trial for WDT compared to the Medoc TSA-2. In conclusion, the NNTD showed good to moderate reliability and was found to be valid compared to the Medoc TSA-2.
1. Introduction
Small diameter nerve fibres which control thermal and pain perception can be evaluated using thermal threshold testing [Citation1,Citation2]. If small-fibre nerve damage is detected early, the patient can benefit by receiving treatment for the underlying cause, possibly preventing further deterioration (Hovaguimian and Gibbons, 2011, Chai et al., 2005, Bachmann et al. [Citation3–5]). There are four temperature thresholds (warm detection threshold (WDT), cold detection threshold (CDT), hot pain threshold (HPT) and cold pain threshold (HPT)) which should be tested, especially at the diagnostic stage, as different pathologies affect different thresholds [Citation5–9]. Some examples include: diagnosing small fibre neuropathy with WDT and CDT testing [Citation6], detecting nerve damage in patients with diabetes mellitus who had normal nerve conduction studies presented with higher CDT values from baseline [Citation10], and using thermal thresholds to distinguish restless leg syndrome which is caused by small fibre neuropathy compared to primary restless leg syndrome. [Citation5]. Unfortunately, in a clinical setting thorough assessment of somatosensory deficits, including temperature sensation, is often not addressed, or addressed inadequately, often leading to poor outcomes for patients [Citation11].
Clinicians are aware of the importance of testing thermal thresholds, however, do not have the appropriate equipment [Citation12,Citation13]. There are several existing devices for thermal testing, which traditionally are limited to a laboratory or research setting due to the initial cost, large size, set-up time, the requirement of a laptop and an electrical outlet, and require special training making them impractical for a clinical setting [Citation12–18]. The use of coins and test tubes for CDT and WDT testing, ice for CPT testing and cool tuning forks for CDT testing have all been proposed as alternative thermal testing methods, however, no method is able to test all four thresholds, the temperature of the objects is unknown and limited research is available on the reliability and validity of these methods [Citation15–17,Citation19–22].
Thus, there is a need to develop a testing method for use in the clinical setting, reliably and validly testing all four thermal thresholds. The goal of this research was to I) determine whether it is feasible to design and build a device that can test all four thermal thresholds and II) analyse the test-retest reliability of the new device and its concurrent validity compared to the Medoc TSA-2 (Advanced Thermosensory Stimulator, Serial Number 1554, 2001, Israel). Due to access, the Medoc TSA-2 was used as an established reliable and valid thermal threshold testing device [Citation16,Citation19,Citation23–27].
2. Methods
This feasibility quantitative cross-sectional study, investigating test-retest reliability and concurrent validity was approved by an institutional research ethics panel (Ref: 2019-2816). After ethical approval, a convenience sample of 10 healthy participants was recruited through email. The inclusion criteria for this study were that the participant was healthy and able to come to the university campus for a maximum of 30 min of testing on two consecutive days. To ensure the results of this study represented healthy participants without any known nerve impairments, participants were excluded if they had any known neurological conditions, acute or chronic pain, were taking analgesic medications, had a loss of skin sensation or did not speak English [Citation17,Citation27–29].
2.1. Thermal testing equipment
During this study two devices, each able to test all four thermal thresholds were tested on participants. The first device was a nerve testing device, a minimum viable prototype (MVP) device which was constructed specifically for this study. Due to pending intellectual property disclosure restrictions, further information on the prototype cannot be discussed at this time. The second device was a commercially available thermal testing laboratory machine, the Medoc TSA-2 (Advanced Thermosensory Stimulator, Serial Number 1554, 2001, Israel). Both devices had a 30 mm x 30 mm thermode and a stop button for each participant to press at the appropriate threshold.
2.2. Procedure
Each participant was tested twice with the prototype and once with the TSA-2 in a randomised order, based on a computer-generated list of randomised numbers. The participants were tested in a quiet room, sitting in a comfortable chair with their eyes closed and left medial forearm (testing site) undressed and resting on the chair’s arm rest.
2.2.1. Measurements of thermal thresholds
The TSA-2 was strapped to the participant with the provided Velcro strap. The device used a starting temperature for WDT and CDT testing of 32 °C. For HPT and CPT, the skin temperature of the participant was measured with an infra-red non-contact digital thermometer (FR-200 Thermometer, Metene, USA). The measured skin temperature was manually entered into the Medoc software as the starting/baseline temperature for the HPT and CPT tests. Between each threshold, the device was programmed to wait ten seconds at the starting temperature between tests.
The prototype thermode was held on the participant's forearm by the researcher. The device was programmed to measure the participant’s skin temperature and begin all tests from this temperature (baseline). Within the cycle, the prototype did not begin the next threshold test until the skin had returned to the baseline measured temperature along with a ten-second delay.
Each participant’s sex, age and handedness were recorded as well as the room temperature. The method of limits testing algorithm with a change of 1 °C/sec was used. Three consecutive tests for each threshold were measured starting with increasing temperature for three tests followed by decreasing temperature for three tests to complete one cycle. The test was stopped between WDT/CDT and WPT/CPT to record the results and the thermode was moved one thermode length proximally for HPT and CPT testing to use the new skin. The mean (n = 3) of each test (WDT, CDT, WPT and CPT) was used for statistical analysis.
2.3. Statistical analysis
To determine the number of participants in this study the tables by Bujang [Citation30] was followed which showed the sample size requirement is 9 for a power of 90%, alpha of 0.05, Intraclass Correlation Coefficient (ICC) of 0.8 and with two trials. Furthermore, recommendations in a handbook by Isaac and Michael [Citation31] for feasibility studies is to test 10–30 participants.
The data were analysed using the Statistical Package for the Social Sciences (SPSS) software (IBM Corp. Released 2017. IBM SPSS Statistics for Windows, Version 25.0. Armonk, NY: IBM Corp.). All trials were shown to be normally distributed with the Kolmogorov-Smirnov test with 10 degrees of freedom, which accepted the null hypothesis that the results were normally distributed as p > 0.05 were found for each [Citation32]. However, a comprehensive protocol for clinical trials from 2006 recommends that WDT and CDT data be logarithmically transformed so this was done with SPSS to maintain consistency [Citation33].
2.3.1. Test-Retest reliability
To begin, the differences between measurements from trial one and trial two of the prototype were analysed using a paired sample t-test [Citation34]. The mean differences between each trial were reported. The reliability was analysed by calculating the intraclass correlation coefficient (ICC). The results were interpreted as per Koo and Li [Citation35], where values less than 0.5 are indicative of poor reliability, between 0.5 and 0.75 imply moderate reliability, between 0.75 and 0.9 imply good reliability, and greater than 0.90 imply excellent reliability. ICC was calculated using a two-way mixed model with an absolute agreement based on a mean rating (k = 3) and a 95% confidence interval [Citation35].
Agreement measures were calculated using Bland-Altman plots which analyse the agreement between the two different tests with the prototype. Agreement refers to the degree to which the results are identical between tests on the same subject [Citation36]. Bland-Altman plots calculate limits of agreement (LoAs) using the mean and the standard deviation of the difference between two trials (mean difference ±1.96*SD) at a 95% confidence interval [Citation37]. The Y axis shows the difference between each trial (Prototype Trial 1 – Prototype Trial 2) and the X axis shows the mean ((Prototype Trial 1 + Prototype Trial 2))/2).
In addition, the standard error of measurement (SEM) was calculated using the following formulas:
Sum of Squares (SS) – calculated from ANOVA table on SPSS −25
The SEMs results were considered reliably if they were within 5% of the mean, Citation39].
2.3.2. Concurrent validity
The first analysis was a one-way ANOVA looking for any statistical differences between the three groups (prototype trial one, prototype trial two and the TSA-2 trial). A post-hoc analysis was performed using the equal variance Tukey test, the level of significance was set to p = 0.05 and the effect size (η2) was reported [Citation40]. The effect size was analysed as per Cohen [Citation41] as η2 < 0.01 = small effect size, 0.01> η2 <0.06 = medium effect size and an η2 > 0.14 = large effect size.
Bland-Altman plots were produced looking at the values from the prototype trials separately compared to the TSA-2 trial and the LoAs reported. The dependent variable was the difference between trials (Prototype trial – TSA-2) and the independent variable was the mean ((Prototype trial + TSA-2 trial)/2). The Bland Altman plots were reported with the confidence limits in hyperbolae form with a line of best fit [Citation42].
3. Results
The participants included 5 males and 5 females with a mean (SD) age of 28 (4) years, and 80% were right-handed (n = 8). The room temperature ranged from 19.29 °C to 25.09 °C. The mean (SD) of all tests (n = 3) from all trials (prototype trial 1, prototype trial 2 and TSA-2 trial) can be found in .
Table 1. Results mean (SD) in °C of all Trials.
3.1. Reliability
There were no significant differences in results for WDTlog (p = 0.600), CDTlog (p = 0.939), HPT (p = 0.742) and CPT (p = 0.332) for the prototype trials 1 and 2 (). The ICC (2,1) analysis showed that CPT has good reliability while HPT has moderate reliability (p ≤ 0.05). WDT and CDT did not have statistically significant (p ≥ 0.154) ICC values but WDT had moderate reliability and CDT poor reliability ().
Table 2. Test-Retest reliability results.
The SEM results demonstrate that all trials were less than 2 °C with HPT having the smallest value (1.22 °C) while CPT has the largest (1.74 °C) (). However, contrary to the ICC value for CPT, the SEM value is greater than 5% of the mean, indicating it is not reliable. The SEM values for WDT, CDT and HPT show good reliability.
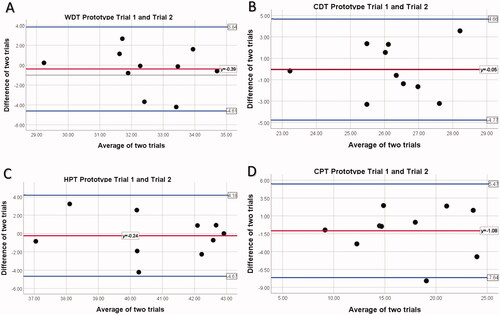
The Bland-Altman Plot’s for prototype trials 1 and 2 can be found in while the LoA results are reported in . All points, except one in CPT testing, fall within the LoA. The LoAs are smallest for WDT (−4.61 to 3.84) and largest for CPT (−7.64 to 5.47). This shows that the results from all four tests (WDT, CDT, HPT, CPT) are agreeable.
Figure 1. Bland-Altman Plot for prototype trials. Notes: (A)WDT Prototype Trail 1 compared to Prototype Trial 2; (B) CDT Prototype Trail 1 compared to Prototype Trial 2; (C) HPT Prototype Trail 1 compared to Prototype Trial 2; (D) CPT Prototype Trail 1 compared to Prototype Trial 2; The middle horizontal red line represents the mean difference between prototype trial 1 and prototype trial 2; upper and lower blue lines indicate upper and lower limits of agreement, mean difference ±1.96× SD. CDT, cold detection threshold; WDT, warm detection threshold; HPT, heat pain threshold; CPT, cold pain threshold.
3.2. Validity
There were significant differences between the prototype WDT Trials and the TSA-2 trial [F(2,27)=18.373, p = 0.000, η2 = 0.276] (). Post hoc comparisons using the Tukey test indicated that the mean score for prototype trial one was significantly different than the TSA-2 trial (M = 2.117, CI = 0.372–3.861, p = 0.015). However, prototype trial 2 did not significantly differ from the TSA-2 trial (M = 1.730, CI = −0.014 to 3.475, p = 0.052) ().
Table 3. Oneway ANOVA and Post Hoc Analysis Results for Prototype Trials Compared to TSA-2 Trial.
There were significant differences between the prototype CDT Trials and the TSA-2 trial [F(2,27) =5.133, p = 0.013, η2 = 0.576]. Post hoc comparisons using the Tukey test indicated that the mean score for prototype trial one was significantly different than the TSA-2 trial (M = 3.706, CI = 1.968–5.444, p = 0.000). Prototype trial 2 was also significantly different from the TSA-2 trial (M = 3.653, CI= 1.915–5.391, p = 0.000) ().
There were no significant differences between the prototype HPT Trials and the TSA-2 trial [F(2,27)=1.224, p = 0.310, η2 = 0.083] and there were no significant differences between the prototype CPT Trials and the TSA-2 trial [F(2,27)=0.059, p = .943, η2 = 0.004] ().
The LoAs for the Bland-Altman are reported in . Bland-Altman plots were created to look at the agreement between the two trials of the prototype compared to the TSA-2 trial. The LoAs of WDT, HPT and CPT for both trials contain the number zero. The Bland-Altman plots show that the results from all four tests (WDT, CDT, HPT, CPT) are agreeable ().
Figure 2. Bland Altman plot of differences against averages for prototype trials and TSA-2 trial with the line of best fit. Notes: (A)WDT Prototype Trial 1; (B) WDT Prototype Trial 2; (C) CDT Prototype Trial 1; (D) CDT Prototype Trial 2; (E) HPT Prototype Trial 1; (F) HPT Prototype Trial 2; (G) CPT Prototype Trial 1; (H) CPT Prototype Trial 2; The upper and lower confidence (prediction) limits for an individual at 95% confidence intervals in blue with ordinary least squares line of best fit in red. CDT, cold detection threshold; WDT, warm detection threshold; HPT, heat pain threshold; CPT, cold pain threshold.
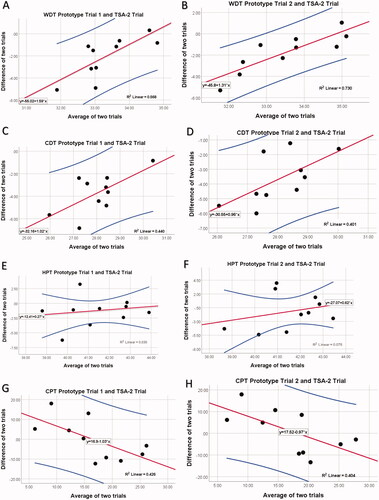
Table 4. Limits of agreement for prototype trials with TSA-2.
4. Discussion
The aim of this study was to test a novel thermal testing device and analyse its test-retest reliability and agreement, along with its concurrent validity compared to the reference standard (TSA-2). With regard to the main aim of the study, a novel gadget called Nerve Sensory Function Device (NSFD) was developed as innovative equipment. The NSFD works by testing the sensory nerve endings and evaluates various sensory functions of the nerve such as hot-cold sensation and hot-cold pain thresholds. The NSFD applies a sensory stimulus to the sensory nerve endings in order to evaluate the sensory function of the nerve as a response. Thus after developing the NSFD, the reliability and validity of the device were also examined in the current study.
4.1. Reliability
The prototype showed good test-retest reliability for all thresholds as no significant differences between each of the two trials based on the means were found. The good reliability findings of the CPT (0.88) compare to the findings of Knutti, Suter [Citation43] on the L5 dermatome (ICC 0.68–0.90) and Wasner and Brock [Citation27] who found an ICC of 0.781 comparing testing on day 1 vs day 21 on the dorsum of the hand using the same size of thermode. HPT had moderate reliability (0.71) which compares to Felix and Widerstrom-Noga [Citation23] (0.55–0.79) who also tested 10 healthy subjects, however, with a smaller 16 mm x 16 mm probe in eight different locations on the body. It has been shown that a larger thermode (9cm2) results in decreased thresholds compared to a much smaller thermode (2.5cm2), possibly explained by spatial summation [Citation44]. Other studies reported higher ICC values for HPT (good to excellent reliability) however they included larger sample sizes [Citation27,Citation28,Citation43]. The prototype requires further testing with a larger sample.
Although our study found poor reliability for CDT (ICC 0.29), the findings are in line with previous research. With a one-week interval, testing on L4, L5 and S1, Krassioukov, Wolfe [Citation25] found poor reliability with CDT, however, the thermode size was not reported. Zwart and Sand [Citation45] found poor reliability for both WDT and CDT when testing L4, L5 and S1 with a larger 25 × 50mm thermode after 1–2 h. A moderately reliable WDT result, as found in our study (ICC 0.54), is common. Felix and Widerstrom-Noga [Citation23], Krassioukov et al. [Citation25] and. Nothnagel, Puta [Citation28] also found a moderate WDT (ICC 0.70, 0.36–0.84 and 0.51 respectively).
The agreement is important to analyse as it can be counterintuitive to the ICC findings [Citation32]. Nothnagel, Puta [Citation28] found CPT LoAs as the largest out of all thermal tests (−18.22 °C to 15.20 °C) on the hand which is a very large temperature range (33 °C) while this study found a small range of only 13 °C indicating improved agreement. Bland Altman plots do not provide an analysis of the LoA’s found to be suitable but the smaller the bias the better [Citation32].
Historically thermal threshold testing reliability varies significantly among healthy participants, especially for thermal detection thresholds [Citation23,Citation28,Citation46]. There are many factors that could contribute to this including the small sample size of this study and other studies, the differences in testing location on the body, the different baseline temperature (measured skin temperature instead of a set temperature), non-standardized testing, the reaction time of the participant which needs to be quicker for thermal detection thresholds compared to thermal pain thresholds, outside distractions or unknown room and skin temperatures [Citation44,Citation47–49]. The prototype design is working towards improving the reliability with improved technology including the skin temperature and room temperature sensors which could have an advantage over coins, ice and test tube testing methods as the temperature of the thermode is always known [Citation15–17].
4.2. Validity
The results show that the prototype is valid for testing HPT and CPT. The results for the prototype compared to the TSA-2 were statistically different for WDT and CDT with large effect sizes. One way to look at the results is by comparing how far CDT and WDT are from the baseline temperature (e.g., WDT result minus measured skin temperature for the prototype or WDT result minus 32 °C for the TSA-2). The WDT results for the prototype are much farther from baseline than previous studies with participants in prototype trial one pressing the stop button at +3.73 °C from skin/starting temperature, trial two at +4.6 °C from skin temperature and the TSA-2 was +2.39 °C from the 32 °C starting temperature. From previous studies, in similar testing locations, +1.64 °C and +1.67 °C were found for WDT from baseline [Citation18,Citation50]. Higher WDT with a warmer baseline temperature (35 °C) has been previously reported as found in this study [Citation14] and could be a result of starting at skin temperature.
CDT was similar to previous findings with regard to the change in temperature from the baseline temperature. The prototype trial one averaged −2.38 °C from skin temperature, trial two −1.84 °C from skin temperature and the TSA-2 was −2.12 °C from the 32 °C starting temperature. From previous studies, in similar locations −1.12 °C and −1.77 °C were found for CDT from baseline [Citation18,Citation50].
One of the big differences between the TSA-2 and the prototype is the baseline temperatures. The baseline temperature at which the thermode begins each cycle can influence results [Citation47,Citation48,Citation51]. For HPT and CPT, both devices (prototype and TSA-2) started at the measured skin temperature, which could have contributed to the validity results. A previous study found that there was no significant difference in CPT results when the baseline temperature was 32 °C or 36 °C [Citation52]. For the WDT and CDT tests, the TSA-2 was started at a common starting temperature of 32 °C [Citation14], while the mean temperature reported by the prototype was 33.96 °C. [Citation47,Citation48,Citation53]. Colder thermode temperatures can lead to increased detection of decreasing temperatures while a warmer starting thermode can result in improved detection of increasing temperatures [Citation51]. Participants pressed the stop button on the TSA-2 as it warmed up to 32 °C prior to starting WDT testing, indicating that the probe felt warm. This design is similar to the alternative testing methods such as coins or test tubes, which do not change the skin temperature prior to beginning the test [Citation15–17].
The temperature of the room, if too cold (<10 °C) or too hot (>25 °C) can influence skin temperature and change the WDT and CDT [Citation54]. The prototype was designed to instantly display the room temperature to allow the clinician to address the issue if too warm or too cool before testing. The prototype also records the skin temperature, which may be influenced by room temperature. Therefore, the test should not be completed until the skin is 25 °C–37 °C [Citation47,Citation48]. Both features are advantages of the prototype, ensuring more accurate thermal testing. Participants were not acclimatised to the room temperature prior to testing, resulting in skin temperatures measured ranging from 29.1 °C to 37.71 °C, which may have influenced the results [Citation44,Citation48].
Bland Altman plots can also be used to compare a new measurement technique (prototype) with a gold standard (TSA-2), as even a gold standard’s results could have errors [Citation32]. The Bland-Altman plots show agreement between all the tests indicating both the TSA-2 and the prototype had acceptable results.
Participants were not blinded to their results, especially with the TSA-2 as it displays a visual graph on a laptop immediately after completion of the testing. Participants could see their results if they wished. This could have influenced further tests, influencing the reliability of the results [Citation55]. The prototype, however, did not have a visual display of the results for the participants (only for the researcher) ensuring accurate reliable testing. As this was a feasibility study, the number of participants was small. To improve the significance of the results, the number of participants will be increased in the future. The results can only be applied to the small number of participants who came from a distinct group (all physiotherapy students at one university). Furthermore, all participants were between 26 and 39 years old, which represents a small age group. Further research of the prototype is needed, including design alterations and further testing of reliability and valid for different pathologies, body locations and participant ages.
5. Conclusion
This study is a stepping stone for the creation of a clinically useful thermal threshold device as the test-retest reliability for HPT and CPT ranged from moderate to good respectively, and all thermal thresholds were aggregable. Furthermore, both trials of HPT and CPT and one trial for WDT were found to be valid compared to the TSA-2. However, the device can be improved even further to ensure its reliability, validity and ease of use in practice. Therefore, the prototype will be redesigned and further research on its feasibility, reliability and validity is warranted.
Acknowledgement
The authors wish to thank the Department of Research, Enterprise and Social Partnerships, University of Brighton, the United Kingdom for all the sincere support and assistance provided to the research study. The current study is supported by Innovation Kick Start Funding awarded by the University of Brighton.
Disclosure statement
The authors report no conflict of interest
Additional information
Funding
References
- Heldestad Lillieskold V, Nordh E. Method-of-limits; cold and warm perception thresholds at proximal and distal body regions. Clin Neurophysiol Pract. 2018;3:134–140.
- Hovaguimian A, Gibbons CH. Diagnosis and treatment of pain in small-fiber neuropathy. Curr Pain Headache Rep. 2011;15(3):193–200.
- Chai J, Herrmann DN, Stanton M, Barbano RL, Logigian EL. Painful small-fiber neuropathy in Sjogren syndrome. Neurology. 2005;65(6):925–927.
- Jimenez-Cohl P, Grekin C, Leyton C, et al. Thermal threshold: research study on small fiber dysfunction in distal diabetic polyneuropathy. J Diabetes Sci Technol. 2012;6(1):177–183.
- Bachmann CG, Rolke R, Scheidt U, et al. Thermal hypoaesthesia differentiates secondary restless legs syndrome associated with small fibre neuropathy from primary restless legs syndrome. Brain. 2010;133(3):762–770.
- Bakkers M, Faber CG, Reulen JP, et al. Optimizing temperature threshold testing in small-fiber neuropathy. Muscle Nerve. 2015;51(6):870–876.
- Farooqi MA, Lovblom LE, Lysy Z, et al. Validation of cooling detection threshold as a marker of sensorimotor polyneuropathy in type 2 diabetes. J Diabetes Complications. 2016;30(4):716–722.
- Maixner W, Fillingim R, Booker D, et al. Sensitivity of patients with painful temporomandibular disorders to experimentally evoked pain. Pain. 1995;63(3):341–351.
- Malmstrom EM, Stjerna J, Hogestatt ED, et al. Quantitative sensory testing of temperature thresholds: Possible biomarkers for persistent pain? J Rehabil Med. 2016;48(1):43–47.
- Loseth S, Stalberg E, Jorde R, et al. Early diabetic neuropathy: thermal thresholds and intraepidermal nerve fibre density in patients with normal nerve conduction studies. J Neurol. 2008;255(8):1197–1202.
- Cahill LS, Lannin NA, Mak-Yuen YYK, et al. Changing practice in the assessment and treatment of somatosensory loss in stroke survivors: protocol for a knowledge translation study. BMC Health Serv Res. 2018;18(1):34.
- Cruccu G, Truini A. Neuropathic pain and its assessment. Surg Oncol. 2010;19(3):149–154.
- Sterling M. Testing for sensory hypersensitivity or central hyperexcitability associated with cervical spine pain. J Manipulative Physiol Ther. 2008;31(7):534–539.
- Bakkers M, Faber CG, Peters MJ, et al. Temperature threshold testing: a systematic review. J Peripher Nerv Syst. 2013;18(1):7–18.
- Ridehalgh C, Sandy-Hindmarch OP, Schmid AB. Validity of clinical small-fiber sensory testing to detect small-nerve fiber degeneration. J Orthop Sports Phys Ther. 2018;48(10):767–774.
- Tilley P, Bisset L. The reliability and validity of using ice to measure cold pain threshold. Biomed Res Int. 2017;2017:7640649.
- Zhu GC, Bottger K, Slater H, et al. Concurrent validity of a low-cost and time-efficient clinical sensory test battery to evaluate somatosensory dysfunction. Eur J Pain. 2019;23(10):1826–1838.
- Rolke R, Baron R, Maier C, et al. Quantitative sensory testing in the German research network on neuropathic pain (DFNS): standardized protocol and reference values. Pain. 2006;123(3):231–243.
- Agostinho CM, Scherens A, Richter H, et al. Habituation and short-term repeatability of thermal testing in healthy human subjects and patients with chronic non-neuropathic pain. Eur J Pain. 2009;13(8):779–785.
- Connell LA, Tyson SF. Measures of sensation in neurological conditions: a systematic review. Clin Rehabil. 2012;26(1):68–80.
- Winward CE, Halligan PW, Wade DT. Somatosensory assessment after central nerve damage: the need for standardized clinical measures. Physical Therapy Reviews. 1999;4(1):21–28.
- Stolk-Hornsveld F, Crow JL, Hendriks EP, et al. The Erasmus MC modifications to the (revised) Nottingham sensory assessment: a reliable somatosensory assessment measure for patients with intracranial disorders. Clin Rehabil. 2006;20(2):160–172.
- Felix ER, Widerstrom-Noga EG. Reliability and validity of quantitative sensory testing in persons with spinal cord injury and neuropathic pain. J Rehabil Res Dev. 2009;46(1):69–83.
- Kemler MA, Reulen JP, van Kleef M, et al. Thermal thresholds in complex regional pain syndrome type I: sensitivity and repeatability of the methods of limits and levels. Clin Neurophysiol. 2000;111(9):1561–1568.
- Krassioukov A, Wolfe DL, Hsieh JT, et al. Quantitative sensory testing in patients with incomplete spinal cord injury. Arch Phys Med Rehabil. 1999;80(10):1258–1263.
- Moravcová E, Bednarik J, Svobodník A, et al. Reproducibility of thermal threshold assessment in small-fibre neuropathy patients. Scr Med. 2005;78(3):177–184.
- Wasner GL, Brock JA. Determinants of thermal pain thresholds in normal subjects. Clin Neurophysiol. 2008;119(10):2389–2395.
- Nothnagel H, Puta C, Lehmann T, et al. How stable are quantitative sensory testing measurements over time? Report on 10-week reliability and agreement of results in healthy volunteers. J Pain Res. 2017;10:2067–2078.
- Pavlakovic G, Klinke I, Pavlakovic H, et al. Effect of thermode application pressure on thermal threshold detection. Muscle Nerve. 2008;38(5):1498–1505.
- Bujang MAB. A simplified guide to determination of sample size requirements for estimating the value of intraclass correlation coefficient: a review. Arch Orofacial Sci. 2017;12(1):1–11.
- Isaac S, Michael WB. Handbook in research and evaluation: a collection of principles, methods, and strategies useful in the planning, design, and evaluation of studies in education and the behavioral sciences., 3rd ed. San Diego, CA, US: EdITS Publishers; 1995. (Handbook in research and evaluation: A collection of principles, methods, and strategies useful in the planning, design, and evaluation of studies in education and the behavioral sciences, 3rd ed.).
- Giavarina D. Understanding bland Altman analysis. Biochem Med. 2015;25(2):141–151.
- Rolke R, Magerl W, Campbell KA, et al. Quantitative sensory testing: a comprehensive protocol for clinical trials. Eur J Pain. 2006;10(1):77–88.
- Werner MU, Petersen MA, Bischoff JM. Test-retest studies in quantitative sensory testing: a critical review. Acta Anaesthesiol Scand. 2013;57(8):957–963.
- Koo TK, Li MY. A guideline of selecting and reporting intraclass correlation coefficients for reliability research. J Chiropr Med. 2016;15(2):155–163.
- Kottner J, Audige L, Brorson S, et al. Guidelines for reporting reliability and agreement studies (GRRAS) were proposed. Int J Nurs Stud. 2011;48(6):661–671.
- Pavlakovic G, Zuchner K, Zapf A, et al. Influence of intrinsic noise generated by a thermotesting device on thermal sensory detection and thermal pain detection thresholds. Muscle Nerve. 2009;40(2):257–263.
- Weir JP. Quantifying test-retest reliability using the intraclass correlation coefficient and the SEM. J Strength Cond Res. 2005;19(1):231–240.
- Atkinson G, Nevill AM. Statistical methods for assessing measurement error (reliability) in variables relevant to sports medicine. Sports Med. 1998;26(4):217–238.
- Stoline MR. The status of multiple comparisons: simultaneous estimation of all pairwise comparisons in one-way ANOVA designs. Am Statistician. 1981;35(3):134–141.
- Cohen J. Statistical power analysis for the behavioral sciences. 2nd ed. Hillsdale, N.J.: L. Erlbaum Associates; 1988.
- Ludbrook J. Confidence in Altman-Bland plots: a critical review of the method of differences. Clin Exp Pharmacol Physiol. 2010;37(2):143–149.
- Knutti IA, Suter MR, Opsommer E. Test-retest reliability of thermal quantitative sensory testing on two sites within the L5 dermatome of the lumbar spine and lower extremity. Neurosci Lett. 2014;579:157–162.
- Defrin R, Petrini L, Arendt-Nielsen L. Spatial summation of thermal sensations depends on skin type and skin sensitivity. Exp Brain Res. 2009;198(1):29–36.
- Zwart JA, Sand T. Repeatability of dermatomal warm and cold sensory thresholds in patients with sciatica. Eur Spine J. 2002;11(5):441–446.
- Moloney NA, Hall TM, Doody CM. Reliability of thermal quantitative sensory testing: a systematic review. J Rehabil Res Dev. 2012;49(2):191–207.
- Hagander LG, Midani HA, Kuskowski MA, et al. Quantitative sensory testing: effect of site and skin temperature on thermal thresholds. Clin Neurophysiol. 2000;111(1):17–22.
- Pertovaara A, Kauppila T, Hamalainen MM. Influence of skin temperature on heat pain threshold in humans. Exp Brain Res. 1996;107(3):497–503.
- Harrison JL, Davis KD. Cold-evoked pain varies with skin type and cooling rate: a psychophysical study in humans. Pain. 1999;83(2):123–135.
- Yarnitsky D, Sprecher E. Thermal testing: normative data and repeatability for various test algorithms. J Neurol Sci. 1994;125(1):39–45.
- Hilz MJ, Glorius S, Beric A. Thermal perception thresholds: influence of determination paradigm and reference temperature. J Neurol Sci. 1995;129(2):135–140.
- Kim HK, Kim KS, Kim ME. Influence of test site and baseline temperature on orofacial thermal thresholds. J Orofac Pain. 2013;27(3):263–270.
- Leffler AS, Hansson P. Painful traumatic peripheral partial nerve injury-sensory dysfunction profiles comparing outcomes of bedside examination and quantitative sensory testing. Eur J Pain. 2008;12(4):397–402.
- Hirosawa I, Dodo H, Hosokawa M, et al. Physiological variations of warm and cool sense with shift of environmental temperature. Int J Neurosci. 1984;24(3–4):281–288.
- Lucas NP, Macaskill P, Irwig L, et al. The development of a quality appraisal tool for studies of diagnostic reliability (QAREL). J Clin Epidemiol. 2010;63(8):854–861.