
Abstract
The design freedom afforded by additive manufacturing (AM) is now being leveraged across multiple applications, including many in the fields of imaging for personalised medicine. This study utilises a pellet-fed, multi-material AM machine as a route to fabricating new imaging phantoms, used for developing and refining algorithms for the detection of subtle soft tissue anomalies. Traditionally comprising homogeneous materials, higher-resolution scanning now allows for heterogeneous, multi-material phantoms. Polylactic acid (PLA), a thermoplastic urethane (TPU) and a thermoplastic elastomer (TPE) were investigated as potential materials. Manufacturing accuracy and precision were assessed relative to the digital design file, whilst the potential to achieve structural heterogeneity was evaluated by quantifying infill density via micro-computed tomography. Hounsfield units (HU) were also captured via a clinical scanner. The PLA builds were consistently too small, by 0.2 − 0.3%. Conversely, TPE parts were consistently larger than the digital file, though by only 0.1%. The TPU components had negligible differences relative to the specified sizes. The accuracy and precision of material infill were inferior, with PLA exhibiting greater and lower densities relative to the digital file, across the 3 builds. Both TPU and TPE produced infills that were too dense. The PLA material produced repeatable HU values, with poorer precision across TPU and TPE. All HU values tended towards, and some exceeded, the reference value for water (0 HU) with increasing infill density. These data have demonstrated that pellet-fed AM can produce accurate and precise structures, with the potential to include multiple materials providing an opportunity for more realistic and advanced phantom designs. In doing so, this will enable clinical scientists to develop more sensitive applications aimed at detecting ever more subtle variations in tissue, confident that their calibration models reflect their intended designs.
1. Introduction
The freedom afforded by additive manufacturing (AM) provides an opportunity to design complex geometries. Whilst traditional AM machines laser-sinter single polymer powders, new technologies now enable builds comprising multiple materials delivered with greater accuracy and precision. Increasing accessibility means that these techniques are being used in more diverse fields, with examples evident in the personalised and precision medicine space including orthopaedics and maxillofacial surgery [Citation1,Citation2], prosthetics and orthotics [Citation3,Citation4], pharmaceutical and cellular [Citation5,Citation6].
This study focusses on employing a novel, multi-material manufacturing process to develop new imaging phantoms, an emerging field of precision medicine that draws on achieving builds of increasingly high spatial resolution [Citation7]. This is particularly important when aiming to acquire a discrete image of a continuous object [Citation8]. Clinical imaging represents the primary route for the early diagnosis of many diseases, including cancer. Greater imaging resolution has the potential to identify ever-smaller anomalies within tissues, improving diagnostic capabilities. Imaging phantoms are an essential component in successfully delivering diagnostic scanning, providing repeatable attenuation to monitor imaging devices and, where necessary, enabling re-calibration [Citation9]. Phantoms designed for calibration typically feature a homogeneous (i.e. uniform) substrate, providing a consistent medium over time, and across devices. Anthropomorphic phantoms are designed with characteristics and feature comparable to human tissue, enabling the investigation of new and novel scanning protocols that will ultimately achieve enhanced detection capabilities [Citation7].
Multiple anthropometric phantoms are commercially available. The Gammex 464 is an integral part of the American College of Radiology CT Accreditation Program. Constructed of Solid Water, it features sixteen interchangeable rods of various tissue and water substitutes (Gammex 2004). Other approaches to mimic human tissues include water, agarose, lipid particles, protein, glass beads, and thimerosal (preservative). Physiological fat has been mimicked by safflower oil suffusing a random mesh of polyurethane [Citation10]. The CIRS CT dose phantoms use a similar model to the Gammex 464, whilst the Catphan 500 uses air, polymethyl pentene, low-density polyethene, water, polystyrene, acrylic, Delrin and Teflon.
The emergence of artificial intelligence-led algorithms enables more sensitive assessments by detecting more subtle tissue anomalies, providing an opportunity for earlier diagnosis. Validation and verification of these new and novel approaches require phantoms that can represent subtle differences in tissue textures, geometries, and image attenuation. Traditional phantoms that rely on homogeneous properties serve a different purpose and so do not replicate these complex structures; hence, demand exists for a new generation of phantoms [Citation7].
AM has recently been deployed to produce anthropomorphic phantoms. Mackin et al. [Citation11] produced a phantom that enabled multiple inserts of single materials, with some built using filament-based manufacture. Hounsfield Unit (HU) values provided a baseline for material imaging attenuation. Hernandez-Giron et al. [Citation12] built a polymethyl methacrylate lung phantom, derived from segmented CT data. Using a double-extrusion filament printer allowed the casing to be constructed from a different material, in this instance polytetrafluoroethylene. Whilst this provided consistent attenuation, HU values were not considered physiologically relevant. A resin-based, multi-material printer enabled different materials and textures for a tumour and surrounding tissue, an approach that achieved HU values with greater physiological comparability [Citation13]. Solc et al. [Citation14] investigated the linear attenuation coefficient and the HU for multiple materials, again using filament-based extrusion to provide baseline data. Image attenuation characteristics of the AM-manufactured materials were then positively compared to data from the Catphan 500 phantom.
An opportunity now exists to develop phantoms that integrate more than one material, replicating structural anomalies embedded within healthy tissue [Citation15,Citation16]. This study assesses the viability of a multi-material AM technology as a potential route to delivering the next-generation imaging phantom.
2. Materials & methods
The relevance of this new AM technology for use in manufacturing anthropomorphic phantoms was assessed against three criteria:
build accuracy and precision
infill quality, as a route to achieving controlled heterogeneity
physiological equivalence
Three commercially available polymeric materials, Polylactic acid (PLA), a thermoplastic urethane and a thermoplastic elastomer, were selected for their promising image attenuation properties.
2.1. Materials
Supply (500 g) of three materials was purchased directly from the original engineering manufacturer (Pollen AM, France) in pelletised form. Pellets were broadly cylindrical, measuring 3–5 mm in length and 2–3 mm in diameter.
2.2. Method
A new pellet-fed extrusion machine (PAM Series P; Pollen AM, France) was evaluated for ultimate use in building heterogeneous phantoms. Compared to a conventional filament extrusion machine, a pellet-fed machine provides access to a wider range of materials (all extrusion and injection moulding grades of thermoplastics), can process very soft materials that would be too extensible to use in a conventional 3D printer, and enables accelerated material development. Default process parameters provided by the machine manufacturer were then tuned across the three materials to achieve equal layer thickness, identical nozzle diameter and common line width ().
Table 1. Optimised printing parameters.
A bespoke component () was then designed, comprising several intricate geometries to measure the build accuracy across multiple dimensions. G-code was produced using Cura software (Ultimaker, Holland), such that each region of the part had an infill density of 25,50,75 and 100% respectively. The gyroid infill pattern was selected to provide the most isotropic HU values (). Each part was printed onto a PLA base to provide rigid support and aid with part manipulation, scanning and measuring. Three builds were completed in each material.
Figure 1. The test part was designed to evaluate the accuracy and precision of the pellet-fed AM machine. Dimensions in mm.
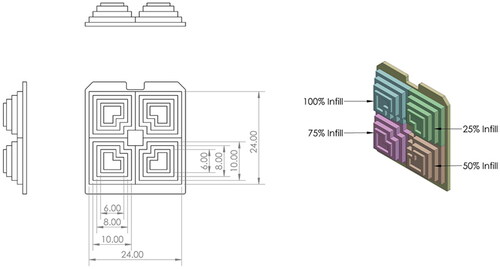
Figure 2. Visualization of the gyroid infill patterns as generated by the Cure software package.
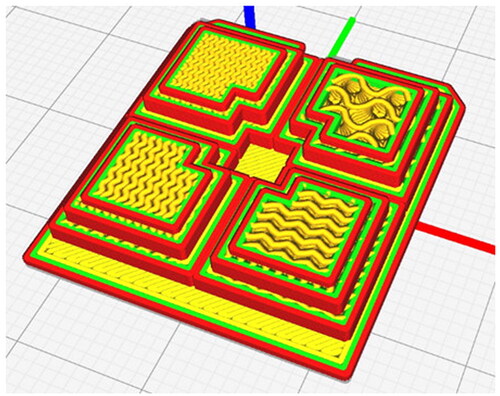
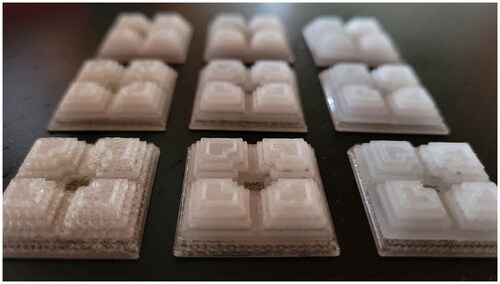
Figure 3. The 9 parts, with each comprising a pyramid of 100% (top left), 75% (bottom left), 50% (bottom right) and 25% (top right) infill densities. Left column = PLA; middle column = TPU; right column = TPE; Far row = Part 1; middle row = Part 2; near row = Part 3.
2.2.1. Experim ental measurements
2.2.1.1. Geometric accuracy
A shadowgraph (PJ-3000; Mitutoyo, Sakado, Japan) was used to capture the dimensions of each layer of each test piece. More conventional contact measuring techniques were not suitable, due to elastically deforming the softest material. Shadowgraphs require the part to be placed on a stage, before shining a light from underneath to project the magnified shadow onto a screen. A telecentric optical system was used to measure the length and width of each layer of each pyramid, for comparison to the equivalent dimension from the .stl file. This allowed for quantifying the accuracy of the manufacturing method.
2.2.1.2. Geometric precision
The precision of the manufacturing method was quantified by computing the dimensional variation. Variation in the same dimension across the three builds of the same material was calculated, to define the level of precision which the machine was able to build consecutive parts.
2.2.1.3. Heterogeneity
Achieving controlled heterogeneity is important to represent the specific textures within a tumour. Infill density, a proxy measure, was quantified by comparing physical data to the original design file. High-resolution porosity and volumetric analysis were performed via
X-ray microtomography (MicroCT) using a lab-based Nikon XT H 225 microfocus X-ray tomography system (Nikon Metrology, Tring, UK) in the Advanced Imaging of Materials Core Facility (College of Engineering, Swansea University, UK). Images were captured with a Varian PaxScan 2520 amorphous silicon flat panel digital X-ray imager, in reflection mode with a tungsten target. The builds were imaged in material-specific batches, with three builds of the same material arranged and separated using a 3D printed box (). Each box was imaged separately, but with consistent imaging parameters: an 80 kV X-ray tube voltage, a current of 160 µA, 0.5 mm aluminium filter, with an exposure of 500 ms, averaging 2 images per rotation step of 0.119°, resulting in 3016 projections per scan and a voxel (3-D pixel) size of 26.04 µm. The tomograms were reconstructed in 8-Bit from 2-D projections using a Nikon cone-beam reconstruction algorithm and proprietary software (CTPro version 3.0, Nikon Metrology). The commercial software VGStudio Max 2.1.5 was used to view the reconstructed data, 2‐D grey scale slices, rendered 3-D volumes, and porosity/density analysis.
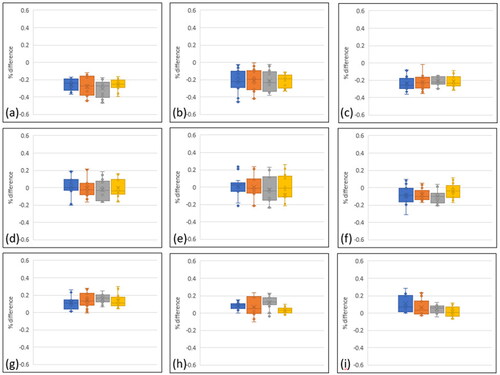
Figure 4. Accuracy of the AM process expressed as the percentage difference of the built parts relative to the digital file. Multiple lengths were measured using shadow graphs. Positive differences describe a larger build. (a) – (c) represent PLA parts 1, 2 & 3; (d)– (f) represent TPU parts; (g)– (i) are the three TPE parts. Blue = 25% infill, Orange = 50%, Grey = 75%, Yellow = 100%.
2.2.1.4. Physiological equivalence
Computer tomography scans were acquired on a Somatom go.Sim (Siemens Healthineers, Erlangen, Germany), a clinical scanner dedicated to the optimisation of operations in the radiotherapy department at Velindre Cancer Centre (Cardiff, UK). The imaging protocol included tube peak voltage = 120 kVp, pixel spacing = 1.2 mm, and reconstructed slice thickness = 1 mm. Volumetric data were captured and then compiled using in-house software [Citation17], which enabled part reconstruction. The relevance of the materials and variation afforded by the infill densities was then evaluated by comparing the HU values to the literature.
3. Results
Nine parts were manufactured, 3 each from PLA, TPU and TPE materials. Each build comprised a region with 100, 75, 50 and 25% infill density, all printed on a PLA bed ().
3.1. Geometric accuracy
Geometric accuracy was very strong across all materials, with variation typically within 0.3% of the original .stl dimensions (). For context, a 6 mm length would vary from 5.982 − 6.018 mm. PLA demonstrated the lowest accuracy, with the median value almost always >0.2% smaller than the prescribed geometry. The negative metric describes an undersized build. Accuracy was lower during the 50% infill build and higher with 100% infill, as described by the different interquartile ranges (i.e. the difference from the 25% to 75% percentile). Builds with 100% infill achieved the greatest accuracy, with the median always achieving the lowest deviation.
Figure 5. Manufacturing precision, represented by the median percentage difference for each of the build parts, relative to the digital file. Multiple lengths were measured using shadow graphs. Positive differences describe a larger built part. (a) represents PLA builds, (b) represents TPU material, and (c) represents TPE material. Blue = part 1, Orange = part 2, Grey = part 3.
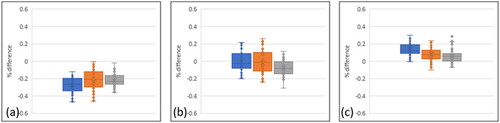
Higher accuracy was achieved with TPU builds, where the median values were commonly within 0.1% of the digital file. The interquartile ranges were broadly consistent across infill density, though greater variation was evident in the PLA material when considering the 1st and 4th quartiles, routinely exceeding 0.4% difference versus the digital file.
The TPE builds were typically larger than the intended dimension, though with the median value typically equal to or less than 0.1% greater than intended. The interquartile ranges were generally smaller than the other materials, whilst the extended error bars that were a feature of the TPU material were less pronounced.
3.2. Geometric precision
Very high precision is reported across all materials, with median values deviating by less than 0.1% in all cases (). The PLA builds were consistently 0.2 − 0.3% smaller than the digital file, with the first part the smallest of all. The interquartile ranges remained consistent across the three builds. The median values for each TPU build were again separated by less than 0.1%, with similar interquartile ranges as PLA. The TPE material had smaller interquartile ranges and a comparably narrow variation in median values.
Figure 6. Quantifying the build part infill density, relative to the digital instruction via g-code. Positive values equate to an overly dense infill. (a) represents PLA builds, (b) represents TPU materials, (c) represents TPE material. Blue = part 1, Orange = part 2, Grey = part 3, (d) uCT images capturing a region of interest within the 25%, 50%, 75% and 100% infill PLA parts.
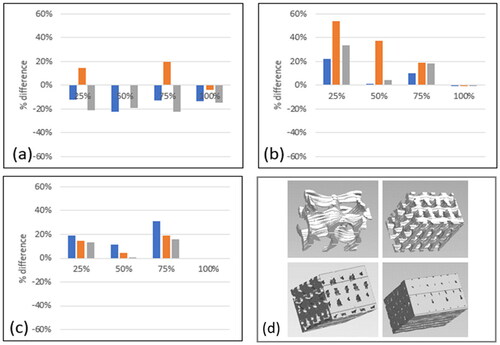
3.3. Heterogeneity
Sub-surface regions of interest were created away from surfaces and edges within each of the four infill regions in each build. The solid polymeric material was segmented from internal air/porosity using a greyscale-based threshold method, and the material volume to total volume ratio (mv/tv) was calculated to give a measure of infill density (). The relative density is presented, which is scaled relative to the desired infill density, to provide a measure of error. The PLA builds exhibited the lowest overall difference to the specified infill density, over- or under-sized by approximately 20%. Parts 1 and 3 had infill densities lower than expected, whereas Part 2 was generally too dense except for 100% infill which, ironically, has porosities. Both the TPU and TPE material appeared to over-extrude, meaning that all were too dense relative to the original specification. In all instances, those parts that were prescribed as 100% density were all successful. There were examples of considerable variation across parts, with the TPU (2) reporting consistently excessive density. Conversely, TPU (1) had a close correlation in all except the 25% infill design. TPE achieved the most consistent infill density.
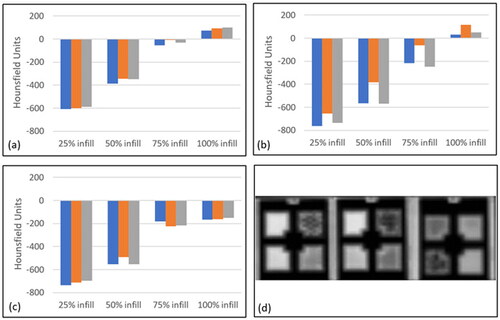
Figure 7. The tissue equivalence of each material as expressed in Hounsfield Units was measured via computer tomography. (a) PLA, (b) TPU, and (c) TPE. Blue = part 1, Orange = part 2, Grey = part 3. (d) 2D CT slice through the coronal plane of PLA (left), TPU (centre) and TPE (right) builds, with the different intensities representing different infill densities.
3.5. Physiological equivalence
Infill density and material both contributed to the range of recorded HU values (+120 to −760) (). The lowest PLA infill produced relatively consistent HU values (−∼600). Fifty percent infill recorded HU values of ∼ −350, though with greater variation. The parts that were 100% dense produced positive HU values. A similar trend was observed with the TPU material, with the least dense infill producing the lowest HU values (∼ −750). Those parts with greater infill reported greater HU values, though the variation was greatest at the 50% and 75% infill samples. The 100% infill parts were again the only density that achieved positive HU values. Twenty-five percent of infill TPE had HU values similar to the other materials (∼ −700). These values increased towards zero (indicating water equivalence) with increasing infill density though, unlike the fully dense parts, did not achieve a positive value. Instead, the HU values of the 75% and 100% infill were similar (∼ −200 (75% infill) & ∼ −150(100% infill)).
4. Discussion
This study aimed to evaluate the potential efficacy of a novel manufacturing technique for producing multi-material, heterogeneous imaging phantoms. Such an approach relies on an accurate and reliable process to represent intricate structural anomalies within soft tissue, with the additional capability to vary texture, all in materials that demonstrate physiological equivalence. Data presented here demonstrate that this technique has performed strongly, whilst further optimisation of the processing parameters will provide an opportunity to achieve an even closer comparison to the desired outputs. Such an approach may eventually enable the next generation of imaging phantoms.
The PLA-manufactured parts were all consistently too small, which was possibly due to the deposited extrusion path not dispersing to the extent was expected. Further investigation could focus on increasing the nozzle head temperature, to encourage a less viscous deposit that would have the potential to produce slightly larger parts. This relative lack of material was also reflected in the micro-CT data, which described parts 1 and 3 as having densities lower than prescribed across the majority of infills. Part 2 was commonly too dense – indicating excessive extrusion, though also typically had the median HU value. This inconsistency may reflect the relative insensitivity of the clinical-grade CT scanners and imaging sequence used in this study, in quantifying relatively small structural differences.
The TPU parts were all very accurate and repeatable when compared to the intended geometries, though were consistently too dense. This may be due to stringing in the infill structure, which is where filament inadvertently stretches from one design feature to another. This is more common where there are several shorter, adjacent features, whereas the outer walls are built as one consecutive part. Part 2 was commonly the densest, significantly exceeding both the desired geometric dimension and the equivalent dimensions of the other parts. Indeed, this part was also that with the highest HU value, supporting a correlation with part density.
The TPE parts were generally slightly too large, though substantially too dense. Material stringing may again have partially contributed to this difference, though is unlikely to contribute to the 20% excessive density observed with some measurements. Despite the such difference in density – especially between parts 1 and 3, there is a surprising correlation between the HU values. Whilst appearing to contradict the correlation between density and HU, it is again proposed that this variation is due to the inherent insensitivity of the CT scanner.
This study has highlighted the potential value of adopting manufacturing techniques that can vary both the material and structure. This has provided a range of HU values, −800 to +100, which encompasses the majority of targeted soft tissues. Scope exists to further extend this range by selecting other materials, or to include additives within those presented here. Build accuracy indicates that this technology is approaching the maturity required for deployment in such sensitive applications, with further refining of the process parameters likely to leverage even greater precision. This would lead to improved consistency in micro-CT data. The minimum voxel size (1mm3) limits accuracy when selecting the region of interest. This will have caused inconsistency when selecting the region of interest, capturing different proportions of the wall (always 100% dense) and infill (varying density as per specification). Whilst this problem could be avoided by using larger parts, this also highlights the motivation of this study: to develop systems that have the capability to detect smaller-scale structural variations. Such challenges will be considered in future studies.
Disclosure statement
No potential conflict of interest was reported by the author(s).
Additional information
Funding
References
- Hafez MA, Moholkar K. Patient-specific instruments: advantages and pitfalls. Sicot J. 2017;3:66.
- Juneja M, et al. Analysis of additive manufacturing techniques used for maxillofacial corrective surgeries Proceedings of the Institution of Mechanical Engineers. J Mec Eng Sci. 2022. p 09544062221081992.
- Manero A, et al. Implementation of 3D printing technology in the field of prosthetics: past, present, and future. Int J Environ Res Public Health. 2019;16(9):1641.
- Volonghi P, Baronio G, Signoroni A. 3D scanning and geometry processing techniques for customised hand orthotics: an experimental assessment. Virtual Phys Prototyp. 2018;13(2):105–116.
- Azad MA, et al. Polymers for extrusion-based 3D printing of pharmaceuticals: a holistic materials–process perspective. Pharmaceutics. 2020;12(2):124.
- Singh D, Singh D, Han SS. 3D printing of scaffold for cells delivery: advances in skin tissue engineering. Polymers. 2016;8(1):19.
- Filippou V, Tsoumpas C. Recent advances on the development of phantoms using 3D printing for imaging with CT, MRI, PET, SPECT, and ultrasound. Med Phys. 2018;
- Caballo M, Fedon C, Brombal L, et al. Development of 3D patient-based super-resolution digital breast phantoms using machine learning. Phys Med Biol. 2018;63(22):225017.
- Anwari V, Lai A, Ursani A, et al. 3D printed CT-based abdominal structure mannequin for enabling research. 3D Print Med. 2020;6(1):3.
- D'Souza WD, Madsen EL, Unal O, et al. Tissue mimicking materials for a multi-imaging modality prostate phantom. Med Phys. 2001;28(4):688–700.
- Mackin D, et al. Measuring computed tomography scanner variability of radiomics features. Invest Radiol. 2015;50(11):757–765.
- Hernandez-Giron I, den Harder JM, Streekstra GJ, et al. Development of a 3D printed anthropomorphic lung phantom for image quality assessment in CT. Phys Med. 2019;57:47–57.
- Mahmood U, Apte A, Kanan C, et al. Quality control of radiomic features using 3D-printed CT phantoms. J Med Imaging. 2021;8(3):033505.
- Solc J, Vrba T, Burianova L. Tissue-equivalence of 3D-printed plastics for medical phantoms in radiology. J Inst. 2018;13(09):P09018–P09018.
- Yin J, Li M, Dai G, et al. 3D printed multi-material medical phantoms for needle-tissue interaction modelling of heterogeneous structures. J Bionic Eng. 2021;18(2):346–360.
- Talalwa L, Natour G, Bauer A, et al. T1-mapping and dielectric properties evaluation of a 3D printable rubber-elastomeric polymer as tissue mimicking materials for MRI phantoms. Mater Res Express. 2020;7(11):115306.
- Apte AP, Iyer A, Crispin-Ortuzar M, et al. Technical note: extension of CERR for computational radiomics: a comprehensive MATLAB platform for reproducible radiomics research. Med Phys. 2018;45(8):3713–3720.