
 ?Mathematical formulae have been encoded as MathML and are displayed in this HTML version using MathJax in order to improve their display. Uncheck the box to turn MathJax off. This feature requires Javascript. Click on a formula to zoom.
Abstract
Prolonged air leakage (AL) following pulmonary resections leads to prolonged hospital stay and post-operative complications. Intra- and postoperative quantification of AL might be useful for improving treatment decisions, but these measurements have not been characterised. AL calculations based on inspiratory and expiratory tidal volumes were investigated in an Intensive Care Unit mechanical ventilator circuit (Servo-I). AL was also measured by a digital chest drainage system. This study shows that AL measurements increase in accuracy when corrected for baseline deviations (R: 0.904 > 0.997, p < 0.001). Bland-Altman analysis revealed a funnel-shape, indicative of a detection threshhold. Corrected measurements were most accurate when averaged over five breaths and AL was >500 mL/min, with an estimated mean systemic bias of 7.4% (95%-limits of agreement [LoA]: 1.1%-13.7%) at 500 mL/min air leak. Breath-by-breath analysis showed most accurate results at AL >20 mL/breath (R: 0.989–0.991, p < 0.001) at tidal volumes between 350–600 mL. The digital drain had a mean systemic bias of −11.1% (95%-LoA: −18.9% to −3.3%) with homogenous scatter in Bland-Altman analysis and a strong correlation to the control measurement over a large range (0–2000mL/min, R: 0.999, p < 0.001). This study indicates that the Servo-I can be used for air leak quantification in clinically relevant ranges (>500 mL/min), but is unsuited for small leak detection due to a detection threshold. Researchers and clinicians should be aware of varying accuracy and interoperability characteristics between AL measurement devices.
1. Introduction
The use of pulmonary air leak (AL) measurements is increasingly being reported to predict the occurrence of prolonged pulmonary air leakage (pPAL) following lung resections [Citation1–3]. pPAL, defined as AL lasting longer than five days, affects 5.6–30% of patients [Citation4]. This increases the risk for postoperative pulmonary and pleural complications such as empyema, mortality, length of chest drainage, hospital stay, hospital costs, readmissions and reinterventions [Citation5–9]. Intraoperative AL measurements can be performed, deriving AL volumes from inspiratory (TVi) and expiratory (TVe) tidal volumes on a mechanical ventilator [Citation2,Citation3]. Postoperatively, measurements can be derived from a digital chest drainage system [Citation10].
Objective digitalised measurements of AL may standardise clinical decision-making and reduce practice variation [Citation11–13]. It offers a more reliable method of grading the severity of AL compared to conventional methods, such as the Macchiarini visual bubble scale used during water submersion tests, or the Cerfolio scale in the chest drain collection system [Citation12,Citation14,Citation15]. Few clinical studies have been performed using intraoperative AL measurements, but all seem to indicate the potential for identifying patients at risk for pPAL [Citation2,Citation3].
A risk prediction model based on calculating intraoperative AL percentage of TVi, showed that AL >9.5% is predictive of pPAL [Citation2]. Similarly, AL >500 mL/min was demonstrated to be predictive of pPAL [Citation3]. Another study showed that usage of a lung sealant based on ventilator measurements can be cost-effective [Citation11]. Conversely, in preclinical animal studies testing lung sealing interventions, AL measurements are infrequently used. However, these may be useful for improving the quality and translational value, by ensuring clinically relevant AL and a reliable AL-reduction measurement from baseline values [Citation16,Citation17].
Despite preclinical and clinical relevance of AL measurements, the accuracy, reliability and interoperability of these measurements are not well known. Some studies reported modelling of AL during non-invasive ventilation (i.e., mask), but such leaks have different mechanics and lack a closed circuit [Citation18,Citation19]. To illustrate a possible problem with AL measurements using a mechanical ventilator, consider that flow is generally measured using two separate channels for TVi and TVe. In such a setup, both measurement errors can add up when measuring AL as the difference between these volumes, and result in inaccuracies. Moreover, the measurement characteristics are selected to measure flows in the range of tidal volumes, and are not necessarily suited to detect small volumes associated with AL. Even in the context of measuring tidal volumes, a previous bench study has shown a large volume error between nine different ICU ventilators, possibly compromising interoperability of AL measurements [Citation20].
The aim of this study is to determine the most accurate AL measurement methodology, when using a ventilator. Furthermore, the accuracy of a digital chest drain system is tested.
2. Materials and methods
Experiments comparing a standardised and volumetrically calibrated AL measurement (Omron, model D6F-02A1-110, Omron Electronics, 0-2000 mL/min, accuracy ±3% and reliability ±0.3%) to four other AL measurement methodologies were performed in a mechanical ventilator (SERVO-I®, Getinge, Gotenburg, Sweden) bench setup. The tidal volumes displayed on the mechanical ventilator monitor were used: (1) average AL over one (MV1) or (2) five breathing cycles (MV5) [Citation2,Citation3]. These values are calculated within the mechanical ventilator, based on flow in the inspiratory and expiratory channels (Service Manual, Servo-I Ventilator System, Revision 02, April 2004). In order to automate data-collection and processing, continuous signals were also collected which can later be processed to calculate AL: (3) continuous flow signal analysis over a separate flow sensor placed proximal to the test lung (PROX, model SFM3300-D, Sensirion, ±250 slm, accuracy ±3%) and (4) the flow signal output of the mechanical ventilator (i.e., based on the same flow sensor as MV1 and MV5) (SERV). AL was calculated as an average flow in mL/min or in mL/breath in a breath-by-breath analysis. In addition, flow measurements provided by a digital drainage system (Thopaz®, Medela, Baar, Switzerland) are compared to the standardised AL measurement.
2.1. Measurement setup
In order to simulate AL, a bench setup with a mechanical ventilator circuit using a test lung which mimics physiological lung compliance (Delta Medick B.V., IJsselstein, the Netherlands) was used. An AL simulation side port was added right before the connection to the test lung, and all air flowing over this side port was measured directly using the Omron sensor, serving as the standard method to which the other AL quantification methods were compared. To adjust the AL magnitude, either mechanical ventilator settings determining the driving pressure (ΔP) or the configuration of the tubes determining the resistance (R) were adjusted. The same principle was used for the digital drain system validation setup. The experimental setups are shown in and all settings and configurations used for the measurements are shown in . In configuring the standardised resistance and mechanical ventilator settings, AL was ensured to be below 2000 ml/min, to stay within the critical measurement limits of the Omron flow sensor.
Figure 1. Experimental setup. (A) Schematic of mechanical ventilation circuit (S = proximal flow sensor [PROX], O = standardised air leak detection flow sensor [omron], R = resistance) and (B) photograph of the relevant connections. The standard resistance trough the AL side port is formed by four three-way luer locks and a one-way valve. The thin piece of tubing (white arrow) is swapped out to configure the resistance (). (C) Schematic and (D) photograph of the thopaz® setup. The standard resistance consists of three three-way luer locks and the thin piece of tubing (white arrow) is swapped out to configure the resistance ().
![Figure 1. Experimental setup. (A) Schematic of mechanical ventilation circuit (S = proximal flow sensor [PROX], O = standardised air leak detection flow sensor [omron], R = resistance) and (B) photograph of the relevant connections. The standard resistance trough the AL side port is formed by four three-way luer locks and a one-way valve. The thin piece of tubing (white arrow) is swapped out to configure the resistance (Table 1). (C) Schematic and (D) photograph of the thopaz® setup. The standard resistance consists of three three-way luer locks and the thin piece of tubing (white arrow) is swapped out to configure the resistance (Table 1).](/cms/asset/7905207c-bb78-4437-941e-9002ab0e73bc/ijmt_a_2381540_f0001_c.jpg)
Table 1. Measurement configurations.
2.2. Measurement protocol
Firstly, to explore measurement characteristics, various settings were tested for each measurement method, calculating AL in mL/min for 10 measurements per settings and 60 s per measurement unless otherwise stated. During each measurement cycle, baseline measurements were first acquired with AL side port closed, followed by AL simulation. Secondly, AL was recorded in mL/breath comparing the mechanical ventilator monitor readings to the Omron measurement for 30 breaths per setting. Finally, aerostatic efficacy outcomes were measured. AL-reduction was measured on the mechanical ventilator by measuring baseline, AL and reduced AL (extra resistance component).
For the digital drain system measurements, three separate calibrated drainage devices were evaluated at 9 measurements each (supplemental material A). At each setting, the system was first allowed to stabilise, after which the flow was observed from the monitor, and the Omron sensor was used to measure for 30 s. Before every experiment, airtightness was ensured by applying soap solution on all made connections, with system pressures exceeding those of the intended protocol settings. The protocol settings are listed in .
2.3. Data-acquisition
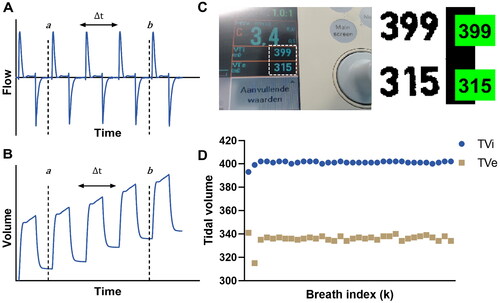
For the Omron measurement, sensor output is recorded into Simulink, Matlab (version R2020/2021a). Tidal volumes displayed on the mechanical ventilator monitor were manually noted for the MV1 and MV5 measurements. To ensure repeatable measurements, the mechanical ventilator internal calibration was executed before every series of measurements, and compensation for compressible volume was always turned on. During breath-by-breath acquisition from the mechanical ventilator monitor, a custom optical character recognition (OCR) algorithm was developed using Matlab (, supplemental material A). The PROX and SERV measurement output is acquired using dedicated software (ControlCenter and ServoTracker respectively), and the SERV output is additionally recorded into the Simulink model. For digital drain system measurements, the flow values are noted from the monitor once a stable value is reached (displayed in 10 ml steps at 0–1000 mL/min and 100 ml steps at >1000 mL/min). Data-acquisition details and calibrations are described in the supplemental material (A).
Figure 2. (A,B) Representative example of the air leak calculations from a flow signal (A) using a cumulative integral (B). In selecting the measurement period, care is taken that both the start and end indices are either at a local maxima or local minima. C) Screenshot from the control algorithm of the custom built OCR application, allowing for breath by breath analysis. Values in green boxes are calculated by the algorithm and checked for correctness by the experiment executor, and stored per breath to allow continuous monitoring (D).
2.4. Data processing
Data processing was performed using Matlab (version R2021a). AL (mL/min) was calculated from the mechanical ventilator monitor as:
(1)
(1)
where k denotes the breath index, n the number of breaths used for the average and f the respiratory frequency in breaths/min. MV1 and MV5 were calculated for n = 1 and n = 5, respectively [Citation3]. AL (in mL/min) was derived from the Omron, PROX and SERV flow signals (
) using the following calculation:
(2)
(2)
The integral was calculated using the “cumulative numeric trapezoid integral” function in Matlab, and the measurement interval (a, b) was manually selected, from which was derived (). In the breath-by-breath analysis protocol, a peak detection algorithm using Matlab was used to identify individual breaths for AL calculation. The PROX sensor measured flow in standard litres per minute (
), which was corrected to give a volumetric flow measure at ambient temperature (
) for comparison to the other measures, using the following formula:
(3)
(3)
where T is the mean temperature acquired by the flow sensor over the measurement period in Kelvin. The pressure changes during mechanical ventilation around atmospheric pressure were excluded from this calculation, as they were calculated to be negligible in the combined gas law. AL values were also corrected for baseline measurements as:
(4)
(4)
AL percentage per breath of TVi was calculated as[Citation2]:
(5)
(5)
2.5. Statistical analysis
Statistical analysis was performed using IBM SPSS Statistics for Windows, Version 26.0 (Armonk, New York; IBM Corp). Measurement accuracy was assessed by comparing differences to the control measurement (Omron). Correlations were computed using Pearson’s R and statistically compared using a web-based tool of the cocor R package [Citation21,Citation22]. Measurement precision was assessed by computing a mean centred coefficient of variation. Statistical comparisons for AL accuracy and precision were performed using an ANOVA and Tukey’s post-hoc test. For AL-reduction, variances were compared using Levene’s test and differences versus Omron with a one-sample t-test, and both adjusted for multiple testing using a Bonferroni-Holm method [Citation23]. Tests are performed two-tailed with α = 0.05. In the breath-by-breath analysis, linear regression fits were calculated using Matlab (version R2021a, supplemental material B). Bland-Altman plots were generated using Graphpad Prism 9. In case of an inhomogeneous scatter, the limits of agreement (LoA) were estimated based on a variable variance function developed in Matlab for this purpose (supplemental material B).
3. Results
3.1. Air leak measurements using mechanical ventilator
Direct AL measurement was performed with the volumetrically calibrated Omron sensor over a range of 168–941 ml/min, with a low coefficient of variation (CV) (mean: 0.011, 95%-CI: 0.002–0.021), indicating high measurement precision and supporting its use as control to other methods. The accuracy of the mechanical ventilator methods varied based on the measurement protocol used (). Correction for baseline measurements (see Equationequation 4(4)
(4) ) resulted in a significantly improved correlation between Omron and MV1 (R: 0.901 > 0.974, p < 0.001), MV5 (R: 0.904 > 0.997, p < 0.001), PROX (R: 0.876 > 0.951, p < 0.001), but not for SERV (R: 0.823 > 0.849, p = 0.39). Correction for baseline also significantly increased precision in PROXc (p = 0.023) and SERVc (p = 0.025), but not MV1c (p = 0.608) and MV5c (p = 0.487). The correlation between Omron and MV5c (R: 0.997) was significantly stronger compared to MV1c (R: 0.974, p < 0.001), PROXc (R: 0.951, p < 0.001) and SERVc (R: 0.849, p < 0.001).
Figure 3. (A,C) Difference of mechanical ventilator methods versus omron, uncorrected (A) and corrected (C) for baseline deviations. (B,D) Bland-altman plots of MV1c and MV5c versus omron, which are both corrected for baseline deviations. MV: mechanical ventilator, PROX: proximal flow sensor, SERV: SERVO-I® mechanical ventilator flow signal analysis, c: corrected for baseline deviations, SL: small leak settings, BL: big leak settings, LoA: limits of agreement. Legend of figure A/C correspond to the various measurement protocols and leakage scenario’s used (see for specifications).
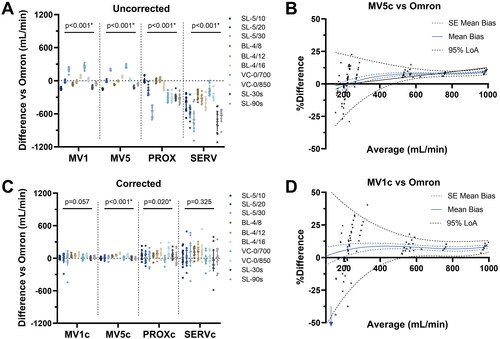
MV1 and MV5 are both based on the tidal volumes displayed on the mechanical ventilator, and show the highest measurement precision of all methods. MV5c showed the highest precision (CV mean: 0.076, 95%-CI: 0.039–0.113), which was significantly better compared to PROXc (CV mean 0.279, 95%-CI 0.152–0.406, p = 0.042) and SERVc (CV mean: 0.431, 95%-CI: 0.244–0.618, p < 0.001), but not compared to MV1c (CV mean: 0.108, 95%-CI 0.054–0.161, p = 0.97). MV1c was also more precise compared to SERVc (p < 0.001), but not PROXc (p = 0.108). Bland-Altman plots of MV1c and MV5c (corrected for baseline deviations) revealed an inhomogeneous scatter with a funnel shape, with wider LoA at lower averages (). At 500 ml/min average AL, the estimated mean bias compared to Omron was 7.4% (estimated 95% LoA 1.1%-13.7%) for MV5c.
3.2. Mechanical ventilator breath-by-breath analysis
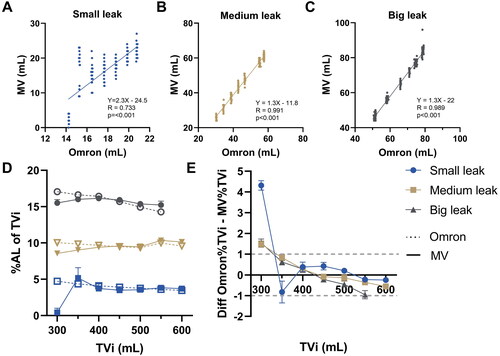
Since continuous flow signal methods (PROX and SERV) were less precise, these were not used for breath-by-breath analysis. OCR was used for continuous data-acquisition of the mechanical ventilator readings, showing strong and statistically significant correlation with Omron over all settings (R: 0.985, p < 0.001). Upon subgroup-analysis, correlations (Pearson’s R) were found significantly stronger for medium (R: 0.991, p < 0.001) and large leak (R: 0.989, p < 0.001) settings, corresponding to >20 mL AL/per breath, compared to small leak settings (R: 0.733). Measurement of AL between ∼5% and ∼15% of the TVi were found to be accurate within ∼1% of the tidal volume between 350–600ml TVi ().
Figure 4. Breath-by-breath analysis results (A–C) correlation between standardised AL measurements and the mechanical ventilator readings (D) calculated AL percentage of inspiratory tidal volume (TVi) for standardised measurement (Omron) versus the mechanical ventilator readings (MV) and (E) absolute differences based on D. Dotted lines show borders for ± 1% absolute difference.
3.3. Aerostatic efficacy outcome measures
Omron measured an AL reduction of 47.9% (95%-CI: 47.4–48.4%) with a low CV (0.015). When uncorrected for baseline deviations, AL reduction was significantly different between Omron and MV1 (mean −11.5%, 95%-CI −13.8- −9.3%, p = 0.004), MV5 (mean −10.9%, 95%-CI −11.9- −9.9%, p = 0.003) and SERV (mean −118.8%, 95%-CI −160.6- −77.1%, p = 0.002) (). When corrected for baseline, there were no significant differences (). Consistent with prior results, the highest precision was found for MV5c (48.8 ± 0.9%, CV: 0.018) versus MV1c (49.2 ± 3.0%, CV: 0.062, p = 0.03), PROXc (50.9 ± 9.2%, CV: 0.181, p = 0.008) and SERVc (47.1 ± 20.6%, CV: 0.437, p = 0.005).
Figure 5. (A,B) Air leak reduction (ALreduc%) measurements comparison, standardised measurement (Omron) versus mechanical ventilator methods, uncorrected (A) and corrected (B) for baseline deviations. C) Correlation between digital chest drain readings and standardised flow measurements, each line corresponding to a unique drainage system (N = 3). D) Bland-Altman analysis of digital chest drain readings, showing a homogenous scatter. *N = 2 outliers excluded for construction of mean and limits of agreement.
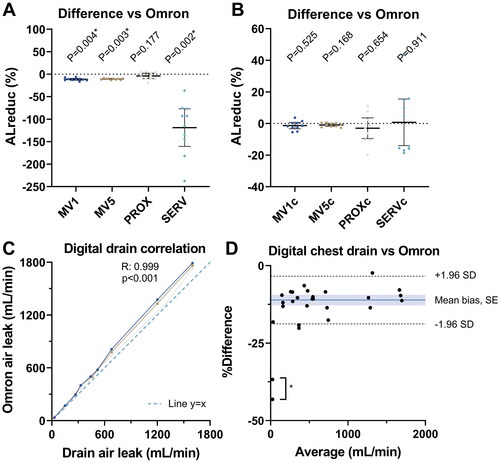
The digital chest drain system was found to have a strong and significant correlation to Omron over a measurement range of 0–2000 mL/min (R: 0.999, p < 0.001). In the Bland-Altman analysis for the digital drain, a mean systemic bias compared to Omron of −11.1% (95% LoA: −18.9% to −3.3%) with homogeneous scatter was observed ().
4. Discussion
In this study, we measured AL using several methods, comparing their measurement characteristics. We demonstrate that AL calculations based on flow signal analysis methods (PROX and SERV) were less precise compared to tidal volume data displayed on the mechanical ventilator monitor. Breath-by-breath analysis indicated most accurate measurements when the AL is >20 mL/breath, in tidal volume ranges of 350 to 600 ml. Measurement of smaller AL resulted in inaccurate measurements, indicative of a detection threshold. Correction for baseline deviations was shown to improve the accuracy of AL measurements.
4.1. Interpretation of results
The direct AL measurement Omron has been volumetrically calibrated and shows a high measurement precision, and is therefore suited as a control for the other methods that were used. Methods based on the tidal volumes displayed on the mechanical ventilator (MV1 and MV5) show the highest measurement precision of all methods. In this regard, MV1 is more sensitive to outliers compared to MV5, due to averaging over less breaths. PROX measures tidal flow proximal to the endotracheal tube in both directions, but was found to have a lower precision compared to MV5. Similarly, SERV calculations were based on tidal flow data extracted from the mechanical ventilator, but these also showed significantly lower precision compared to MV5. Continuous measurement over longer durations for PROX/SERV (30 s vs 90 s) don’t seem to clearly increase precision or accuracy (). An advantage of flow signal analysis methods is that large amounts of data can readily be acquired, which was also achieved in these experiments using a custom OCR tool on the mechanical ventilator screen in the breath-by-breath analysis. Finally, the digital chest drainage system was found to result in reliable measurements of AL, with a systemic measurements bias that should be addressed based on the gas flow measurement conditions and conventions used.
The MV5 measurement exhibits a detection threshold, below which it is unsuited to detect the presence of, or rule out small AL. Based on the breath-by-breath analysis, this threshold lies around 20 ml/breath. This is likely explained by measurement errors of the inspiratory and expiratory flow channels exceeding the magnitude of the AL. Computer simulations support this hypothesis, revealing a similar funnel shape as seen in the experimental data (supplemental material C). Thus, for the purpose of intraoperative detection of AL, other techniques are required. Most commonly, a water submersion test is used, but this has disadvantages during thoracoscopic surgery due to limited vision. Here, novel methods such as CO2 insufflation or indocyanine green aerosols may provide a better alternative [Citation24,Citation25].
The MV5 measurement can be used for AL quantification and thus stratification of risk groups based on AL size. However, AL still need to surpass the detection threshold associated with mechanical ventilator measurements. A recent Delphi study proposed classification of mild (100 ml/min), moderate (100–400 mL/min) and severe (>400 mL/min) AL [Citation1]. Depending on the respiratory rate and AL/breath, mild and moderate AL might be difficult to distinguish, but severe AL should be accurately identifiable. This should also be the case for the AL magnitudes of >500 mL/min or >9.5% of TVi that were previously found predictive of pPAL [Citation2,Citation3].
When using different methods for AL characterisation and risk prediction, an empirical correction factor is required and should be obtained for different devices. As we have shown in comparison to Omron, the MV5 method might overestimate AL ∼10%, depending on the AL size, while the digital drainage system might underestimate AL ∼10%, independent of the AL size. Additionally, previous literature shows a large variability for different mechanical ventilators or measurement methods when quantifying tidal volumes [Citation20,Citation26]. It is important that researchers and clinicians use the same calibrations and definitions for AL, to ensure global interoperability between devices, hospitals and research findings.
AL can accurately be measured in an automated fashion, which can easily be implemented in present experimental studies using a simple OCR setup. Experimental studies investigating lung sealing devices and quantifying AL as outcome measure are scarce, while this outcome measure is of high clinical relevance for measuring aerostatic efficacy [Citation17,Citation27,Citation28]. Failure to use clinically relevant outcome measures might contribute to poor translational power of animal studies, raising ethical concerns [Citation29]. This digitalised method is advantageous over methods used previously, such as a water displacement method or aspiration of air from plastic bags using syringes, by reducing inter-observer variability [Citation16,Citation30,Citation31]. Other ex-vivo experimental studies have described AL quantification systems, which may be useful for validating further AL measurement methodologies [Citation32,Citation33].
4.2. Clinical implications
Clinical studies investigating lung sealing devices may benefit from accurate measurement of AL, by improving objective subject recruitment. This possibility has been shown in a recent clinical trial, using a standardised mechanical ventilator test and only applying lung sealants to AL 150-400 mL/min or to AL >400 mL/min that were downgraded first using sutures and staplers, showing cost-effective use [Citation11]. No such positive effect was observed in a retrospective study with the same lung sealant, in which no selection algorithm was applied [Citation34]. Another trial used intra-operative AL severity criteria, but based on the visual Macchiarini air bubble scale [Citation35]. This is more prone to inter-observer variability and can thus be improved using AL quantification methods.
The current model uses an AL simulation side port right before the connection to the test lung. When translating the present experimental findings to a clinical surgical setting, several technical factors should be considered. First of all, the system should be free of leaks, except for the leak of the lung. For this, all external connections should be checked carefully and the cuff pressure of the endotracheal tube should be at least above the peak ventilation pressure. However, a constant leak originating from elsewhere may also be solved by continuous measurements and correcting AL for baseline deviations. Secondly, respiratory mechanics may influence AL in the clinical setting. When atelectasis is still being reduced, the TVi will be increased compared to the TVe as a consequence of the inflation of previously collapsed alveoli, overestimating the actual AL. The inverse is true when trapped air escapes from the lung. Therefore, a state of stable respiration should first be reached, for instance using recruitment manoeuvres during lung reinflation after surgery. In this case, care should be taken not to apply excessive pressure since this may worsen the air leak. Finally, the AL should preferably be measured over a standardised interval of at least five breaths such as in MV5, with standardised settings, to prevent influence form outliers and errors, thus providing the highest accuracy [Citation3,Citation36].
When measuring gas flow under clinical conditions, the measurement characteristics may theoretically vary up to ∼10% due to the combined gas laws, if unaccounted for. In the mechanical ventilator-patient-drain interface, temperature and pressure are never constant, and therefore the volume of air may vary accordingly. The following equation is derived from the combined gas law:
(6)
(6)
Assuming the highest pressure conditions (ΔP = 40cmH2O = 0.0387 atm, P1=1atm) and lowest temperature conditions (ΔT=–17K, T1=310.15K) in the physiological patient/machine interface[Citation37], we calculate the highest value of V2/V1 to be 91%. To improve interoperability between different measurements in this context, values of all devices should be normalised by also measuring temperature and pressure, using the same conventions.
4.3. Limitations
As with all bench studies, the findings might not generalise to clinical situations, and should be further investigated in ventilated lungs. Further research designs could include ex-vivo setups (e.g., using similar AL quantification system as in the model of Klassen) or a clinical study where AL measured over digital chest drainage is correlated to mechanical ventilator measurements in a short interval after lung surgery [Citation33]. Furthermore, these findings might not translate to other devices using different sensors. Measurement characteristics should be attained empirically, to allow for accurate and interoperable use. The standardised flow sensor used for comparison in this study has a high reliability, and is therefore most suited to assess the precision of the AL measurement. The flow sensor was calibrated to measure standard volumes of air under ambient conditions, which may not be the best method for assessing validity. This should be improved by applying standardised normalisation conventions using temperature and pressure measurements.
4.4. Future perspective
This study provides an experimental and theoretical basis for further development of intraoperative AL quantification algorithms. Accurate detection of AL with the mechanical ventilator should be ensured by standardised settings and intervals, stable respiration, normalisation and suited sensors (i.e., low measurement error). Continuous measurements may improve measurement accuracy, by providing a baseline correction capability. Prediction models for pPAL based on pre- and intraoperative characteristics should be further developed to allow for an integrated digital system which can be used to aid in surgical decision-making [Citation2,Citation11,Citation38].
Conclusion
In conclusion, AL quantification can be reliably performed based on tidal volume data on the SERVO-I® mechanical ventilator within certain tidal volume ranges (350–600 mL), in AL >20 mL/breath. To measure smaller AL values and overcome the detection threshold using a mechanical ventilator, flow sensors with smaller measurement errors are required.
Geolocation information
Nijmegen, The Netherlands
Supplement_JMET.docx
Download MS Word (1.2 MB)Acknowledgements
The authors would like to thank René van der Burgt and Timo Bogaarts for help conceptualizing the air leak measurements and Joris Kleinhans, Tonny Langeveld, Raymond Rikken, Marco Severein and Ben Pronk for their technical support. Furthermore, the authors want to thank Juul van Lin and Michael Romijn for help executing the experimental measurement protocols.
Disclosure statement
The authors report there are no competing interests to declare.
Data availability statement
The data underlying this article will be made available by the authors upon reasonable request.
Additional information
Funding
References
- Zaraca F, Brunelli A, Pipitone MD, et al. A Delphi Consensus report from the "Prolonged Air Leak: a Survey" study group on prevention and management of postoperative air leaks after minimally invasive anatomical resections. Eur J Cardiothorac Surg. 2022 Aug 3;62(3):ezac211.
- Kim WH, Lee HC, Ryu HG, et al. Intraoperative ventilatory leak predicts prolonged air leak after lung resection: a retrospective observational study. PLoS One. 2017;12(11):e0187598. doi:10.1371/journal.pone.0187598.
- Brunelli A, Salati M, Pompili C, et al. Intraoperative air leak measured after lobectomy is associated with postoperative duration of air leak. Eur J Cardiothorac Surg. 2017;52(5):963–968. doi:10.1093/ejcts/ezx105.
- Attaar A, Tam V, Nason KS. Risk factors for prolonged air leak after pulmonary resection: a systematic review and meta-analysis. Ann Surg. 2020;271(5):834–844. doi:10.1097/SLA.0000000000003560.
- Liang S, Ivanovic J, Gilbert S, et al. Quantifying the incidence and impact of postoperative prolonged alveolar air leak after pulmonary resection. J Thorac Cardiovasc Surg. 2013;145(4):948–954. doi:10.1016/j.jtcvs.2012.08.044.
- Brunelli A, Xiume F, Al Refai M, et al. Air leaks after lobectomy increase the risk of empyema but not of cardiopulmonary complications: a case-matched analysis. Chest. 2006;130(4):1150–1156. doi:10.1378/chest.130.4.1150.
- Yoo A, Ghosh SK, Danker W, et al. Burden of air leak complications in thoracic surgery estimated using a national hospital billing database. Clinicoecon Outcomes Res. 2017;9:373–383. doi:10.2147/CEOR.S133830.
- Brunelli A, Chapman K, Pompili C, et al. Ninety-day hospital costs associated with prolonged air leak following lung resection. Interact Cardiovasc Thorac Surg. 2020;31(4):507–512. doi:10.1093/icvts/ivaa140.
- Attaar A, Luketich JD, Schuchert MJ, et al. Prolonged air leak after pulmonary resection increases risk of noncardiac complications, readmission, and delayed hospital discharge: a propensity score-adjusted analysis. Ann Surg. 2021;273(1):163–172. doi:10.1097/SLA.0000000000003191.
- Goto M, Aokage K, Sekihara K, et al. Prediction of prolonged air leak after lung resection using continuous log data of flow by digital drainage system. Gen Thorac Cardiovasc Surg. 2019;67(8):684–689. doi:10.1007/s11748-019-01073-y.
- Zaraca F, Vaccarili M, Zaccagna G, et al. Cost-effectiveness analysis of sealant impact in management of moderate intraoperative alveolar air leaks during video-assisted thoracoscopic surgery lobectomy: a multicentre randomised controlled trial. J Thorac Dis. 2017;9(12):5230–5238. Dec doi:10.21037/jtd.2017.11.109.
- Chang PC, Chen KH, Jhou HJ, et al. Promising effects of digital chest tube drainage system for pulmonary resection: a systematic review and network meta-analysis. J Pers Med. 2022;12(4):512. doi:10.3390/jpm12040512.
- Hoeijmakers F, Hartemink KJ, Verhagen AF, et al. Variation in incidence, prevention and treatment of persistent air leak after lung cancer surgery. Eur J Cardiothorac Surg. 2021;61(1):110–117. doi:10.1093/ejcts/ezab376.
- Macchiarini P, Wain J, Almy S, et al. Experimental and clinical evaluation of a new synthetic, absorbable sealant to reduce air leaks in thoracic operations. J Thorac Cardiovasc Surg. 1999;117(4):751–758. Apr doi:10.1016/S0022-5223(99)70296-5.
- Cerfolio RJ, Bass C, Katholi CR. Prospective randomized trial compares suction versus water seal for air leaks. Ann Thorac Surg. 2001;71(5):1613–1617. doi:10.1016/s0003-4975(01)02474-2.
- Ranger WR, Halpin D, Sawhney AS, et al. Pneumostasis of experimental air leaks with a new photopolymerized synthetic tissue sealant. Am Surg. 1997;63(9):788–795. Sep
- McCarthy PM, Trastek VF, Bell DG, et al. The effectiveness of fibrin glue sealant for reducing experimental pulmonary ari leak. Ann Thorac Surg. 1988;45(2):203–205. Feb doi:10.1016/s0003-4975(10)62438-1.
- Rodrigues GG, Freitas US, Bounoiare D, et al. Leakage estimation using kalman filtering in noninvasive mechanical ventilation. IEEE Trans Biomed Eng. 2013;60(5):1234–1240. doi:10.1109/TBME.2012.2230630.
- Vicario F, Alkhairy S, Buizza R, Truschel WA, editors. Two-parameter leak estimation in non-invasive ventilation. In: 2017 39th Annual International Conference of the IEEE Engineering in Medicine and Biology Society (EMBC). 2017. doi:10.1109/EMBC.2017.8036785.
- Lyazidi A, Thille AW, Carteaux G, et al. Bench test evaluation of volume delivered by modern ICU ventilators during volume-controlled ventilation. Intensive Care Med. 2010;36(12):2074–2080. doi:10.1007/s00134-010-2044-9.
- Diedenhofen B, Musch J. cocor: A Comprehensive Solution for the Statistical Comparison of Correlations. PLoS One. 2015;10(3):e0121945. doi:10.1371/journal.pone.0121945.
- Diedenhofen B. Cocor comparing correlations. 2015. http://comparingcorrelations.org/.
- Aickin M, Gensler H. Adjusting for multiple testing when reporting research results: the Bonferroni vs Holm methods. Am J Public Health. 1996;86(5):726–728. 1996/05/01 doi:10.2105/ajph.86.5.726.
- Kang DY. Intraoperative air leak site detection in spontaneous pneumothorax through carbon dioxide insufflation during thoracoscopic surgery. Surg Endosc. 2020;34(1):312–316. doi:10.1007/s00464-019-06768-0.
- Yokota N, Go T, Fujiwara A, et al. A new method for the detection of air leaks using aerosolized indocyanine green. Ann Thorac Surg. 2021;111(2):436–439. Feb doi:10.1016/j.athoracsur.2020.05.103.
- Roesthuis LH, van der Hoeven JG, Guérin C, et al. Three bedside techniques to quantify dynamic pulmonary hyperinflation in mechanically ventilated patients with chronic obstructive pulmonary disease. Ann Intensive Care. 2021;11(1):167. doi:10.1186/s13613-021-00948-9.
- Zhang R, Bures M, Höffler K, et al. In vitro comparison of two widely used surgical sealants for treating alveolar air leak. Thorac Cardiovasc Surg. 2014;62(8):705–709. doi:10.1055/s-0034-1389272.
- Belda-Sanchis J, Serra-Mitjans M, Iglesias Sentis M, et al. Surgical sealant for preventing air leaks after pulmonary resections in patients with lung cancer. Cochrane Database Syst Rev. 2010;20(1):Cd003051.
- van der Worp HB, Howells DW, Sena ES, et al. Can animal models of disease reliably inform human studies? PLoS Med. 2010;7(3):e1000245. doi:10.1371/journal.pmed.1000245.
- Kjaergard HK, Pedersen JH, Krasnik M, et al. Prevention of air leakage by spraying vivostat fibrin sealant after lung resection in pigs. Chest. 2000;117(4):1124–1127. Apr doi:10.1378/chest.117.4.1124.
- Araki M, Tao H, Sato T, et al. Creation of a uniform pleural defect model for the study of lung sealants. J Thorac Cardiovasc Surg. 2007;134(1):145–151. Jul doi:10.1016/j.jtcvs.2007.01.007.
- Eckert CE, Harris JL, Wong JB, et al. Preclinical quantification of air leaks in a physiologic lung model: effects of ventilation modality and staple design. Med Devices. 2018;11:433–442. doi:10.2147/MDER.S184851.
- Klassen C, Eckert CE, Wong J, et al. Ex vivo modeling of perioperative air leaks in porcine lungs. IEEE Trans Biomed Eng. 2018;65(12):2827–2836. doi:10.1109/TBME.2018.2819625.
- Gologorsky RC, Alabaster AL, Ashiku SK, et al. Progel use is not associated with decreased incidence of postoperative air leak after nonanatomic lung surgery. Perm J. 2019;23:18–059. doi:10.7812/TPP/18-059.
- Anegg U, Lindenmann J, Matzi V, et al. Efficiency of fleece-bound sealing (TachoSil) of air leaks in lung surgery: a prospective randomised trial. Eur J Cardiothorac Surg. 2007;31(2):198–202. Feb doi:10.1016/j.ejcts.2006.11.033.
- Zaraca F, Vaccarili M, Zaccagna G, et al. Can a standardised Ventilation Mechanical Test for quantitative intraoperative air leak grading reduce the length of hospital stay after video-assisted thoracoscopic surgery lobectomy? J Vis Surg. 2017;3:179–179. doi:10.21037/jovs.2017.11.02.
- Marini JJ. Recruitment by sustained inflation: time for a change. Intensive Care Med. 2011;37(10):1572–1574. doi:10.1007/s00134-011-2329-7.
- Pompili C, Falcoz PE, Salati M, et al. A risk score to predict the incidence of prolonged air leak after video-assisted thoracoscopic lobectomy: An analysis from the European Society of Thoracic Surgeons database. J Thorac Cardiovasc Surg. 2017;153(4):957–965. Apr doi:10.1016/j.jtcvs.2016.11.064.