
 ?Mathematical formulae have been encoded as MathML and are displayed in this HTML version using MathJax in order to improve their display. Uncheck the box to turn MathJax off. This feature requires Javascript. Click on a formula to zoom.
ABSTRACT
The hot loop structures in the solar corona can be well modelled by three-dimensional magnetohydrodynamic simulations, where the corona is heated by field line braiding driven at the photosphere. To be able to reproduce the emission comparable to observations, one has to use realistic values for the Spitzer heat conductivity, which puts a large constraint on the time step of these simulations and make them therefore computationally expensive. Here, we present a non-Fourier description of the heat flux evolution, which allows us to speed up the simulations significantly. Together with the semi-relativistic Boris correction, we are able to limit the time step constraint of the Alfvén speed and speed up the simulations even further. We discuss the implementation of these two methods to the Pencil Code and present their implications on the time step, and the temperature structures, the ohmic heating rate and the emission in simulations of the solar corona. Using a non-Fourier description of the heat flux evolution together with the Boris correction, we can increase the time step of the simulation significantly without moving far away from the reference solution. However, for values of the Alfvén speed limit of 3000 and below, the simulation moves away from the reference solution and produces much higher temperatures and much structures with stronger emission.
1. Introduction
The solar corona can be described as a low β plasma at low densities and high temperatures. With the presence of coronal magnetic fields, this leads to plasma, where the magnetic pressure is higher than the gas pressure. Therefore, the plasma motions are dominated by the magnetic field, and the plasma can organise itself in accordance to the geometry of the magnetic field, e.g. closed loop structures. The hot plasma in the corona emits radiation in extreme UV and X-ray emission, making it observable from space-based telescopes. One of the major open questions concerning the solar corona is its heating mechanism, i.e. why is the solar corona typically more than 100 times hotter than the photosphere. One of the ideas explaining coronal heating is the field-line braiding model by Parker (Citation1972, Citation1988), in which magnetic energy is released in form of nanoflares. In this model, the magnetic footpoints of the loops are irreversibly moved by the small-scale photospheric motions, get braided in chromosphere and corona, where the reconnecting field lines release magnetic energy through ohmic heating and contribute to the thermal energy budget.
Three-dimensional magnetohydrodynamic simulations modelling the solar corona were able to show that with this nanoflare heating mechanism the basic temperature structure and its dynamics can be reproduced (e.g. Gudiksen and Nordlund Citation2002, Citation2005b, Bingert and Peter Citation2011). These models are able to describe energy transport to the corona consistent with the nanoflare model (Bingert and Peter Citation2013). These types of simulations are further used to synthesise coronal emission comparable with actual observations of the corona. From these synthesised emissions, one finds that these models are able to reproduce the average Doppler shifts to some extent (Peter et al. Citation2004, Citation2006, Hansteen et al. Citation2010) and the formation of coronal loops, when using a data driven model with an observed photospheric magnetic field (Bourdin et al. Citation2013, Citation2014, Warnecke and Peter Citation2019). Furthermore, these models were used to show that the coronal magnetic field structure is close to a potential field (Gudiksen and Nordlund Citation2005b, Bingert and Peter Citation2011, Bourdin et al. Citation2018), and therefore nearly force free. However, the force-free approximation, broadly used to obtain coronal magnetic field with field extrapolations (for a review, we refer to Wiegelmann Citation2008), turns out to be not always valid (Peter et al. Citation2015) and fails to describe complex current structures in coronal loops above emerging active regions (Warnecke et al. Citation2017). Recently, Rempel (Citation2017) showed that the solar corona can be heated by a small-scale dynamo operating in the near-surface region of the convection zone braiding the magnetic footpoints in the photosphere. Therefore, these types of models are able to reproduce the main properties of the solar corona on the resolved scale (e.g. Peter Citation2015). One of the most important ingredients is the vertical Poynting flux at the bottom of the corona (e.g. Galsgaard and Nordlund Citation1996, Bingert and Peter Citation2011, Bourdin et al. Citation2015).
Currently there are only a limited number of codes available which are used for this kind of simulations. One of the most used codes to simulate the solar corona is the Bifrost code (Gudiksen et al. Citation2011), which is based on earlier work of Gudiksen and Nordlund (Citation2002, Citation2005b, Citation2005a) and the Stagger code (Galsgaard and Nordlund Citation1996). In these simulations, the near-surface convection is self-consistently included and produces realistic photospheric velocities. Furthermore, the Bifrost code includes a realistic treatment of the chromosphere using a non-local thermal equilibrium description. Another code is the MuRAM code (Vögler et al. Citation2010, Rempel Citation2014) that has been recently extended to the upper atmosphere (Rempel Citation2017). Also, there, the photospheric motions are driven by near-surface convection. Apart of these codes there are other codes used for realistic modelling of the solar corona (e.g. Mok et al. Citation2005, Citation2008, Abbett Citation2007, van der Holst et al. Citation2014).
In this paper, we present an extension to the coronal model of the Pencil CodeFootnote1 that has been used successfully to describe the solar corona using either observed magnetograms and a velocity driver mimicking the photospheric motions (Bingert and Peter Citation2011, Citation2013, Bourdin et al. Citation2013) or flux emergence simulations (Chen et al. Citation2014, Citation2015) as input at the lower boundary instead of simulating the near-surface convection. However, Chatterjee (Citation2018) developed a 2D model, where the near-surface convection is included with a realistic treatment of the solar corona. Simplified two-layer simulations of the convection zone and the corona of the Sun and stars using the Pencil Code have been successfully used to investigate the dynamo-corona interplay (Warnecke and Brandenburg Citation2014, Warnecke et al. Citation2016a), to self-consistently drive current helicity ejection into the corona (Warnecke and Brandenburg Citation2010, Warnecke et al. Citation2011, Citation2012a, Citation2013a) and the formation of sunspot-like flux concentrations (Warnecke et al. Citation2013b, Citation2016b, Losada et al. Citation2019).
To be able to compare the simulations of the solar corona with observations of emissivities, one needs to use a realistic value of the Spitzer heat conductivity. However, this puts a major constraint on the time step in these simulations. For simulations with a grid spacing of around 200 km the time step due to the Spitzer heat conductivity is around 1 ms. However, this can be significant lower, if one does not limit the diffusion speed by the speed of light. If one wants to study the dynamics on smaller scales and being able to reduce the fluid and magnetic diffusivities, one needs to use a higher resolution. The smaller grid spacing leads to even lower values of the time step. As the time step decreases quadratically with the grid spacing, the simulations become unfeasible for very high resolutions. To circumvent this, Chen et al. (Citation2014), for example, used a sub-stepping scheme and Rempel (Citation2017) used a non-Fourier scheme, where the hyperbolic equation for the heat transport is solved. Similar approaches have also been used in the dynamo community to describe the non-local evolution of the turbulent electromagnetic force (Brandenburg et al. Citation2004, Hubbard and Brandenburg Citation2009, Rheinhardt and Brandenburg Citation2012, Brandenburg and Chatterjee Citation2018). We present here a non-Fourier description of the Spitzer heat flux that has been recently implemented to the Pencil Code, see section 2.2. We compare the outcome of the simulations obtained with and without the non-Fourier scheme, see section 3. Furthermore, we also compare these simulations to those using the semi-relativistic Boris correction (Boris Citation1970) to the Lorentz force that has been also recently implemented to the Pencil Code (Chatterjee Citation2018) to limit the time step constraint due to the Alfvén speed, see section 2.3.
2. Setup
The setup of the simulations is based on the model of Bingert and Peter (Citation2011, Citation2013), therefore a detailed description will not be repeated here. We model a part of the solar corona in a Cartesian box (x,y,z) of Mm
using a uniform grid. The z = 0 layer represents the solar photosphere. We use
grid points, corresponding to a resolution of
in the horizontal
in the vertical direction. We solve the compressible magnetohydrodynamic equations for the density ρ, the velocity
, the magnetic vector potential
and the temperature T.
(1)
(1)
(2)
(2)
(3)
(3)
where we use a constant gravity
with g = 274 m/s
, a rate of strain tensor
and a constant viscosity ν throughout the domain. Additionally we use a shock viscosity to resolve shocks formed by high Mach number flows (see Haugen et al. Citation2004, Gent et al. Citation2013 for details regarding its implementation). The pressure
is given by the equation of state of an ideal gas, where
, μ and
are the Boltzmann constant, the molecular weight and the proton mass, respectively. The corresponding adiabatic index
is 5/3 for a fully ionised gas, with the specific heats at constant pressure
and constant volume
. The heat flux
is given by anisotropic Spitzer heat conduction
(4)
(4) which only gives a contribution aligned with the magnetic field and
W(mK)
is the value derived by Spitzer (Citation1962) assuming a constant Coulomb logarithm. In general, the Coulomb logarithm and therefore
depends weakly on the coronal plasma density. We limit the heat conductivity tensor such that the corresponding heat diffusion speed
is 10% of the speed of light with
being the grid spacing. For some of the runs, we replaced this equation by the hyperbolic equation of the non-Fourier heat flux, see section 2.2. Additionally to the anisotropic Spitzer heat conduction, we apply an isotropic numerical heat conduction, which is proportional to
and a heat conduction with a constant heat diffusivity
. These additions are used to describe the heat flux in the lower part of the simulation, where the temperature is significantly lower and therefore the Spitzer heat conductivity is significantly smaller than in the corona. It also makes the simulation numerically more stable.
The radiative losses due to the optically thin part of the atmosphere are described by , where
and
are the electron and hydrogen particle densities.
describes the radiative losses as a function of temperature following the model of Cook et al. (Citation1989), for details see Bingert (Citation2009).
To fulfil the exact solenoidality of the magnetic field at all times, we solve for the induction equation in terms of the vector potential
.
(5)
(5) where we use the resistive gauge, i.e. arbitrary scalar field φ, which divergence can be added to the induction equation is chosen to be
. The currents are given by
and η is the magnetic diffusivity.
2.1. Initial and boundary conditions
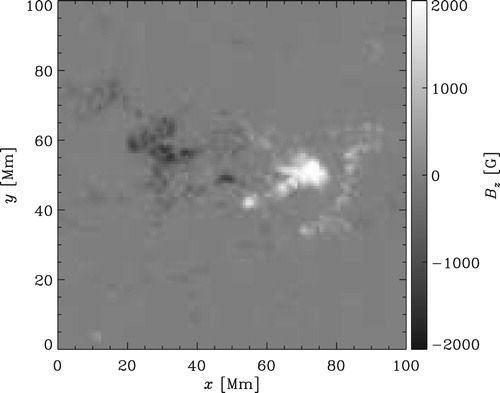
At the lower boundary, we use for the vertical magnetic field the line-of-sight magnetic field from the active region AR 11102, observed on the 30th of August with the Helioseismic and Magnetic Imager (HMI; Schou et al. Citation2012) onboard of the Solar Dynamics Observatory (SDO), see figure for an illustration. As an initial condition, we use a potential field extrapolation to fill the whole box with magnetic fields. For the temperature, we use an initial profile of a simplified representation of the solar atmosphere, similar as in Bingert and Peter (Citation2011). The density is calculated accordingly using hydrostatic equilibrium. The velocities are initially set to zero.
Figure 1. Initial vertical magnetic field at the photospheric layer z = 0 (colour online).
The simulations are driven by a prescribed horizontal velocity field at the lower boundary mimicking the pattern of surface convection. As discussed in Gudiksen and Nordlund (Citation2002, Citation2005b), Bingert (Citation2009) and Bingert and Peter (Citation2011), such a surface velocity driver is able to reproduce the observed photospheric velocity spectrum in space and time. To avoid the destruction of the magnetic field pattern caused by the photospheric velocities, we apply the following to stabilise the field: (i) we lower the magnetic diffusivity in the two lowest grid layers by a factor of 800 using cubic step function, (ii) we apply a quenching of velocities by a factor of 2, when magnetic pressure is larger than the gas pressure and (iii) we interpolate between the current vertical magnetic field and the initial one at z = 0 layer following
(6)
(6) where
min is the relaxation time. The quenching of photospheric velocities mimics the suppression of convection in magnetised regions as observed on the solar surface (see detailed discussion in Gudiksen and Nordlund Citation2002, Citation2005b, Bingert Citation2009, Bingert and Peter Citation2011). We apply a potential field boundary condition at the bottom and top boundary of box for the magnetic field. The temperature and density are kept fix at the bottom boundary. The temperature is kept constant and the heat flux is set to zero at the top boundary allowing the temperature to vary in time. At the top boundary, we set all velocity components to zero to prevent mass leaving or entering the simulation and to suppress all flows near the top boundary. The density in the lower part is high enough to serve as a mass reservoir. All quantities are periodic in horizontal directions.
For the viscosity, we choose similar to the Spitzer value for typical coronal temperatures and densities. We set
motivated by the numerical stability of the simulations. In the solar corona, the magnetic Prandtl number
is around
and not 0.5 as in our simulations.
2.2. Non-Fourier heat flux scheme
To reduce the time step constraints due to the Spitzer heat conductivity, we use a non-Fourier description and solve for the heat flux
(7)
(7) where
is the heat flux relaxation time, i.e. e-folding time for
to approach
.
is the Spitzer heat conductivity tensor, which has contributions only along the magnetic field. This approach enables us to use a different time stepping constrain to solve our equations. Instead of using the time step of Spitzer heat conduction
with
, we find two new time step constraints
(8)
(8) where
comes from the wave propagation speed
. To see this more clearly, we can rewrite (Equation7
(7)
(7) ) in one dimension x, with q and K being the one-dimensional counterparts of
and
as
(9)
(9) Then together with a simplified one-dimensional version of (Equation3
(3)
(3) ), where we only consider the heat flux term
(10)
(10) we can construct a wave equation for the temperature, namely
(11)
(11) in which
=
emerges as the propagation speed. The two new time step constraints emerge from the pre-factors of the terms on the right-hand side.
By certain choices of , we can significantly increase the time step. Furthermore, because
depends linear on the grid spacing
, instead of quadric as
, the speed-up ratio
grows with higher resolutions, which leads to a computational gain. Both time step constraints are included in the CFL condition to calculate the time step of the simulation.
enters the time step calculation through the advective time
step using
(12)
(12) where
is the advection speed and
the sound speed.
The major part of the heat flux is concentrated in the transition region, where the temperature gradient is high. This can lead to strong gradients in the heat flux itself. We, therefore, normalise
by the density ρ to decrease the heat flux in the lower part of the transition region compared to the upper part. The main motivation is to gain a better numerical stability and be able to resolve stronger gradients in
better. This results in a new set of equations, where
(13)
(13) We basically solve now for the energy flux per unit particle instead of the energy flux density.
(14)
(14) where we use the continuity equation to derive the last term. The term in the energy equation changes correspondingly
(15)
(15) This formulation does not change the time step constraints shown in (Equation8
(8)
(8) ).
Instead of choosing as a constant value in time and space, we also implemented an auto-adjustment, where
can vary in space and time. This allows the simulation to be more flexible and to be able to optimise the time step. The main idea to choose a reasonable value for
is that we set the time scale of the heat diffusion to be the smallest of all relevant time scales in this problem, i.e. the heat diffusion is the fastest process. The next bigger time scale is typically the Alfvén crossing time
with the Alfvén speed
. We want to keep the hierarchy of the time steps of each process in place while lowering the time step as much as possible. So we choose the time step of the heat diffusion to be always a bit lower than the Alfvén time step, therefore the heat diffusion is still the fastest process, but slower as before. For a fixed ratio between the
and
, we “tie”
to
and we set
(16)
(16)
On one hand, would become very small in regions below the corona, because there
has very low values due to the low temperature and high density values. However, in these regions the heat transport is mainly due to the isotropic heat transport. Low values of
in these regions would cause a very small time step, even though the Spitzer heat flux is not important for the heat transport in these regions. Therefore, we choose the lower limit to be the advective time step, which assures that
will not affect the time step in these regions. On the other hand, we want to avoid
becoming too large and therefore the heat transport getting less efficient, i.e.
is still sufficiently close to
. So, we choose
s as a limit for
:
(17)
(17)
To use the non-Fourier heat flux description in the Pencil Code, one has to add HEATFLUX=heatflux to src/Makefile.local and set the parameters in name list heatflux_run_pars in run.in. The relaxation time can be either chosen freely and the inverse is set by using tau_inv_spitzer or one can switch on the automatically adjustment by using ltau_spitzer_va=T, then tau_inv_spitzer sets the value of 1/
.
2.3. Semi-relativistic Boris correction
Above an active region, the magnetic field strength can be high while the density is low leading to Alfvén speeds comparable to the speed of light (e.g. Chatterjee and Fan Citation2013, Rempel Citation2017). This causes two major issues. On one hand, the MHD approximation assuming non-relativistic phase speeds is not valid anymore, i.e. we cannot neglect the displacement current. On the other hand, the high values of the Alfvén speed reduce the time step significantly. To address these two issues, we use a semi-relativistic correction of the Lorentz force following the work of Boris (Citation1970) and Gombosi et al. (Citation2002), where we apply a semi-relativistic correction term to the Lorentz force. This has been used and successfully tested for the MuRAM code in Rempel (Citation2017). Here, we use the implementation discussed by Chatterjee (Citation2018), who added this correction term to the Pencil Code. There, the Lorentz force transforms to
(18)
(18) where
is the relativistic correction factor. We note here that the correction term used here and in Chatterjee (Citation2018) is slightly different from the one used by Rempel (Citation2017), because Chatterjee (Citation2018) finds a more accurate way to approximate the inversion of the enhanced inertia matrix. This leads to an additional
in front of
. If
and
, we retain the normal Lorentz force expression. For
, the Lorentz force is reduced and the inertia is reduced in the direction perpendicular to the magnetic field. As the enhance inertia matrix (Rempel Citation2017) is originally on the right-hand side of the momentum equation, i.e. under the time derivative and it is just approximated by a correction term on the left-hand side, the semi-relativistic Boris correction does not change the stationary solution of the system and therefore does not lead to further correction terms in the energy equation. To switch on the Boris correction in Pencil Code, one sets the flag lboris_correction=T in the name list magnetic_run_pars.
The Boris correction describes the modification of the Lorentz force in the situation, where the Alfvén speed becomes comparable to the speed of light. In other words, the speed of light is a natural Alfvén speed limiter and the Boris correction describes the modification close to this limiter. We can artificially decrease the value of the limiter to a value of our choice and the Boris correction takes care of the corresponding modifications. This can significantly reduce the value of the Alfvén speed in our simulations and allow us to enhance the Alfvén time step. Unlike in Chatterjee (Citation2018), we use the Boris correction indeed to increase the Alfvén time step, similar to what has been done by Rempel (Citation2017). As shown by Gombosi et al. (Citation2002), the propagation speed can be quite complicated, we choose a similar time step modification as in Rempel (Citation2017)
(19)
(19) where
is the limiter. We choose for Set B
, which corresponds to a time step of
ms for our simulations. The limiter
can be set by using va2max_boris in the name list magnetic_run_pars. The Boris correction can be used together with the automatic adjusted relaxing time
in the non-Fourier heat flux calculation: if one sets va2max_tau_boris in heatflux_run_pars to the same value as va2max_boris in magnetic_run_pars, then the code modifies the Alfvén speed and the Alfvén time step used in (Equation16
(16)
(16) ) and (Equation17
(17)
(17) ) accordingly.
3. Results
We present here the results of three sets of runs, where we use different values of the heat flux relaxation time in combination with and without the Boris correction. In the first set, containing only Run R, we use the normal treatment of the Spitzer heat flux without using the non-Fourier heat flux evolution and without the Boris correction. In the second set, containing 4 runs (Set H), we use the non-Fourier heat flux evolution with
between 10 and 1000 ms and the automatically adjustment, see section 2.2. In the third set, containing 7 runs (Set B), we use the semi-relativistic Boris correction with
and the non-Fourier heat flux evolution with
10–1000 ms and the automatically adjustment. We also use one run (Ba2) with even lower Alfvén speed limit of
. An overview of the runs can be found in table .
3.1. Time steps
As a first step, we look at the time steps of all the runs in table . In Run R, the averaged time step in the saturated stage is around 1.5 ms. This time step is constrained by the Spitzer time step , which is shown as
in table . The Alfvén time step
is around twice as large. In the Set H, the code additionally solves the non-Fourier heat flux equation that leads to an increased time step. However, the time step is actually limited by the low Alfvén time step and therefore the time step cannot be increased by a large factor. In Set H, the largest speed-up factor is around 3. For Run H001, the value of
is low enough to have a time step constraint of
instead of
. However, the runs reach a lower time step than in Run R. For values of the relaxing time
50–1000 ms (Runs H005 and H1), the time step due to the heat flux is larger than the Alfvén time step. This means that the physical process of heat redistribution is even slower than the Alfvén speed. This leads in Run H1 to higher densities resulting in a lower Alfvén speed and a higher
, see discussion in section 3.4. Furthermore, Run H1 only runs stable, if we increase the shock viscosity to 10 times higher values than in the other runs. This will certainly lead to some additional differences independent of the direct influence of the non-Fourier heat flux description. When applying the auto-adjustment of
(Run Ha), the time steps
and
are slightly smaller than
and limits the time step. There the speed up is less than a factor of 2, but the heat distribution is the fastest process in the system. Using the non-Fourier heat flux description leads usually to higher peak temperatures, because the temperature diffusion is less efficient. For the calculation of
and
, the code uses the CFL pre-factors of 0.9 for both time steps, this results in
. As
enters via (Equation12
(12)
(12) ),
is often lower than
and
in our simulations.
To increase the time step further, we use the semi-relativistic Boris correction in all runs of Set B. As shown in table , significantly increases to 21.2 ms for Runs B001-Ba and to 70.6 ms for Ba2. This leads to a much larger speed-up factor of 10 for Run Ba and more than 30 for Run Ba2. For Run B001 to Run B1 with
10–1000 ms,
is lower than
and the time step can be significantly reduced, while the heat distribution is the fastest process in the system. For Run B1, we achieve a speed up of more than five, however, we need to use a comparable large value of
, which as discussed in section 3.4 can lead to artefacts. For Runs Ba and Ba2, the auto-adjustment of
takes care that
. As discussed below, Run Ba shows a good agreement with Run R, whereas Run Ba2 tends to produce higher temperatures in the corona.
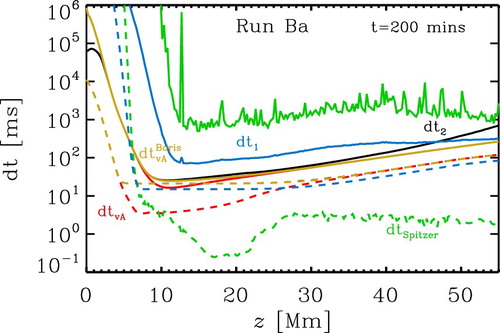
To get a better understanding of the calculation of the time step, we plot in figure various contributions to the time steps for Run Ba. Without the non-Fourier heat flux description and the Boris correction, the time step is dominated by Alfvén time step and the Spitzer time step
. The Boris correction reduces
to
mostly in the regions between 5 and 30 Mm. The auto-adjustment of
sets
to be always slightly lower than
. Only below z = 5 Mm,
is small, because there the temperature diffusion is dominated by the other heat diffusion mechanism described in section 2. It is clearly visible that the
is significantly higher than
(green line) and
(red) without the Boris correction. However, we note here that because of the non-Fourier heat flux description we find higher peak temperatures in the simulation. This results in a decrease of
in comparison with runs without the non-Fourier heat flux description. In Run R,
is around 1.6 ms, where in Run Ba, it is around a factor of eight lower. Such a factor can be explained by change in temperature by a factor of 2.3.
Figure 2. Vertical distribution of time step constraints for Run Ba at time $t= 200$ min. We plot the time step due to Spitzer heat conductivity (green), due to the heat flux
(black) and
(blue), due to the Alfvén speed
(red) and reduced Alfvén speed with the Boris correction
. The horizontal averaged values are shown with a solid line and the minimum values at each height with a dashed line (colour online).
Using the non-Fourier heat flux evolution requires to solve (Equation7(7)
(7) ) or (Equation14
(14)
(14) ) meaning three additional equations. However, the computational extra calculation time is around 10%, which is very small compared to the gain in time step reduction. Using the semi-relativistic Boris-Correction does not seem to increase the computation time significantly. Only if we use the auto-adjustment of
together with the Boris correction we find an additional 2–3% increase in the computation time, as shown in the last row of table .
3.2. Alfvén velocity with Boris correction
Next, we look at the influence of the semi-relativistic Boris correction on the Alfvén velocity . In figure , we plot 2D histograms of
for Runs R, Ba, Ba2. For Run R, the maximum speed reaches
at the lower part of the corona, where the density has decreased significantly with height, but the magnetic field is still strong. The median (yellow line) has its maximum at the same location with a value around
. In Run Ba, we have applied the Boris correction with
. Even though, this value is lower than the averaged and mean value in the region of z = 5–20 Mm, the velocity distribution does not change significantly in comparison to Run R. As a main effect of the Boris correction, the peak velocity at the top of the distribution is reduced, therefore the distribution becomes more compact. This can be also seen from the changes in the mean and median velocity. While the maximum of the mean is reduced from above
of Run R to nearly
, the median changes just slightly. Also, the area between the 25 and 75 percentiles of the Alfvén velocity population moves only slightly towards lower values. This make us confident that the Boris correction with
does only reduce the peak velocities and not the overall velocity structure; most of the points are unaffected by the correction.
Figure 3. 2D histograms of the Alfvén speed over height z for Runs R, Ba, Ba2. We plot the mean value with red solid line and the median with a yellow solid. The dashed white-blue lines show the 25 and 75 percentiles, i.e. half of the data points are in between these lines. The black dashed line indicate the Alfvén speed limit for the Boris correction (colour online).
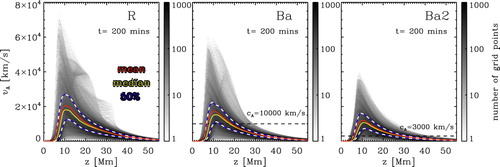
For Run Ba2, we reduce the Alfvén speed limit to . This makes the velocity distribution even more compact. The maximum values are significantly reduced to
, and the mean and median values are also lower than in Runs R, Ba. However, setting
does not mean that all the velocities are lower than this value, it can be understood as a significant reduction of the peak velocities and a transfer of the velocity distribution to a much more compact form.
3.3. Structure of temperature and ohmic heating
Next, we look at the horizontal averaged temperature profile over height. Even though the non-Fourier description of the heat flux can lead to higher peak temperatures, the overall temperature structure should remain roughly the same. In figure , we plot the horizontal averaged temperature profile over height for the reference Run R in panel (a) and a comparison with the other runs in panel (b). The horizontal averaged temperature structure in Run R shows a typical behaviour of corona above an active region with medium magnetic field strengths. The plasma above z = 10 Mm is heated self-consistently to averaged temperatures of around 1 million kelvin. This temperature profile is very similar to results of earlier work with the Pencil Code (e.g. Bingert Citation2009, Bingert and Peter Citation2011, Citation2013, Bourdin et al. Citation2013) and other groups (e.g. Gudiksen and Nordlund Citation2002, Citation2005b, Citation2005a, Gudiksen et al. Citation2011). When comparing with the temperature profiles of the other runs, we find no large differences. For most of the runs the deviation is not more than 10%. For some runs the largest difference occurs in the transition region, where the temperature has a large gradient. Higher temperature values in this region simply mean a slightly lower transition region and lower values mean a slightly higher transition region. Nearly all runs develop a lower or similar transition region location as in Run R. Only Runs H005, H1, Ba2 develop a higher transition region. This can be explained either by sub-dominance of the heat flux time step (Runs H005, H1) or the too low limit for the Alfvén speed, see discussion below. Only in Runs B001, Ba and Ba2 the plasma is heated to 20% higher temperature in the upper corona in comparison with Run R. For Run B001, this high temperature only occur at the end of the simulation, see figure . In these runs, the heat diffusion might be not efficient enough to transport heat to lower layers.
Figure 4. (a) Averaged temperature as a function of height z for Run R. (b) Ratio of the averaged temperature profile of all runs and Run R
as a function of height z. The temperatures are averaged horizontal as well as in time for the last quarter (1 h) of the simulation. The colour of the lines indicates the run names in terms of
, the solid lines are for runs of Sets R and H, and dashed lines for Set B (colour online).
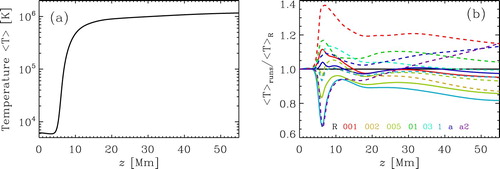
Figure 5. Time evolution of the horizontal averaged temperature (a) and of the horizontal averaged heating rate
(b) at
18–22 mm. Colour coding is the same as in figure (colour online).
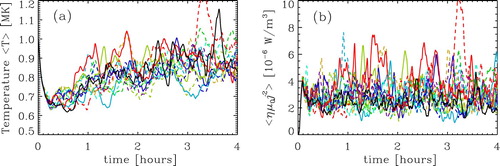
When we look at the temperature evolution over time, as plotted in figure (a), we find that each run shows a large variation in time even though we have averaged horizontally and over 18–20 Mm. This can be explained by the non-linear behaviour of the system. Because of this reason temporal variations occurring in the other runs appear not at the same time for all runs. The difference between the runs is comparable with the time variation of each run. Therefore, to be able to compare the runs, we should look at the time averaged quantities as done throughout this work.
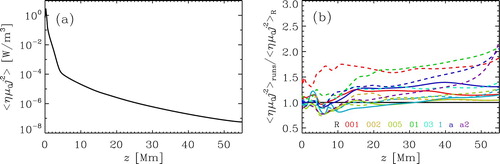
Next, we look at the ohmic heating rate in all the runs. The ohmic heating is the main process in this type of simulations to heat the coronal plasma up to million K. Also, here, we plot the horizontal averaged profile of Run R in panel (a) of figure and compare it with the other runs in figure (b). The profile of the ohmic heating rate shows the typical behaviour of an exponential decrease corresponding to two scale heights. Below the corona the scale height is roughly 0.5 Mm, while in the corona the scale height is around 5 Mm. Also, this is consistent with earlier finding with this kind of simulations by many groups (e.g. Gudiksen and Nordlund Citation2002, Citation2005b, Citation2005a, Bingert Citation2009, Gudiksen et al. Citation2011, Bingert and Peter Citation2011, Citation2013, Bourdin et al. Citation2013). By comparing with the other sets of runs, we find that these agree well with Run R. Only Run B001 shows a large heating rate in the lower corona, which comes here also from the last part of the simulation. Runs B01, Ba and Ba2 develop a higher heating rate in the upper corona resulting in higher temperatures at this location (see figure ). Small changes either in the scale height of the coronal heating or in the location in the transition region can explain most of the differences we find in the comparison with Run R. This explains also the temporal changes of the heating rate at constant height, as shown in figure (b). The large variations in time of the heating rate can be attributed to non-linear behaviour of the system. Even in Run R, these variations are large compared to the average. Small local changes in temperature and density can also affect the heating rate. As the field is very close to a potential field, the currents are due to small perturbations from the potential field. These perturbations can easily be affected by changes in the plasma flow due to temperature and density fluctuations. Furthermore, in such dynamical non-linear systems, changes for example in the time step can affect also the realisation of the velocity solution. Even when solutions are the same on a statistical level, this can cause variations in the ohmic heating. For these types of models, large variations in time of the ohmic heating rate are a common feature (e.g. Bingert and Peter Citation2011, Citation2013) as small changes in local scale height will lead to a large change in the heating rate. Overall, the vertical horizontally averaged temperature and heating structure of all runs agree well with Run R.
Figure 6. (a) Averaged ohmic heating rate as a function of height z for Run R. (b) Ratio of the averaged ohmic heating rate of all runs and Run R
as a function of height z. The ohmic heating rate is averaged horizontal as well as in time for the last quarter (1 h) of the simulation. The colour coding the same as in figures and (colour online).
3.4. Emission signatures
To further test how well the non-Fourier description of the heat flux reproduce the Fourier description, we synthesise coronal emissivities corresponding to the 171 Å channel of Atmospheric Imaging Assembly (AIA; Boerner et al. Citation2012) on board of SDO. We choose this AIA channel because it can be potentially compared with observations and represents well the plasma structure of around 1 million K by convolving the temperature and density structures. This can work as a good test, weather or not coronal emission structures are affected by the choice of heat flux description. For this we calculate the emission following optical thin radiation approximation,
(20)
(20) where
is the response function of the particular filter, we want to synthesise. Because we compare our simulations among each other and not to observation, we simplify
using a gaussian distribution around a mean temperature
,
(21)
(21) where
is the temperature width used to mimic the temperature response function. We use
K and
K for synthesising the emission of the AIA 171 Å channel. To calculate the emission emitted from a certain direction, we perform an integration along this direction. For the discussion below, we apply an integration along the y and z directions, respectively.
In figure , we plot the temperature as a side view (xz) averaged over y and in time (180–240 min) together with the synthesised emission integrated over the y and z directions also averaged in time (180–240 min) representing the AIA 171 channel for Runs R, Ha, Ba, Ba2. For these runs, we expect a good agreement with the reference run R, because the value of is regulated automatically and therefore the time step is controlled by the heat flux, i.e.
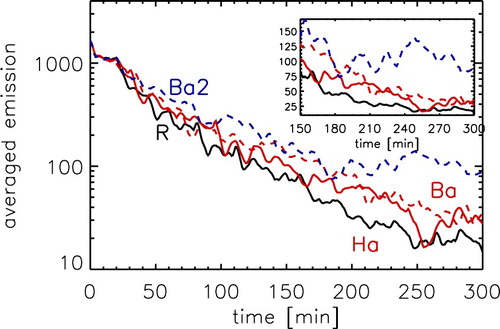
. We find agreement between the Runs R, Ha and Ba, but we find slightly stronger emission structures in Run Ba and slightly hotter temperatures in Run Ha. To illustrate the variation in time we show in figure the time evolution of the emission in a small region of the simulation box. We find a good agreement between Runs R and Ha with variation in time which are comparable with their difference. Run Ba takes a bit longer to saturate, but at around 220 min it also settles to values similar to Runs R and Ha. Run Ba2 seems to saturate to a much higher emission level than the other runs, which is already seen in figure .
Figure 7. Temperature and emission structure for Runs R, Ha, Ba, Ba2. We show the temperature averaged over the y direction and in time 180–240 min (left panel) together with the synthesised emission comparable to the AIA 171 channel, representing emission at around 1 MK, integrated in the y direction (side view, middle panel) and in z direction (top view, right panel). The emission values represent the count rate of the AIA instrument and has been averaged in time
180–240 min. The red square indicates the region which is used to calculate the temporal evolution in figure (colour online).
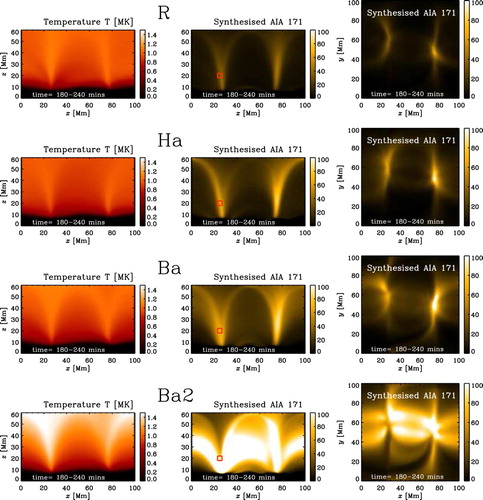
Figure 8. Time evolution of emission averaged over a small region for Run R, Ha, Ba and Ba2. We plot the emission of the AIA 171 channel in the y direction averaged over a small region ( 23–27 mm,
18–22 mm) as indicated by red boxes in figure middle panels. The inlay shows the time evolution of the averaged emission from 150 to 300 min on a linear scale instead of logarithmic. The colour and style of the lines are the same as in figure (colour online).
For Run Ba2, as pointed out in section 3.3 and shown in first column of figure , the corona is heated to higher temperatures, i.e. the heat transport is less efficient. We find larger temperatures mostly at the top of the corona inside the loop structures. This leads also to higher emission in the AIA 171 channel than in the Run R. This might be an artefact from the low limit of the Alfvén speed through the Boris correction in this run. Even though the Alfvén speed limiter does not effect the heat flux directly, it increases the heat flux time step and makes the heat transport less efficient.
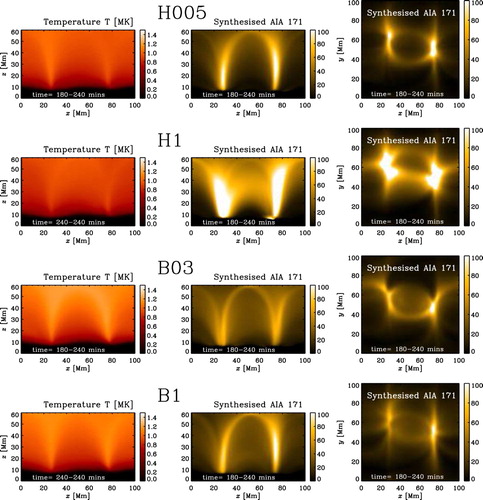
In figure , we show a few other runs, which are either dominated by the Alfvén time step (Runs H005 and H1) or use a constant value of (Runs B03 and B1). Run H005 shows a similar emission structure than the Runs R, Ha, Ba, however, the emission is slightly larger in the legs of the loop. Because also here the temperatures are not significantly higher, the difference is due to the slightly higher density in these regions. For Run H1,
is large and the time step is controlled by the Alfvén speed instead of the heat flux. This leads to larger temperatures and therefore higher emission. However, also here the density in the corona loops is larger than in Run R, leading not only to higher emission but also to a larger Alfvén time step, see table . Furthermore, the high shock viscosity needed to keep the run stable will also have an influence on the solution. In contrast, the time steps in Runs B03 and B1 are controlled by the time step of the heat flux (
). There, as expected, we find similar emission loop structures as in Run R, Ha and Ba. They are slightly larger in Run B1 than in Run B03. This means that simulations using either the automatic adjustment or a constant value of
reproduce the emission structure of Run R well, as long as the time step is still controlled by the heat flux time step
, however, the emission tends to be slightly larger. However, for too low values of the Alfvén limiter (
) the emission and temperature become much higher than in Run R. We note here that the AIA 171 channel is relatively broad filter around the mean temperature and therefore hide some of the differences between the runs. A more narrow filters for example used on Hinode/EIS might reveal larger differences.
Figure 9. Temperature and emission structure for Runs H005, H1, B03, B1. The emission values represent the count rate of the AIA instrument. We show the temperature averaged over the y direction and in time (180–240 min, left panel) together with the synthesised emission comparable to the AIA 171 channel, representing emission at around 1 MK, integrated in the y direction (side view, middle panel) and in z direction (top view, right panel). The emission values represent the count rate of the AIA instrument and has been averaged in time (180–240 min) (colour online).
4. Discussion and conclusion
In this work, we present the new implementation of a non-Fourier description of the heat flux to the Pencil Code. We discuss the advantages and the limitations using the example of 3D MHD simulations of the solar corona. The implementation of the auto-adjustment of is slightly different from the implementation used in Rempel (Citation2017) in the sense that we ensure the heat flux time step to be always by a square root of two smaller than the Alfvén time step, whereas in Rempel (Citation2017) there is not such a factor. Even though a detailed comparison was not conducted here, we see indications that our choice leads to a better stability of the simulations. We find that using the non-Fourier description of the heat flux alone allows for a small speed up, because in our case the time constraint of the Alfvén speed is large. For simulations with a lower magnetic field strength, we would expect a larger speed up. If we choose a constant
, so that the heat flux time step is four times higher than the Alfvén time step, the temperatures and the emission are significantly larger than in the other runs. This seems to be an artefact of this choice of
.
We further test the implementation of the semi-relativistic Boris correction (Boris Citation1970) as a limiter for the Alfvén speed. The implementation to the Pencil Code is slightly different from the one used by Rempel (Citation2017) and Gombosi et al. (Citation2002), see Chatterjee (Citation2018) for details. The Boris correction does not quench the Alfvén speed at all locations to the limit chosen, it actually reduces the peak velocities, which are not very abundant. Therefore, this correction makes the velocity distribution much more compact. The lower the limit, the more compact is the velocity distribution. Using the Boris correction allows for a significant speed up of around 10. For higher speed up, i.e. lower limit for Alfvén speed, the simulation develops higher temperatures and emission signatures than the reference run. The auto-adjustment together with Boris correction works very well to reproduce the temperatures and emission structures of the reference run with a speed up of around 10 (Run Ba). These results convince us that we can use the non-Fourier heat flux description together with the Boris correction to acquire a significant speed up of the simulation without losing a correct representation of the physical processes within the solar corona in a statistical sense. We find some differences between the solution with and without non-Fourier heat flux description and the Boris correction. However, we are not interested if the non-Fourier heat flux description is identical to Fourier heat flux description in every time step at every specific location. Instead, we are interested if the non-Fourier heat flux description reproduced the Fourier heat flux description on a statistical level. On the statistical level, we find a very good agreement.
In the future, we are planning to use these implementations to perform large-scale active region simulations similar as done by Bourdin et al. (Citation2013, Citation2014), which can be then run for a much longer time and allowing the study of hot core loop formations. A first attempt is already published (Warnecke and Peter Citation2019). Furthermore, this implementation allows us to perform parameter studies to investigate the coronal response to different types of active regions on the Sun and also on other stars. Finally, through these improvements, we get closer to the possibility to simulate a more realistic convection-zone-corona model as started in Warnecke et al. (Citation2012b, Citation2013a, Citation2016a).
Acknowledgments
We thanks the anonymous referees for the useful suggestions. We also thank Piyali Chatterjee for the implementation of the Boris correction to the Pencil Code and detailed discussions about it. We furthermore thank Hardi Peter for discussion about the non-Fourier heat flux description and comments to the manuscript. The simulations have been carried out on supercomputers at GWDG, on the Max Planck supercomputer at RZG in Garching, in the facilities hosted by the CSC-IT Center for Science in Espoo, Finland, which are financed by the Finnish Ministry of Education.
Disclosure statement
No potential conflict of interest was reported by the authors.
ORCID
Jörn Warnecke http://orcid.org/0000-0002-9292-4600
Sven Bingert http://orcid.org/0000-0001-9547-1582
Additional information
Funding
Notes
References
- Abbett, W.P., The magnetic connection between the convection zone and corona in the quiet sun. Astrophys. J. 2007, 665, 1469–1488. doi: 10.1086/519788
- Bingert, S., 3D MHD models of the solar corona: active region and network. Ph.D. Thesis, Albert-Ludwig-Universität Freiburg, 2009.
- Bingert, S. and Peter, H., Intermittent heating in the solar corona employing a 3D MHD model. Astron. Astrophys. 2011, 530, A112. doi: 10.1051/0004-6361/201016019
- Bingert, S. and Peter, H., Nanoflare statistics in an active region 3D MHD coronal model. Astron. Astrophys. 2013, 550, A30. doi: 10.1051/0004-6361/201220469
- Boerner, P., Edwards, C., Lemen, J., Rausch, A., Schrijver, C., Shine, R., Shing, L., Stern, R., Tarbell, T., Title, A., Wolfson, C.J., Soufli, R., Spiller, E., Gullikson, E., McKenzie, D., Windt, D., Golub, L., Podgorski, W., Testa, P. and Weber, M., Initial calibration of the atmospheric imaging assembly (AIA) on the solar dynamics observatory (SDO). Sol. Phys. 2012, 275, 41–66. doi: 10.1007/s11207-011-9804-8
- Boris, J.P., A physically motivated solution of the Alfven problem. NRL Memorandum Report, 2167, 1970.
- Bourdin, P.A., Bingert, S. and Peter, H., Observationally driven 3D magnetohydrodynamics model of the solar corona above an active region. Astron. Astrophys. 2013, 555, A123. doi: 10.1051/0004-6361/201321185
- Bourdin, P.A., Bingert, S. and Peter, H., Coronal loops above an active region: observation versus model. PASJ 2014, 66, S7. doi: 10.1093/pasj/psu123
- Bourdin, P.A., Bingert, S. and Peter, H., Coronal energy input and dissipation in a solar active region 3D MHD model. Astron. Astrophys. 2015, 580, A72. doi: 10.1051/0004-6361/201525839
- Bourdin, P., Singh, N.K. and Brandenburg, A., Magnetic helicity reversal in the corona at small plasma beta. Astrophys. J. 2018, 869, 2. doi: 10.3847/1538-4357/aae97a
- Brandenburg, A. and Chatterjee, P., Strong nonlocality variations in a spherical mean-field dynamo. Astron. Nachr. 2018, 339, 118–126. doi: 10.1002/asna.201813472
- Brandenburg, A., Käpylä, P.J. and Mohammed, A., Non-Fickian diffusion and tau approximation from numerical turbulence. Phys. Fluids 2004, 16, 1020–1027. doi: 10.1063/1.1651480
- Chatterjee, P., Testing Alfvén wave propagation in a realistic set-up of the solar atmosphere. Geophys. Astrophys. Fluid Dyn. 2018, submitted, arXiv: 1806.08166.
- Chatterjee, P. and Fan, Y., Simulation of homologous and cannibalistic coronal mass ejections produced by the emergence of a twisted flux rope into the solar corona. Astrophys. J. Lett. 2013, 778, L8. doi: 10.1088/2041-8205/778/1/L8
- Chen, F., Peter, H., Bingert, S. and Cheung, M.C.M., A model for the formation of the active region corona driven by magnetic flux emergence. Astron. Astrophys. 2014, 564, A12. doi: 10.1051/0004-6361/201322859
- Chen, F., Peter, H., Bingert, S. and Cheung, M.C.M., Magnetic jam in the corona of the Sun. Nat. Phys. 2015, 11, 492–495. doi: 10.1038/nphys3315
- Cook, J.W., Cheng, C.C., Jacobs, V.L. and Antiochos, S.K., Effect of coronal elemental abundances on the radiative loss function. Astrophys. J. 1989, 338, 1176–1183. doi: 10.1086/167268
- Galsgaard, K. and Nordlund, Å., Heating and activity of the solar corona 1. Boundary shearing of an initially homogeneous magnetic field. J. Geophys. Res. 1996, 101, 13445–13460. doi: 10.1029/96JA00428
- Gent, F.A., Shukurov, A., Fletcher, A., Sarson, G.R. and Mantere, M.J., The supernova-regulated ISM – I. The multiphase structure. Mon. Not. Roy. Astron. Soc. 2013, 432, 1396–1423. doi: 10.1093/mnras/stt560
- Gombosi, T.I., Tóth, G., De Zeeuw, D.L., Hansen, K.C., Kabin, K. and Powell, K.G., Semirelativistic Magnetohydrodynamics and Physics-Based Convergence Acceleration. J. Comput. Phys. 2002, 177, 176–205. doi: 10.1006/jcph.2002.7009
- Gudiksen, B.V. and Nordlund, Å., Bulk heating and slender magnetic loops in the solar corona. Astrophys. J. Lett. 2002, 572, L113–L116. doi: 10.1086/341600
- Gudiksen, B.V. and Nordlund, Å., An ab initio approach to solar coronal loops. Astrophys. J. 2005a, 618, 1031–1038. doi: 10.1086/426064
- Gudiksen, B.V. and Nordlund, Å., An ab initio approach to the solar coronal heating problem. Astrophys. J. 2005b, 618, 1020–1030. doi: 10.1086/426063
- Gudiksen, B.V., Carlsson, M., Hansteen, V.H., Hayek, W., Leenaarts, J. and Martínez-Sykora, J., The stellar atmosphere simulation code Bifrost. Code description and validation. Astron. Astrophys. 2011, 531, A154. doi: 10.1051/0004-6361/201116520
- Hansteen, V.H., Hara, H., De Pontieu, B. and Carlsson, M., On redshifts and blueshifts in the transition region and corona. Astrophys. J. 2010, 718, 1070–1078. doi: 10.1088/0004-637X/718/2/1070
- Haugen, N.E.L., Brandenburg, A. and Mee, A.J., Mach number dependence of the onset of dynamo action. Mon. Not. Roy. Astron. Soc. 2004, 353, 947–952. doi: 10.1111/j.1365-2966.2004.08127.x
- Hubbard, A. and Brandenburg, A., Memory effects in turbulent transport. Astrophys. J. 2009, 706, 712–726. doi: 10.1088/0004-637X/706/1/712
- Losada, I.R., Warnecke, J., Brandenburg, A., Kleeorin, N. and Rogachevskii, I., Magnetic bipoles in rotating turbulence with coronal envelope. Astron. Astrophys. 2019, 621, A61. doi: 10.1051/0004-6361/201833018
- Mok, Y., Mikić, Z., Lionello, R. and Linker, J.A., Calculating the thermal structure of solar active regions in three dimensions. Astrophys. J. 2005, 621, 1098–1108. doi: 10.1086/427739
- Mok, Y., Mikić, Z., Lionello, R. and Linker, J.A., The formation of coronal loops by thermal instability in three dimensions. Astrophys. J. Lett. 2008, 679, L161. doi: 10.1086/589440
- Parker, E.N., Topological dissipation and the small-scale fields in turbulent gases. Astrophys. J. 1972, 174, 499. doi: 10.1086/151512
- Parker, E.N., Nanoflares and the solar X-ray corona. Astrophys. J. 1988, 330, 474–479. doi: 10.1086/166485
- Peter, H., What can large-scale magnetohydrodynamic numerical experiments tell us about coronal heating? Phil. Trans. Roy. Soc. Lond. A 2015, 373, 20150055–20150055. doi: 10.1098/rsta.2015.0055
- Peter, H., Gudiksen, B.V. and Nordlund, Å., Coronal heating through braiding of magnetic field lines. Astrophys. J. Lett. 2004, 617, L85–L88. doi: 10.1086/427168
- Peter, H., Gudiksen, B.V. and Nordlund, Å., Forward modeling of the corona of the sun and solar-like stars: from a three-dimensional magnetohydrodynamic model to synthetic extreme-ultraviolet spectra. Astrophys. J. 2006, 638, 1086–1100. doi: 10.1086/499117
- Peter, H., Warnecke, J., Chitta, L.P. and Cameron, R.H., Limitations of force-free magnetic field extrapolations: revisiting basic assumptions. Astron. Astrophys. 2015, 584, A68. doi: 10.1051/0004-6361/201527057
- Rempel, M., Numerical simulations of quiet sun magnetism: on the contribution from a small-scale dynamo. Astrophys. J. 2014, 789, 132. doi: 10.1088/0004-637X/789/2/132
- Rempel, M., Extension of the MURaM radiative MHD code for coronal simulations. Astrophys. J. 2017, 834, 10. doi: 10.3847/1538-4357/834/1/10
- Rheinhardt, M. and Brandenburg, A., Modeling spatio-temporal nonlocality in mean-field dynamos. Astron. Nachr. 2012, 333, 71–77. doi: 10.1002/asna.201111625
- Schou, J., Scherrer, P.H., Bush, R.I., Wachter, R., Couvidat, S., Rabello-Soares, M.C., Bogart, R.S., Hoeksema, J.T., Liu, Y., Duvall, T.L., Akin, D.J., Allard, B.A., Miles, J.W., Rairden, R., Shine, R.A., Tarbell, T.D., Title, A.M., Wolfson, C.J., Elmore, D.F., Norton, A.A. and Tomczyk, S., Design and ground calibration of the helioseismic and magnetic imager (HMI) instrument on the solar dynamics observatory (SDO). Sol. Phys. 2012, 275, 229–259. doi: 10.1007/s11207-011-9842-2
- Spitzer, L., Physics of Fully Ionized Gases, 2nd ed., 1962 (Interscience: New York).
- van der Holst, B., Sokolov, I.V., Meng, X., Jin, M., Manchester IV, W.B., Tóth, G. and Gombosi, T.I., Alfvén wave solar model (AWSoM): coronal heating. Astrophys. J. 2014, 782, 81. doi: 10.1088/0004-637X/782/2/81
- Vögler, A., Shelyag, S., Schüssler, M., Cattaneo, F., Emonet, T. and Linde, T., Simulations of magneto-convection in the solar photosphere. Equations, methods, and results of the MURaM code. Astron. Astrophys. 2005, 429, 335–351. doi: 10.1051/0004-6361:20041507
- Warnecke, J. and Brandenburg, A., Surface appearance of dynamo-generated large-scale fields. Astron. Astrophys. 2010, 523, A19. doi: 10.1051/0004-6361/201014287
- Warnecke, J. and Brandenburg, A., Coronal influence on dynamos, in IAU Symposium, Vol. 302 of IAU Symposium, Aug., 2014, pp. 134–137.
- Warnecke, J. and Peter, H., Data-driven model of the solar corona above an active region. Astron. Astrophys. 2019, 624, L12. doi: 10.1051/0004-6361/201935385
- Warnecke, J., Brandenburg, A. and Mitra, D., Dynamo-driven plasmoid ejections above a spherical surface. Astron. Astrophys. 2011, 534, A11. doi: 10.1051/0004-6361/201117023
- Warnecke, J., Brandenburg, A. and Mitra, D., Magnetic twist: a source and property of space weather. JSWSC 2012a, 2, A11.
- Warnecke, J., Käpylä, P.J., Mantere, M.J. and Brandenburg, A., Ejections of magnetic structures above a spherical wedge driven by a convective dynamo with differential rotation. Sol. Phys. 2012b, 280, 299–319. doi: 10.1007/s11207-012-0108-4
- Warnecke, J., Käpylä, P.J., Mantere, M.J. and Brandenburg, A., Spoke-like differential rotation in a convective dynamo with a coronal envelope. Astrophys. J. 2013a, 778, 141. doi: 10.1088/0004-637X/778/2/141
- Warnecke, J., Losada, I.R., Brandenburg, A., Kleeorin, N. and Rogachevskii, I., Bipolar magnetic structures driven by stratified turbulence with a coronal envelope. Astrophys. J. Lett. 2013b, 777, L37. doi: 10.1088/2041-8205/777/2/L37
- Warnecke, J., Käpylä, P.J., Käpylä, M.J. and Brandenburg, A., Influence of a coronal envelope as a free boundary to global convective dynamo simulations. Astron. Astrophys. 2016a, 596, A115. doi: 10.1051/0004-6361/201526131
- Warnecke, J., Losada, I.R., Brandenburg, A., Kleeorin, N. and Rogachevskii, I., Bipolar region formation in stratified two-layer turbulence. Astron. Astrophys. 2016b, 589, A125. doi: 10.1051/0004-6361/201525880
- Warnecke, J., Chen, F., Bingert, S. and Peter, H., Current systems of coronal loops in 3D MHD simulations. Astron. Astrophys. 2017, 607, A53. doi: 10.1051/0004-6361/201630095
- Wiegelmann, T., Nonlinear force-free modeling of the solar coronal magnetic field. J. Geophys. Res. 2008, 113, A12. doi: 10.1029/2007JA012432