
ABSTRACT
There are many approaches to teaching about globalization, commodity chains, and sustainability. Education for sustainable development demands teaching approaches that capture multidimensional and integrated aspects of environmental, social, economic, and political factors. In geography, additional aspects require attention, such as understanding how peoples’ everyday lives, living conditions, and business relations depend on contextual circumstances including place, time, and scales. This article presents a time-geographic teaching approach that enables systems thinking through contextual analysis.
We present a time-geographically inspired educational approach which was implemented at a Swedish university in a yearly course, from 2007 to 2015 (9 years in total). Next, we review 48 student exam papers regarding how students performed a time-geographic contextual analysis of commodity chains and sustainability. We found that the teaching approach encouraged multiple descriptions and reflections by students. It developed students’ abilities to apply geographic concepts and to identify complex relationships in time and space that define sustainability challenges and strategies. Students linked everyday life to global and local processes.
The challenge: to understand sustainability and complex geographic relationships
The stakes are high when people make choices in their everyday lives. Complex relationships in time and space are the outcome of their decisions to satisfy immediate and short-term needs as well as long-term goals. Some of these choices involve what clothes or food to buy or what means of transport to use. Others concern safeguarding the welfare of the global population, including caring for the planet and the environment. Even if social media have made people aware of planetary threats, generally, it is easier to grasp the effects of more immediate choices, which tend to be short-term and in the proximate environment. People are actors in a complex relationship with planet Earth as the playing field.
As consumers and producers in this relationship, actors make decisions that connect to complex commodity chains. This global interconnectedness with its multitude of interdependencies is difficult to grasp and master. Therefore, systems thinking is necessary for all the actors involved. Actors constantly have to adapt to changing circumstances to sustain livelihoods, production processes, and other everyday goals. If the goal is sustainable development, actors need to master complex interdependencies and understand personal choices in relation to sustainability. Actors need to ask questions about how production systems impact people, places, and the environment in the short and long run. In addition, they need to apply values about justice, solidarity, and democracy. It is important to gain such knowledge early in life and here school education has a central role.
Previous research has found there is a need to develop educational models that strengthen students’ awareness and ability to link geographic issues to their own daily lives and local conditions for sustainable development (Björneloo, Citation2007; Smith, Citation2009; Tani, Citation2011). This article is about the need to understand complex geographic relationships and their effects on sustainability, an area identified as important to develop in education and research for sustainable development (Clark & Zeegers, Citation2015; Schuler, Fanta, Rosenkraenzer, & Riess, Citation2018).
There are many approaches in teaching about globalization and production systems. With the perspective of time geography, we have developed a teaching approach that helps to identify sustainability challenges, causes, and effects in geographic contexts (Jansund & Westermark, Citation2013). The objective of the teaching approach is to encourage students to develop abilities to perform a contextual analysis of the complexity of today’s globalized world. Students were introduced to geographic concepts, theories about globalization and sustainable development, and trained in applying them in a time-geographic perspective. The aim of this article is to present the time-geographic teaching approach and to assess its potential for learning. We analyze the outcome of how, and how well students solved an assignment referring to education for sustainable development and deep learning.
Data material and method
The time-geographically inspired educational approach was implemented at a Swedish university in a yearly course, from 2007 to 2015 (9 years in total), in an educational career program in geography and geography teacher education at the secondary level (high school). The course covered 5 weeks of studies and focused on developing students’ understanding of social change and interdependences of places and regions in a globalized world, including the following geography areas: population, development, economy, resources, politics, culture, urban and rural landscapes (Gothenburg University, Citation2007–2015).
The data material consists of 48 written student exam papers produced in the following courses 2008 (10 papers), 2009 (6 papers), 2011 (11 papers), 2012 (10 papers), 2013 (11 papers), by students in groups of four to eight participants (236 students). The students completed an assignment throughout the 5-week course. It required them to analyze commodity chains in time and space, applying a time-geographic perspective and concepts to identify sustainability challenges, their causes, and effects.
The analysis of the data material was performed in four steps (). First, an open coding of all 48 papers aimed to identify students’ abilities to apply the time-geographic perspective and concepts analytically and graphically, and to identify and reflect on sustainability challenges in context.
Figure 1. Analytical coding process.

In step 2, a matrix of categories was developed to code and analyze the papers, in depth, regarding students’ graphical and analytical descriptions of commodity chains (). The grid of the matrix was applied to code and analyze how students made use of the time-geographic perspective and concepts to identify and describe the sequential order of production phases in space (columns 1 and 2), to identify sustainability challenges (column 3), and to reflect on their character and effects (social, economic, and/or environmental), and their causes in contexts with references to actors’ roles and responsibilities (for instance consumers and producers) in different domains of power (regulations with different origins) at different geographic scales (factory level, local, regional or global) (columns 4 and 5). General comments on how students delimited their scope, applied time-geographic concepts, and reflected on contextual relationships were recorded in column 6. Step three, the focused coding, continued until reaching a level of saturation (24 papers). Based on this content, repetitive dimensions and patterns were identified and discussed as learning outcomes of the applied teaching approach. Finally, in step four, we reviewed the remaining 24 papers using findings in the analysis of the first 24 papers that had been analyzed in depth to confirm and discuss variations in outcomes.
Table 1. Analytical matrix.
The article is organized as follows: First, we reflect on learning about sustainability and commodity chains. Next, we present the time-geographic perspective and a time-geographic teaching approach about contextual relationships. Finally, we analyze and assess students’ learning using this approach.
Learning about sustainability and commodity chains
Education needs to integrate sustainability issues in local and global contexts into curriculums aiming at developing competences of learners to handle change (Leicht, Heiss, & Byun, Citation2018). In general, it refers to asking critical questions, clarifying personal values, envisioning positive sustainable futures, thinking systematically, responding through applied learning, and exploring dialectics between tradition and innovation (Leicht et al., Citation2018; Tilbury, Citation2011; UNESCO, Citation2012). It is a continuous learning process which require constant reevaluation of goals and challenges from different stakeholders’ view and different disciplinary perspectives. The multidimensional and integrated factors that define a challenge that needs to be changed or sustained should be considered (Wals & Rodela, Citation2014). The expected outcomes of such learning are: “critical, strategic, analytical, and systematic thinking abilities as well as several competencies for working in diverse teams and additional personal skills such as the ability to reflect, or deal with complexity.” (Missimer & Connell, Citation2012, p. 173)
Gibson and Fox have identified three categories of sustainability problems. There are those that are simple and therefore easy to define with a clear solution, and those that are complex and require deeper analysis to be understood and that may resist being solved. Finally, there are those that are wicked, in the sense that they may be ambiguous, requiring analysis from many different perspectives (both stakeholders’ and disciplines’), and for which there may not be one solution, or the solution may change over the course of time and may vary between contextual settings (Gibson & Fox, Citation2018; Wals & Lenglet, Citation2016). Proximate and ultimate causations refer to geographic scales and time horizons. Proximate causes and effects are those that may be identified in practice, in the immediate surroundings of production or everyday life. Ultimate causes are related to spaces, scales, and times that are more distant and more difficult to identify immediately (Moseley, Citation2005; Moseley, Perramond, Hapke, & Laris, Citation2013). Proximate and ultimate causes are defined in time and space contexts, making the time-geographic contextual analysis useful for identifying and analyzing such relationships and defining strategies for change.
Learning about commodity chains is an opportunity to understand the driving forces behind and effects of globalization in a system of relationships referring to several geographical scales including interactions between projects for production and peoples’ everyday lives. It is an opportunity to analyze how local contexts form part of and condition global production systems, and vice versa.
There are many ways to conduct the analysis from different perspectives and with different objectives. Geographical research on commodity chains involves mapping patterns of relationships on the surface of the Earth. For example, it is about the way a commodity travels from the producer to the consumer (Moseley et al., Citation2013), about describing and understanding existences, events, change, and systems (Thrift, Citation2009), extraction of raw material, manufacturing, import and export, sales, distribution for sales, and marketing (Knox & Marston, Citation2014), involving the entire sequence of involved sites and actors, as well as the activities involving extraction, processing, assembly, and transport between sites, including retail, household consumption, and finally landfill (Ellegård, Citation1998; Lenntorp, Citation1998). Thus, there are many parts of a production system to identify, depending on what aspects are particularly interesting to explore and how they relate to each other. Circumstantial factors in the whole production process, in different phases, for different people and places may be both positive and negative regarding sustainability issues.
A time-geographic teaching approach
In research, as well as in teaching, certain choices are made. This time-geographic approach complements and contributes aspects of knowledge and abilities that may be missed in other approaches. Time geography has an inherent basic structure that enables deep and contextual learning (Blom Mondlane & Jansund, Citation2003), allowing students to understand and not merely to remember a content (Marton & Säljö, Citation2005). Several pedagogical approaches relate to this time-geographic teaching approach. First, the socio-cultural perspective, giving importance to social environments and learning in specific contexts, so-called situational learning (Claesson, Citation2007; Säljö, Citation2000). Second, experiential learning which enables the learner to take personal action in the learning process. It is learning by doing, rather than lecturing, allowing students to be actively and critically engaged to deal with personal sustainability issues (Missimer & Connell, Citation2012). It also contributes to a “higher-level” learning favoring “how to think rather than “what to think” (Savage, Tapics, Evarts, Wilson, & Tirone, Citation2019, pp. 694–695). Social learning, similarly, focuses on involving people in reflexive practices, (Lotz-Sisitka, O’Donoghue, & Wilmot, Citation2010), and collective learning to promote critical thinking through the interaction of diverse and multiple views to a problem. Problem-Based Learning also brings forward the importance of students confronting real-life problems and their complexities (Missimer & Connell, Citation2012).
In the following, we present a teaching approach inspired by time geography and opportunities for students’ reflections and learning.
The assignment
The course introduced students to geographic perspectives on globalization and sustainability through readings and lectures. In addition, students were introduced to the time-geographic perspective. The assignment required students to collect data from the Internet, through interviews, from reports, media, and so forth that were relevant to the assignment, according to how they defined the scope of their contextual analysis.
A brief description of the assignment and the sequential order of the time-geographic analysis in parenthesis is presented in :
Table 2. The assignment.
The students begin by reconstructing and graphically describing the whole commodity chain in time and space. They collect information about sustainability challenges and identify production phases regarding collection, processing, distribution, consumption, and waste management. The data also serve to identify subprojects in pockets of local order to locate phases of the production system in different places globally, regionally, nationally, and locally. Next, the students reconstruct the time sequence of the individual path in a time-geographic diagram to give a picture of the whole process, its separate phases, and how they are linked to each other in time and space. In their analysis, they identify sustainability challenges with reference to the whole commodity chain, in one or several subprojects, and their specific contexts.
After reconstructing time-geographic production systems graphically, students pose questions about topics to be discussed in different contexts ().
Table 3. Inquiries to time-geographic graphs and data.
Same, same – but different: time geography, concepts and description
Characteristic of traditional educational materials used to perform life-cycle analysis is that students are instructed to insert data into a table and reflect on questions about predefined sustainability challenges in individual production phases. Sustainability challenges may, for example, refer to use of water, energy or chemicals, or emissions. Such tables often lack references to time, place, and space. The time-geographic approach is more open, in the sense that sustainability challenges are not given in advance. Instead, the assignment in our model is about identifying such challenges through the time-geographic analysis of facts emerging through contexts. Another characteristic of the traditional life-cycle approach is that the focus of analysis tends to be on immediate activities and effects of proximate character. The time-geographic approach enables analysis of linkages between production phases in time and space that go beyond the immediate. As such, they are of an ultimate character and defined in wider time-space contexts.
Hägerstrand developed time geography with the aim of contextualizing human-environment relationships (Ellegård, Citation2019). He suggested a contextual analysis where the issue is the context in which an object is embedded. The purpose of the analysis is to establish the properties an object gains from the context and how the object behaves in different contexts. Altogether, he pictured it as all-ecologic, with systemic connotations to describe and analyze interactions between mankind and natural and manmade resources, activities, events, and processes and the contexts they belong in (Ellegård, Citation2019; Hägerstrand, Citation1993, Citation1970, Citation1974; Hägerstrand, Ellegård, Svedin, & Lenntorp, Citation2009). Time geography helps to structure and analyze how people’s everyday lives are intertwined with the local and global processes shaping their context.
A number of time-geographic concepts and graphic illustrations are presented to illustrate and structure people’s everyday lives with regards to activities and how these lives and activities are linked to sequences of activities in production. Being able to identify such relationships should help students explain challenges and define strategies for sustainability.
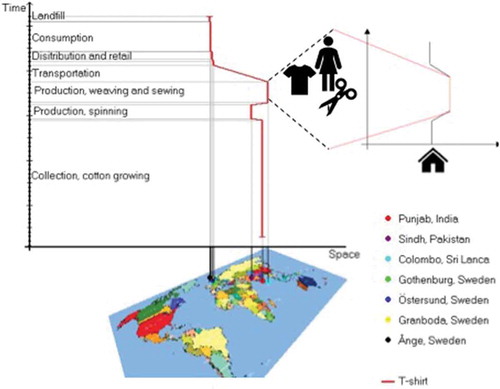
Below, a model example of a commodity chain to produce a T-shirt specifies several locations and production phases (including their sequential order) involved in the commodity chain ().
Figure 2. Graphical model description of the commodity chain of a T-shirt in time and space and of contextual relationships with workers’ everyday lives. Two diagrams are linked demonstrating that the sewing activities performed by a woman belong to an organizational subproject (labor) in the context of the commodity chain, and to an individual subproject (livelihood) of the woman’s personal everyday life. Sources: Map (All Kind of maps, Citation2019). The graph was created in Geotime (Blom Mondlane & Jansund, Citation2003) and the data are partially fictive and partially from educational material published by the Swedish Society for Nature Conservation to analyze the life cycle of a T-shirt and the related sustainability challenges (Energifallet, Citation2018).
Hägerstrand developed the individual path to describe and analyze individuals’ spatial behavior, social, and environmental interactions (Hägerstrand, Citation1982). In the time-space arena, individual paths illustrate the location and movement of people and other physical objects over time. As such, the individual path can be used to trace a persons’ daily activities but also a commodity’s life cycle or biographic past. It involves identifying phases of collection of inputs to be processed and assembled, sequences of transportation, distribution, consumption, and finally disposal or recycling. It also involves many different individuals. Conditions for production vary in different locations in the world. As students reconstruct a commodity chain, they identify such conditions gaining understanding about why each commodity has its own production process that requires infrastructure and partial processes to be carried out in a certain order. Traditional life-cycle analysis is often complex, describing production phases and related sustainability challenges appearing in the system. The time-geographic description illustrates graphically how parts of the system are linked together in sequential and spatial relationships. The full life path of a commodity chain represents the structure of the overall project to produce this specific commodity in time and space. As such, the outcome can be analyzed in terms of how production processes, people’s daily lives, global processes, and local contexts are linked to each other along the individual path of the commodity. For instance, how consumers in a one part of the world make daily consumer choices and thus define contextual conditions for workers in a previous phase of the production process somewhere else.
The approach allows students to expand and complement the graphical description, when relevant, with additional graphs on smaller geographical scales, to make the analysis more detailed. For instance, a sustainability challenge in a factory or in farming practices could be analyzed at the factory floor or in connection with the household. Everyday life is made up of the activities people and organizations perform to fulfill projects in different locations. Projects are goal oriented and can be from an individual’s perspective – so-called individual projects – or from an organization’s perspective, so-called organizational projects (Westermark, Citation2003). Consequently, a worker pursues his or her individual livelihood project while participating in the organizational project of, for instance, his or her employer (Blom Mondlane & Jansund, Citation2003; Jansund & Westermark, Citation2013).
People always carry out activities within the framework of organizations, households, corporations or other domains, thus giving these organizations power and authority (Ellegård, Citation1998, Citation2019). A pocket of local order is defined by a domain where an order of activities is maintained as a result of how power is distributed and executed, making resources available to individuals, organizations, and society to fulfill goals of projects. The concept is useful in the study of production systems and for students to define parts in the whole and how they relate to each other (Lenntorp, Citation1998). Pockets of local order may be defined at different geographical scales, and they are also contained within each other, as they represent different domains of power, for instance, a multinational corporation, national laws, and international agreements. In this perspective, the time-geographic perspective can contribute to learning about authority constraints, the role actors play in everyday situations and domains. Additionally, actors must constantly adapt to changes in the external world. The overall structure of the commodity chain is a result of globalization and is maintained as long as no significant change occurs in global and local contexts. By comparing graphs between different points in time students can identify changes somewhere in the system. Another contextual relationship refers to how subprojects are linked to each other and need to be performed in a certain order to finalize the commodity. Inputs need to be available in the right place at the right time. “Couplings in time and space” … “is a main issue for time geography” … “making the location of people and resources essential” (Ellegård, Citation2019, p. 3–4).
External or internal events that impact production processes may also be analyzed with respect to sustainability effects in the overall pocket of local order, in production phases, local communities, and people’s everyday lives.
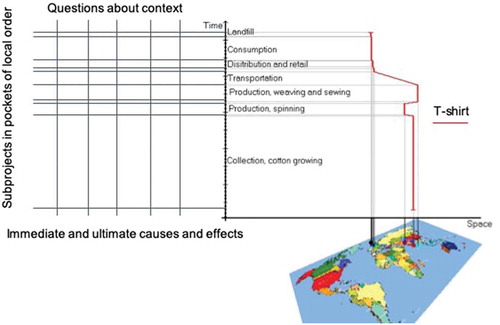
In sustainability challenges are identified by applying a grid to the graph defining individual pockets of local order. Each can be analyzed with reference to how sustainability challenges appear as environmental, social, and/or economic dimensions. Questions about the immediate and ultimate causes behind such challenges and the effects of these causes refer to contextual relationships in time and space, and the time-geographic constraints.
Figure 3. Graphical description of grid to analyze sustainability challenges in contexts.
Assessing contextual learning
In the following section, we analyze the learning outcome of how students performed this analysis.
Findings regarding learning
The outcome of the assignment was reported by students in written form and in a discussion seminar. The following findings were identified, based on a review of the written reports, considering two general aspects of the learning objectives: How did students reconstruct and describe the commodity chain/production system? How did the students identify and reflect on sustainability challenges in context? The first question is focused on students’ abilities to understand time geography, to apply it to collected data, to graphically illustrate the data, and to make use of the time-geographic concepts. The second question refers to students’ abilities to analyze the graph(s) and to identify and pose questions about sustainability challenges and the causes behind them in time and space, referring to multiple dimensions and their interrelationships; in other words, to demonstrate contextual learning. The following questions were posed when reviewing students’ papers ():
Table 4. Questions regarding learning.
All the questions refer to learning. However, learning may be experienced differently by teachers and students. Learning may be analyzed as an outcome by referring to goals in the curricula and to teachers’ expectations in assignments. Therefore, the last question gave the students an opportunity to explicitly reflect on their perceptions of how this teaching approach facilitated their learning.
How did students reconstruct and describe the commodity chain/production system?
In our review of students’ graphic descriptions (), we assessed if they had been able to grasp the time-geographic perspective and if they had managed to apply it in the graphic reconstruction of a commodity chain with its different subprojects, in a sequential order, including spatial locations and relationships in time and space. Papers were sorted into different groups to identify variations.
Table 5. Group variations in graphic reconstruction and description of a commodity chain (24 papers).
Our general findings showed that:
The final phases of distribution, consumption, and waste management tended to be omitted.
Collection of raw materials, transportation, manufacturing, and processing were included.
Some transportation linkages were missed in the graph or not commented upon.
Even though not all papers were complete in their graphic descriptions, we found that all papers (24) made use of the time-geographic concept of pocket of local order and more than half of the papers (15) referred explicitly to the concept of project. Both concepts were applied to illustrate how the commodity chain is geographically dispersed over several locations on the surface of the Earth and how locations are linked together. They also made thorough use of time-geographic concepts when reflecting on chain effects as a result of an event somewhere in the commodity chain.
Several papers (9) explicitly made use of the time-geographic concept of authority constraints to identify power relations, rules, and regulations, while the others reflected on the same type of factors impacting sustainability without referring to the concept. This, however, was not an indicator of how well the analysis was performed or the level of understanding. Authority constraints that were mentioned covered many different types of regulations. Some papers applied it to define how rules at different geographical scales impact specific pockets of local order. Several papers concluded that although regulations intend to regulate human activities to safeguard sustainability, the fact that they aim to or only hold power over bounded domains results in an outcome that may be negative in other pockets of local order. When solving a problem in one pocket of local order, regulations may also transfer a sustainability problem to another.
Altogether, the students were very ambitious in performing the assignment, even if there was great variation in how they solved it. Not all grasped the time-geographic perspective, and some failed to apply it in full. Others grasped the approach but made decisions about scope that limited the analysis to individual subprojects. Other possible explanations may be lack of time and/or lack of access to information.
How did the students identify and reflect on sustainability challenges in context?
As expected, great variation in students’ identification and reflections on sustainability challenges emerged. There are multiple ways to solve the assignment, and students were encouraged to be creative in their approaches. Students delimited their studies and defined specific objectives to focus on. Access to data varied greatly depending on choice of commodity and company. As mentioned above, students also demonstrated varied capacities to apply the time-geographic perspective and concepts. It was obvious that some groups had more ambitious aims than others in performing the contextual analysis. In general, those with high ambitions in applying the time-geographic analysis also demonstrated more elaborate reflections regarding causes and effects behind issues of sustainability. Students brought forward examples of companies’ good and bad practices regarding sustainability challenges and strategies for change.
Altogether, the reports included the following examples of reflections on sustainability challenges in context:
References to individual and/or integrated sustainability dimensions and topics: social, ecological, and economic
References to sequential and spatial linkages
Reflections regarding proximate and ultimate effects and causations
Reflections about strategies for change
Identification of sustainability challenges
Sustainability challenges are referred to as social, environmental, and economic. We found that all papers included reflections referring to an integrated perspective on sustainability dimensions. They all proved that it is necessary to relate dimensions to each other with the objective of analyzing if, with regard to sustainability, one dimension is benefiting at the expense of another, or if they are in balance.
Students identified sustainability challenges in the context of the commodity chain in the following ways:
All papers included reflections on social and environmental aspects of sustainability in the first phase of the commodity chain/pocket of local order, including activities such as collection, extraction, and harvesting.
Some papers were limited to identifying relationships between sustainability challenges within a single pocket of local order.
Several papers deliberately aimed to identify challenges in several separate phases/pockets of local order and reflected on their causes and effects in the context of the others.
When it comes to students’ reflections on sustainability challenges and their causes and effects in context, we found the following:
Most papers identified immediate production processes and sustainability challenges in individual pockets of local order (proximate). Their analysis of causes and effects, however, referred to different geographic scales and sequences in the commodity chain (ultimate).
Some focused on proximate and ultimate causes and effects that integrate the dimensions of sustainability.
Some focused on identifying linkages in the sequences of the commodity chain per se to understand a single sustainability topic through the whole sequence. For instance, transportation was identified as the main sustainability challenge for a selected multinational company and commodity.
Variations between groups
All papers in Group 1 demonstrated strong abilities to apply the time-geographic perspective, both graphically and in written reflections. They also made linkages between proximate effects and ultimate causes and defined strategies for change at different geographical scales.
The general pattern of Group 2 demonstrated references to both proximate and ultimate causes and effects. Even though they did not complete their graphical description, they made references that link pockets of local order in sequences in their analysis and referred to contextual reflections within pockets of local order.
Papers from Group 3 varied in their application of the time-geographic perspective. Even if the graphical description was weak, some made use of the time-geographic perspective in their analysis. Most were limited to a single pocket of local order at national level and referred to proximate causes and effects and strategies for change nationally and locally. Hence, sequential linkages in the commodity chain were not included.
Graphical and written reflections on everyday life
Everyday life outside work was referred to by several papers in specific subprojects in pockets of local order, regarding consumer behavior, working conditions, health matters, and livelihood needs. One paper focused on sustainability conditions affecting people’s everyday lives in all pockets of local order of the commodity chain referring to local and global causes.
However, only two examples were identified of additional time-geographic graphical descriptions of local processes complementing the global commodity chain. These examples illustrate improved labor conditions in a field, and improved educational opportunities for children in a household as a result of the introduction of fair-trade regulations. This may be due to the time constraints, limitations in access to information and the fact that it was not a requirement in the assignment. One paper mentions that it was difficult to access accurate information at the household, farming, and factory levels. Therefore, some reflections had to be hypothetical in the bigger context of the global commodity chain.
The student groups tended to choose commodities that they themselves consume in their personal everyday lives. They also chose multinational companies that have at least one production phase located in their personal everyday proximities. Papers included many comments and conclusions referring to personal consumption patterns, as well as expectations and suggestions of strategies for change that would make their personal consumption and everyday lives more sustainable.
How did students reflect on change processes?
Change is embedded in several aspects of the assignment. First, the assignment requires students to identify processes and relationships in time to construct the time-geographic graph, and subsequently to conduct the contextual analysis in time and space. Second, change is about identifying challenges in the past and dealing with them in the present and the future. Third, the assignment demands students reflect explicitly on how the production system they had reconstructed as a whole and in different subprojects could be affected by a change somewhere in the system. Fourth, students are asked to reflect on examples of good and bad sustainability strategies in their own reports and in discussions of fellow students’ reports.
The student papers highlighted many different examples of strategies aimed at eliminating effects of global processes in local contexts. They concerned the dissemination and application of human rights, corporate social and environmental responsibility, gender equality, abolition and regulation of child labor, and environmental certifications. Students reflected on the meaning of development, referring both to linear and cyclical perspectives and to development strategies that are more or less effective when dealing with concrete problems. For example, students discussed globalization and international trade versus local alternatives for consumption, and the effects changes in everyday choices could have over time on people in different places involved in the commodity chain. They reflected on if and how globalization should be controlled. Such discussions referred, among other things, to roles, capacities, and responsibilities of individuals, states, companies, and organizations at different geographical scales.
We identified the following patterns of students’ reflections on change:
Change was embedded and explicit in the identification of causes at different geographic scales, depending on how the objective was formulated by each student group.
Students referred to strategies as a result of their identification of the scope of their study and with reference to problems at different geographic scales. Students referred to change as a result of the implementation of a strategy or external cause, such as a natural disaster, conflict, and so forth, and how such a change may affect several pockets of local order in the sequence.
One paper exemplified how changed consumer behavior in subprojects in one pocket of local order through improved labelling may affect several pockets of local order in the commodity chain.
Examples of student references to proximate and immediate causes and effects included students’ descriptions and analysis of production processes in specific pockets of local order. For instance, they referred to work environments, health problems, use of chemicals, energy, water and pesticides, and so forth, which are both causes and effects in concrete situations and local processes.
Examples of students’ reflections on ultimate causes and effects included reflections on lifestyles in the North that determine consumption and demand for cheap commodities emanating from the South. Another example which was often referred to is that how a business plans for the whole commodity chain incurs both ultimate and proximate effects. Proximate opportunities may also contribute to ultimate structures and power relations.
How did students reflect on learning?
One part of the assignment involves students’ own comments and reflections on the time-geographic perspective and its strengths and weaknesses – compared to a traditional map – in helping them to understand and reflect on commodity chains and sustainability. Students were unanimous in pointing out that the traditional map is easier to understand, it gives an immediate, and general overview of spatial locations involved in the production process, it provides quick information, and it does not require any previous training. However, almost all the papers stated that the traditional map is not sufficient to describe processes in space. Other weaknesses referred to it being one dimensional, static, less detailed, does not include the time used for production as a whole, in different parts, or for transportation, failing to show the order of phases in the production, and how they are linked to each other.
Instead, time geography made them able to describe pockets of local order and how they are orderly related in time and space. This also helped them to identify and analyze causes and effects, in the system as a whole or in individual pockets of local order, resulting from irregularities or sudden events. Students emphasized the utility of the time-geographic graphic and its concepts for reflecting on change in several phases and sequences.
It became very clear that the graphic description particularly served to make transportation in the commodity chain visible to the students. Circumstances around transportation became evident in several phases of the production system, and students made statements about the importance of analyzing transportation and its characteristics, even if that was not the initial objective and scope of their individual studies. Several papers (19) explicitly say that the time-geographic diagram contains more information, is better for detailed and deep analysis (6) allowing them to identify the whole process of production in time and space, and to gain insight into the order of complex relations between parts (18).
On the negative side, students stated that the time-geographic perspective and graphical description is more complicated and required training. It is more time consuming to perform and understand. When many pockets of local order are identified it becomes more difficult to visualize spatial locations. The diagram can become very complex and “messy”. Even if many wrote that time geography was useful to combine with a traditional map, it was clear that not all of the students had grasped this combination in the graphical part of the exercise. In those cases, the subsequent analysis proved less fruitful.
Discussion
The analysis of sustainability is indeed complex. This is common knowledge in education for sustainable development. Teachers and students are important present and future stewards of the Earth, and they need tools to teach and opportunities to practice and learn how to do this type of analysis. The objective of this article is to present a time-geographic teaching approach to structuring and systematically identifying and analyzing multidimensional sustainability challenges in geographic contexts, and to assess learning from this teaching approach.
Of 48 student exam papers, 24 were reviewed, applying a contextual analysis to their reflections. General patterns from this analysis were confirmed in a retrospective review of the remaining papers. We particularly wanted to get an overall picture of if and how the time-geographic perspective could increase students’ awareness and their abilities to identify processes of change in time and space, links between geographical locations, scales, and different time perspectives, and relate them to sustainability challenges, and everyday life.
As suggested in previous research about education for sustainable development (Wals & Rodela, Citation2014), an important point of departure was to not predefine sustainability challenges, so as to acknowledge the importance of change and multiple perspectives and contexts. On a general level, we found that the teaching approach allowed for multiple descriptions and reflections by students. Students were able to identify and reflect on sustainability challenges and effects from social, economic, and environmental perspectives and referred to different stakeholders, at different geographical scales (Gibson & Fox, Citation2018; Wals & Lenglet, Citation2016). The systemic constitution of time-geography (Ellegård, Citation2019; Hägerstrand et al., Citation2009), developed students’ abilities to apply basic geographic concepts to personal and global sustainability challenges. The course context of the assignment offered students the opportunity to refer to different geographic perspectives including population, development, economy, resources, politics, culture, urban and rural landscapes. The time-geographic worldview and concepts proved essential for students to structure the complexity of a commodity chain graphically in time and space. Making use of the graphical description students identified and reflected on proximate and ultimate causations in the production system of a commodity (Gibson & Fox, Citation2018). Students had chosen commodities of their proximate environment that they use in their personal everyday lives and that received attention in media. Their reflections and discussions linked to ultimate circumstances and strategies to change personal everyday lives.
To assess learning we posed the question of whether it was possible to conclude that those papers that identified the commodity chain with reference to more than one pocket of local order also performed better in the contextual analysis. What contextual reflections did students make regarding challenges and strategies, and how did they problematize them in relation to geographical scales, restrictions, and everyday life?
All papers in Group 1 (about one-third of the papers) demonstrated strong abilities to apply the time-geographic perspective both graphically and in written reflections. All papers in this group made linkages between proximate effects and ultimate causes and defined strategies for change at different geographical scales. Papers from Group 3 (about one tenth of the papers) varied in their application of the time-geographic perspective. Even if the graphical description was weak, some made use of the time-geographic perspective in their analysis. Most were limited to a single pocket of local order at the national level and referred to proximate causes and effects and strategies for change nationally and locally. Hence, sequential linkages in the commodity chain were not included.
Papers in Group 2 (the majority of the papers) reflected on both proximate and ultimate causes and effects. They made references that linked pockets of local order in sequence in their analysis and referred to contextual reflections within pockets of local order.
From this, it is clear that students trained their abilities and improved their competences to perform complex, critical, strategic, analytical, and systems thinking (Missimer & Connell, Citation2012). But it is also evident that they did so to a varying extent. Systems thinking was developed through students’ application of time-geographic concepts and graphics, reflecting on interdimensional relations in time and space and regarding the multiple dimensions of sustainability. Critical thinking concerns the ways students negotiated in their groups, delimited the scope, and defined questions to be answered through their research, reflections, and analysis. Working in groups was important since the time-geographic perspective and concepts were new to all students. It required students not only to learn the concepts but also to understand how they relate to each other and use them in practical learning. Being able to discuss in groups played an important role here. Student’s developed and applied strategic thinking as they presented proposals for strategies for change with different stakeholder, scale levels, and time perspectives. Group work also allowed students to practice team work and to develop communication skills among other skills that working with others demanded (Missimer & Connell, Citation2012). This study, however, did not provide data to assess the actual group work process and how individuals interacted in the group work. On a personal level, each student was expected to gain an opportunity to reflect on and self-evaluate individual behavior with respect to findings in the group work and also by discussing findings of other groups’ work in a seminar. As such, the time-geographical teaching approach provided opportunities to reason on the basis of different experiences and issues in accordance with the socio-cultural approach to learning (Claesson, Citation2007; Säljö, Citation2000). In a teaching and learning context, we found that this led to interesting discussions because the same illustration could be interpreted in different ways, thereby suggesting different identifications of causes behind a problem as well as solutions from different student perspectives (Blom Mondlane & Jansund, Citation2003). Altogether, the approach was highly experiential allowing the students to take personal action and critically engage in the whole process (Lotz-Sisitka et al., Citation2010; Missimer & Connell, Citation2012).
Conclusion
From the above, we conclude that it was not necessary to make a complete graphic reconstruction of the commodity chain to perform a contextual analysis. On the contrary, students had to make choices throughout the analysis, and they had to delimit their studies. A factor which affected the outcome was access to information. Information was not available for all aspects, and students had to adapt accordingly.
Students were given the opportunity to apply geographic and time-geographic concepts in practice. Working with time, place, distance, and scales became natural. The majority of the students became aware of linkages in time and space and developed an ability to make this type of analysis. Students who had not managed to grasp the time-geographic perspective performed less strongly.
The fact that students had different commodities and that they solved the assignment in so many different ways in terms of context meant that they also learned from each other, as they presented their results in a seminar and actively engaged in discussion of alternative solutions to each other’s papers. However, time geography was not always obvious and easy to grasp in the beginning. Some quickly broke the code and others had difficulties. From the written reports it was impossible to single out which individuals broke the code and who did not. This is an aspect we teachers need to give more attention to, making sure all learners in each group participate, contribute and gain equally from the process. The importance of group discussions and their dynamic merit more attention in the learning process of new concepts.
The assignment is about change in many aspects and aims to transform students’ perspectives and knowledge about geographic relationships, globalization, commodity chains, sustainable development, as well as their personal everyday lives and those of others. In the interconnected and interdependent world people live in today, it is obvious that static maps are insufficient. Students expressed that many of their presumptions were confirmed; however, they also often commented that they were wrong about the structure of a commodity chain, about good and bad behavior in terms of sustainability, and about positive and negative conditions in the global and local context.
Even if, for some, time geography initially proved to be demanding to grasp, we found that when it did fall into place, when students developed skills to describe and reflect on interactions in time and space and became aware of how everything is related, an amazing world of awareness and potential for change became available to them. We therefore conclude that the time-geographic teaching approach did make a positive difference for students’ deep learning and, hopefully, for the planet and its various actors.
Disclosure statement
No potential conflict of interest was reported by the authors.
References
- All kind of maps. (2019, January). High Resolution 1080P World Map World Map Colour World Map Political Hd World Map A3 Printable Free World Map I Hd World Maps Images Free Downloads. Retrieved from https://eur02.safelinks.protection.outlook.com/?url=https%3A%2F%2Fofsilentforce.com%2F836040_75_finic%2F836046_high_res%2F&data=02%7C01%7Casa.westermark%40ju.se%7C0cdc035880594bdb784208d72f7cbd03%7C7564bc8f37384b4dbd575a02ca6215fb%7C0%7C0%7C637030085104627446&sdata=t5%2BlfMdQ0IYMfZctBc7EZ26Qo07ABygi7k1OxHXF6Bc%3D&reserved=
- Björneloo, I. (2007). Innebörder av hållbar utveckling: en studie av lärares utsagor av undervisning (Doctoral dissertation). Acta Universitatis Gothoburgensis, Göteborg, Göteborg
- Blom Mondlane, U., & Jansund, B. (2003). Geografi - didaktik - praktik : interaktiva studier av förloppslandskapet (Doctoral dissertation) Kulturgeografiska institutionen, Handelshögskolan, Göteborgs universitet, Göteborg.
- Claesson, S. (2007). Spår av teorier i praktiken: Några skolexempel. Lund: Studentlitteratur.
- Clark, I. F., & Zeegers, Y. (2015). Challenging students’ perceptions of sustainability using an earth systems science approach. Journal of Geography in Higher Education, 39(2), 260–274.
- Ellegård, K. (1998). Under ytan - ingångar till det kulturgeografiska äventyret. In M. Gren & P.-O. Hallin (Eds.), Svensk kulturgeografi: En exkursion inför 2000-talet (pp. 86–116). Lund: Studentlitteratur.
- Ellegård, K. (2019). Thinking time geography: Concepts, methods and applications. Oxon: Routledge.
- Energifallet. (2018, December 24). Instruktion: Gör en Livscykelanalys! [Student instructions to perform an LCA of a T-shirt]. Retrieved from https://www.naturskyddsforeningen.se/sites/default/files/dokument-media/Elevinstruktion_LCA_2017_0.pdf
- Gibson, R., & Fox, M. (2018, December 15). Simple, complex and wicked problems. Retrieved from https://mofox.com/wp-content/uploads/2018/10/Simple-Complex-Wicked-Problems-SummaryChart.pdf
- Gothenburg University. (2007–2015). Människans aktitiviteter och nyttjande av jordens resurser. GEO400. Syllabus 30 higher education credits, Geography Introductory level, First Cycle. Sweden: Author. Retrieved 2019. June.10.
- Hägerstrand, T. (1970). What about people in regional science? Regional Science Association Papers, 24, 7–21.
- Hägerstrand, T. (1974). Tidsgeografisk beskrivning. Syfte och postulat. In K. E. Bergsten (Ed.), Svensk geografisk årsbok(pp. 87–94). Lund: Sydsvenska geografiska sällskapet.
- Hägerstrand, T. (1982). Dioroama, path and project. Tijdschrift Voor Economische Sociale Geografie, 73(6), 323–339.
- Hägerstrand, T. (1993). Samhälle och natur, in Region- och miljöekologiska perspektiv på den rumsliga närings- och bosättningsstrukturen. NordREFO, 1993(1), 14–59.
- Hägerstrand, T., Ellegård, K., Svedin, U., & Lenntorp, B. (2009). Tillvaroväven. Stockholm: Forskningsrådet Formas.
- Jansund, B., & Westermark, Å. (2013). Tidsgeografi i undervisning för hållbar utveckling: En helhetsorienterad tankemodell. Geografiska Notiser, 71(1), 24–40.
- Knox, P. L., & Marston, S. A. (2014). Places and regions in global context: Human geography (6th ed.). Upper Saddle River, N.J.: Pearson Education.
- Leicht, A., Heiss, J., & Byun, W. J. (Eds). (2018). Issues and trends in education for sustainable development. Paris: UNESCO.
- Lenntorp, B. (1998). Orienteringsanvisning i ett forskningslandskap. In M. Gren & P.-O. Hallin (Eds.), Svensk kulturgeografi: En exkursion inför 2000-talet (pp. 86–116). Lund: Studentlitteratur.
- Lotz-Sisitka, H., O’Donoghue, R., & Wilmot, D. (2010). The makana regional centre of expertise. Experiments in social learning (Vol. 4, pp. 73–92). Los Angeles, London, New Delhi, Singapore and Washington DC: SAGE Publications.
- Marton, F., & Säljö, R. (2005). Approaches to learning. In F. Marton, D. Hounsell, & N. Entwistle (Eds.), The experience of learning: Implications for teaching and studying in higher education. (3rd ed., pp. 39–58). Eds. Edinburgh: University of Edinburgh, Centre for Teaching, Learning and Assessment.
- Missimer, M., & Connell, T. (2012). Pedagogical approaches and design aspects to enable leadership for sustainable development. Sustainability: the Journal of Record, 5(3), 172–181.
- Moseley, W. G. (2005). Global cotton and local environmental management: The political ecology of rich and poor small-hold farmers in southern Mali. The Geographical Journal, 171(1), 36–55.
- Moseley, W. G., Perramond, E., Hapke, H. M., & Laris, P. (2013). An introduction to human-environment geography: Local dynamics and global processes. Hoboken, NJ: Wiley-Blackwell.
- Säljö, R. (2000). Lärande i praktiken: Ett sociokulturellt perspektiv. Stockholm: Prisma.
- Savage, E., Tapics, T., Evarts, J., Wilson, J., & Tirone, S. (2019). Experiential learning for sustainability leadership in higher education. International Journal of Sustainability in Higher Education, 16(5), 692–705.
- Schuler, S., Fanta, D., Rosenkraenzer, F., & Riess, W. (2018). Systems thinking within the scope of education for sustainable development (ESD) – A heuristic competence model as a basis for (science) teacher education. Journal of Geography in Higher Education, 42(2), 192–204.
- Smith, M. (2009). A questionnaire survey: teaching about sustainable development in school geography. GeogEd E-Journal, 3(1). Article 2. Retrieved from https://www.geography.org.uk/write/mediauploads/research%20library/ga_geogedvol3i1a2.pdf
- Tani, S. (2011). Is there a place for young people in the geography curriculum? Analysis of theaims and contents of the Finnish comprehensive school curricula. Nordidactica - Journal of Humanities and Social Science Education, 1, 26–39.
- Thrift, N. (2009). Space: The fundamental stuff of geography. In N. J. Clifford, S. L. Holloway, S. P. Rice, & G. Valentine (Eds.), Key concepts in geography (2nd ed., pp. 85–96). London: SAGE.
- Tilbury, D. (2011). Assessing ESD experiences during the DESD: An expert review on processes and learning for ESD. Paris: UNESCO.
- UNESCO. (2012). Shaping the education of tomorrow 2012 report on the UN decade of education for sustainable development, abridged. Paris: Author.
- Wals, A. E. J., & Lenglet, F. (2016). Sustainability Citizens: collaborative and disruptive social learning. In R. Horne, J. Fien, B. B. Beza, & A. Nelson (Eds.), Sustainability citizenship in cities: Theory and practice(pp. 52–66). e-book: Earthscan from Routledge.
- Wals, A. E. J., & Rodela, R. (2014). Social learning towards sustainability: Problematic, perspectives and promise. NJAS - Wageningen Journal of Life Sciences, 69, 1–3.
- Westermark, Å. (2003). Informal livelihoods: women’s biographies and reflections about everyday life. A time-geographic analysis in urban Colombia (Doctoral dissertation) Kulturgeografiska institutionen, Handelshögskolan, Göteborgs universitet, Göteborg.