
ABSTRACT
Geographic technologies and perspectives are important for understanding health issues because places and locations influence human health and diseases. Despite the increasing use of a geographic information system (GIS) in health research, and the explosion of new and emerging technologies, little is known about their potential as educational tools for health geography and the effectiveness for student learning. Focusing on air-sensing and web GIS technologies, this article presents an innovative pedagogical strategy to integrate these technologies as tools for field-based learning in health geography and discusses the effectiveness and challenges of this teaching method. A class project, undertaken in a university health geography course, was developed to offer students hands-on training and real-world experience with state-of-the-art technologies. It consisted of (1) a lecture and pre-fieldwork training; (2) field data collection using a low-cost, GPS-enabled portable air-pollution sensor; (3) data visualization using web GIS; and (4) sharing the findings through a web-based story map application. The successful implementation of the teaching method, as indicated by students’ positive comments, demonstrated that such class projects can reinforce students’ knowledge of air pollution and health risks; improve their technical, critical thinking, and research skills; and prepare students for entering a technology-driven society.
Introduction
Geography and health are intrinsically linked because places and locations influence human health and diseases. Geographic perspectives and technologies are therefore crucial for understanding public health, environmental health, and medical issues (Kistemann et al., Citation2002; Richardson et al., Citation2013). The field of health geography (also called medical geography) is well positioned to investigate the spatial aspects of these issues by integrating a geographic information system (GIS) as a core research component (Richard et al., Citation2005). A GIS is a computer-based system used to capture, store, display, and analyze geographic information. It allows health researchers to visualize health data in the form of a map, examine the spatial distribution of health risk factors, identify spatial clusters of health events and potential causes of clustering, track changes in disease rates, measure access to health care, and more (Cromley, Citation2019; Hohl et al., Citation2020; MacQuillan et al., Citation2017). A geographic understanding of health events contributes to controlling and preventing disease, making scientifically informed public health decisions, and planning better healthcare (Richardson et al., Citation2013). Over the last decade, GIS has evolved rapidly due to advances in global positioning systems (GPS); Internet, wireless, and mobile technologies; the Internet of Things (IoT); and handheld devices (e.g., smartphones and low-cost sensors) (Gao & Mai, Citation2016). However, despite the increasing use of these emerging technologies in health-related research (e.g., Birenboim et al. Citation2019; Gaskins, A. J. and J. E. Hart, Citation2019; Ma et al., Citation2020) and GIS/geography education in general (e.g., Medzini et al., Citation2015; Pánek, J. and M. Glass, Citation2018; Schlossberg & Wyss, Citation2007), little research has examined their potential as educational tools for health/medical geography and the effectiveness for student learning.
University health geography courses currently focus on teaching basic GIS techniques for mapping, and traditional spatial methods for analyzing spatial health data, using desktop GIS software. Although the latest GIS technologies are occasionally taught, they are often introduced in the form of a lecture or discussion, without hands-on training and real-world experience (Carlson, Citation2007; Cliffe, Citation2019). However, geographical pedagogy has shifted from traditional, instructor-oriented, passive learning in a fixed place toward more hands-on, student-led, active learning in any place where students can be active learners (France et al., Citation2020). Therefore, health/medical geography education should be designed to offer students field-based learning opportunities to explore complex spatial questions relating to environmental health issues in real-world settings. Field-based learning, which occurs outside traditional classrooms, enables students to establish connections between their coursework and their everyday lives through direct interaction with the environment (Das & Chatterjea, Citation2018; Pánek, J. and M. Glass, Citation2018). It facilitates a holistic geographic understanding of issues and allows students to take ownership of their understanding and experiences by fostering active student engagement with learning activities.
The mobile technologies that have emerged in recent years have enormous potential for field-based learning in health and medical geography. With technologies that can be used in the field, health geography education is no longer limited to classrooms and desktop GIS; it can occur in places that are familiar to students, such as their homes, schools, and local communities (Carlson, Citation2007; Gao et al., Citation2018; Spronken-Smith & Kingham, Citation2009). An important but less recognized pedagogical question that arises when integrating such technologies into teaching is whether the technologies truly facilitate student learning and increase their engagement. Some researchers claimed that “digital natives,” – the new generation of students who have grown up in the era of ubiquitous technology – feel comfortable with the integration of new technologies into learning contexts and use them intuitively for effective learning, but there is little evidence to support these claims (Thompson, Citation2013). Bennet et al. (Citation2008) and Holloway et al. (Citation2020) went further and pointed out that assuming that all students are digital natives is highly problematic and may make the incorporation of new technologies into student learning ineffective. This suggests that the integration of new technologies into field-based learning must be carefully designed and aligned with clear pedagogical intentions to enhance learning for students both with and without technical expertise (France et al., Citation2020; Holloway et al., Citation2020; Pánek, J. and M. Glass, Citation2018). The development of effective pedagogical strategies, and the careful selection of technologies/tools that do not require steep learning curves, are vital for ensuring all students enjoy their field experience and achieve intended learning objectives through the technologies, rather than struggling to use the technology itself.
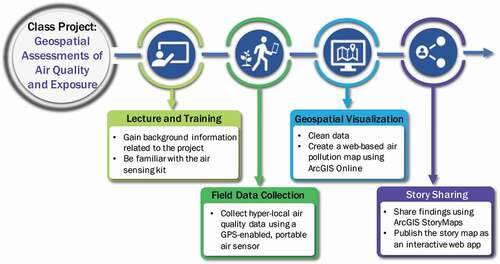
This paper presents an innovative pedagogical strategy to incorporate air-sensor and web-mapping technologies as tools for field-based learning in health geography and demonstrates the effectiveness and challenges of this teaching method by providing a real-world example of the implementation. These technologies are particularly relevant to health geography and have gained significant attention in health-related fields, GIS communities, and federal agencies over the last decade, due to their potentially substantial impact on future environmental health studies, geospatial landscapes, and regulations/policies (Richardson, Citation2017). As part of a university-level medical geography course, the author designed an air-sensing class project that utilized an easy-to-use, GPS-enabled, low-cost air-pollution sensor and web GIS to teach geospatial assessments of air quality and human exposure and to encourage students to think critically about air pollution in their surroundings, as well as potential health risks that they, their family, friends, and community may face. It was developed in a way that other instructors could easily replicate. It consisted of the following four phases: (1) a lecture and pre-fieldwork training; (2) field data collection (collection of georeferenced air pollution data) using GPS-enabled portable air-monitoring devices; (3) data visualization using web GIS software; and (4) sharing the findings through a web-based story map application.
The four learning objectives of the class project were as follows: (1) to understand the benefits and limitations of low-cost, portable air-pollution sensors and geospatial technologies for air-quality and exposure assessments; (2) to recognize how air pollution concentrations vary over space and time; (3) to understand how to visualize air pollution data and widely disseminate a map and findings using web GIS; and (4) to identify potential sources or human activities that may cause air pollution, as well as ways to reduce air pollution, exposure, and health risks. By involving students in a guided research project – in the formulation of research questions/hypotheses, data collection, data visualization/analysis, interpretation, and the dissemination of results – the activity was intended to develop both their technical skills and their critical thinking and research skills.
Materials and methods
Description of the course
The medical geography course offered by the Department of Geography, Planning, and Environment at East Carolina University (Greenville, North Carolina) introduced GIS and spatial analytical methods and their applications to public health, environmental health, and epidemiology. As an elective course, it targeted upper-level undergraduate and graduate students and was designed for students from various majors with little or no experience of GIS. The students who enrolled for the spring 2020 semester were from the geography major and other specializations, including public health, environmental health, urban planning, and anthropology. In the first half of the semester, students were taught the basic concepts of GIS technology and its applications to health-related fields; in the second half, they were introduced to more advanced topics and emerging technologies utilized in public and environmental health. The field-based, air-sensing class project was embedded in this second portion of the course to teach these advanced topics and technologies. Integrating a portable air sensor into a geography course was a new teaching method in the department’s geography and GIS curriculum.
GeoAir: a low-cost air-pollution monitor for health/medical geography education
Current commercially available low-cost air-monitoring devices do not fulfill the criteria for educational tools for field-based learning. Since most of them are designed for measurement only, they generally lack the features necessary for field-based learning, such as display screens and built-in GPS/data loggers/batteries. Many rely on a smartphone GPS to collect location data and use Bluetooth to connect the devices to smartphone applications to view and store air pollution data (Robinson et al., Citation2018). Furthermore, these mobile applications often work only on an Android phone or do not work well on low-quality phones, requiring instructors to purchase Android phones of reasonable quality in addition to air-monitoring devices to serve all students, and data are often lost when applications crash (Gaskins, A. J. and J. E. Hart, Citation2019; Robinson et al., Citation2018). A smartphone application connected to an air monitor often requires technical experience and/or a steep learning curve, causing students to struggle with unnecessarily complicated technical features, which may hinder students in achieving intended learning objectives.
To address these problems, a fully integrated, all-in-one air-pollution monitoring device, called “GeoAir”, was developed for the class project (). The hardware and software were designed and customized primarily for health geography education. GeoAir is a user-friendly, portable, low-cost (< US$110) device and does not depend on other mobile devices or smartphone applications because it has built-in GPS, data logger, and battery. With GeoAir, students can collect real-time personal air sampling, GPS location, temperature, and humidity data.
Figure 1. GeoAir: a low-cost, GPS-enabled, portable DIY air-monitoring device.
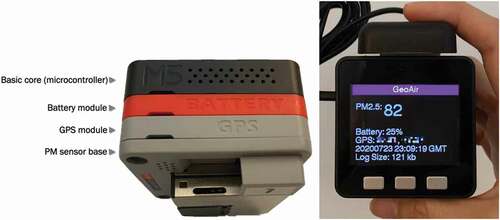
GeoAir was designed using a development kit created by M5Stack (Shenzhen, China), powered by an ESP32 core. It consists of multiple stackable M5Stack products (), including a basic core (microcontroller) with an LED display; a particulate-matter (PM) sensor base integrated with PMSA003 (a PM sensor developed by Plantower, Beijing, China) and SHT20 (a humidity and temperature sensor); a GPS module; and a 700 mAh lithium-ion polymer battery. Sensor performance was tested by previous studies, and the results demonstrated its high precision and acceptable accuracy (Badura et al., Citation2020; Levy Zamora et al., Citation2019; Zusman et al., Citation2020).
Several features make GeoAir an ideal educational tool for health geography. First, its portability and built-in GPS enable students to collect georeferenced air-pollution measurements at any location and time for subsequent geographic mapping and analyses and to test their hypotheses about air-pollution hot spots. These features also help students to identify possible sources of air pollution and of GPS errors in the field. Second, the built-in data logger (a micro SD card) enables students to easily transfer the data from the device to their personal computer for data visualization and analysis. Third, the LED display enables students to easily check the air quality in the field, and identify how PM concentrations vary significantly over space and time, while moving through multiple indoor and outdoor environments during data collection. Lastly, GeoAir is very easy to build (i.e., simply by stacking M5Stack modules with a little soldering); therefore, instructors with no electronic skill or knowledge can easily replicate it (open-source GeoAir software and instructions for making the hardware are available; see the note).
Description of the class project: geospatial assessments of air quality and exposure
Lecture, demonstration, and preparation for field-based learning activities
In the first phase of the air-sensing class project (), a lecture was given to provide students with background information, explain the reasons for the project, and outline the skills and knowledge they would gain. The lecture taught students about GIS applications for environmental health and exposure assessments and about geospatial and mobile technologies that allow high-resolution, real-time geospatial data collection. The lecture outlined the limitations of traditional GIS methods and the significant role of recent advances in GIS and emerging technologies in addressing limitations and improving understanding of air quality, human exposure, and their health effects. Students were also introduced to air-sensing technologies and their evolution. They learned about the 24-hour average PM breakpoints and their corresponding health effects (e.g., good, moderate, unhealthy for sensitive groups, unhealthy, very unhealthy, and hazardous), according to the United States (US) Environmental Protection Agency (EPA) standard.
Figure 2. The procedure for the air-sensing class project to assess air quality and personal exposure using emerging technologies and web GIS.
Data quality issues and factors that potentially affect data accuracy were also discussed during the lecture. Students learned why low-cost sensors are typically less accurate than the national ambient air-monitoring stations and sometimes overestimate concentrations (Castell et al., Citation2017). In general, sensor performance is influenced by meteorological factors, such as temperature, humidity, wind velocity, and wind direction (Crilley et al., Citation2018; Masson et al., Citation2015). It is important to teach students the trade-off between accuracy and cost and why data gathered by low-cost sensors are currently unsuitable for purposes requiring high accuracy and reliability, such as regulatory compliance (Clements et al., Citation2017). A reasonably accurate sensor was acceptable for the class project because obtaining regulatory-grade data or using the data to inform policymaking was not the primary focus of the project. This background knowledge allowed students to critically evaluate air-pollution data during data collection and mapping, instead of accepting the data unquestioningly. The lecture aimed to build the necessary foundational knowledge for students to carry out fieldwork and post-fieldwork activities.
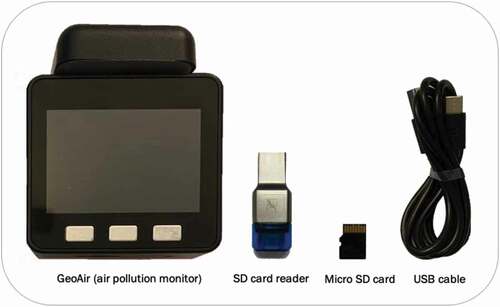
The lecture was followed by a brief demonstration of GeoAir, which was introduced as a low-cost air-pollution monitoring device developed based on the new and emerging technologies described in the lecture. After the demonstration, students were provided with the following supplies for the class project: (1) a GeoAir device for measuring PM concentrations, (2) a USB cable for charging the device, (3) a micro secure digital (SD) card for logging data, and (4) an SD card reader for downloading and transferring data to their personal computer (). In total, 10 air-sensing kits were distributed to 26 students. The students were given the opportunity to familiarize themselves with the kit and test the operation of GeoAir in the classroom before the fieldwork; for example, they practiced turning the device on and off, ensuring that it received the GPS signal and collected data every second, and inserting and ejecting the micro SD card. This pre-fieldwork training was important because it helped students to identify possible problems with the device before the main work was completed (Pánek, J. and M. Glass, Citation2018). Students were encouraged to help their peers during this classroom activity and instruct each other on the proper use of the device to complete the project successfully.
Figure 3. Air-sensing kit distributed to students for the class project: GeoAir device, USB cable, micro SD card, and SD card reader.
Field data collection using a portable air-pollution sensor
The field-based learning approach was adopted to enhance students’ ability to apply core concepts taught in the classroom and facilitate their engagement in real-world learning. The students were allowed to work in teams or individually. They were asked to develop questions and hypotheses about air-pollution hot spots and pollution sources. Although everyone was given the same air-monitoring device, the students were afforded flexibility in determining the monitoring sites and times, which made each student’s project unique. Such freedom given to students can empower them to identify themselves as researchers (Holloway et al., Citation2020). They then collected field data by walking or driving to the selected places at the correct times to test their hypotheses and answer their questions. During data collection, the students were asked to (1) collect air pollution data at more than five different outdoor or indoor locations, (2) take a photograph of the GeoAir display at each location to record measurements at that specific location and time, (3) actively consider potential sources of air pollution and take photographs of anything in the vicinity that could explain the air quality at that location and time, and (4) record potential sources of air pollution or any other findings. Students could note, for example, what was around them (e.g., a bus idling), any activity they performed (e.g., cooking, eating at a barbeque), or the names of places they visited (e.g., a campus dining hall). The photographs and notes were used to create web-based story maps in the later phase of the project.
Students were asked to avoid placing the device inside a bag or pocket, as the PM sensor requires continuous airflow to measure PM concentrations accurately. Since they would share their data and maps with the public, they were also discouraged from collecting data in places where geoprivacy may be a concern (e.g., people’s homes). They were only allowed to collect data in such “sensitive” places if they were particularly interested in people’s exposure to air pollution in these places, but they were informed that any data points collected at these locations would be removed before visualization on a map. Even without a map, the students could share any interesting findings about these places by writing stories and attaching photographs to the web application.
Geospatial visualization of air quality data
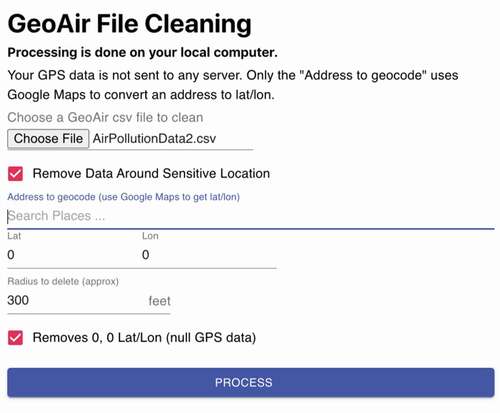
After collecting the field data, students created web maps to visualize air quality along their travel paths. The author provided them with step-by-step instructions for data cleaning and web mapping. Students followed the instructions to transfer the data files stored on the micro SD cards to their personal computers and to securely delete the files from the micro SD cards before they were passed to the next users. They cleaned the data using Microsoft Excel and the GeoAir Data Cleaning Web Program () (see the note to find the URL). The web tool was developed specifically for this class project to keep the data cleaning task as simple as possible so that students could focus only on the intended learning objectives. It removes any records without geographic coordinates due to the absence of a GPS signal, and also deletes data collected at sensitive locations to protect participants’ geoprivacy. Once a student enters the street address of a sensitive location into the web program, the tool automatically converts the street address to latitude and longitude coordinates and removes all records within a user-defined distance from the location. A default radius (300 feet) was used for this project as a simple means of removing GPS noise around locations due to positioning errors. All processes were performed on the students’ local computers, and their GPS data were not sent to any external server.
Figure 4. A data-cleaning web tool developed for the class project.
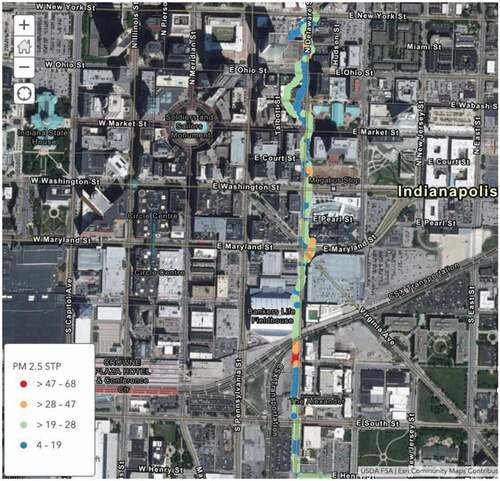
After data cleaning, the students created web maps using ArcGIS Online. They were allowed to choose any symbols, colors, and data classification schemes to best visualize their data. The maps were expected to show variations in air pollution concentrations along the students’ travel paths (). Students could explore the map patterns by overlapping the maps with satellite images and view the concentrations by clicking on points on the maps.
Figure 5. An example of a web map of air pollution concentrations (included in the project instructions).
Story sharing via an interactive web map application
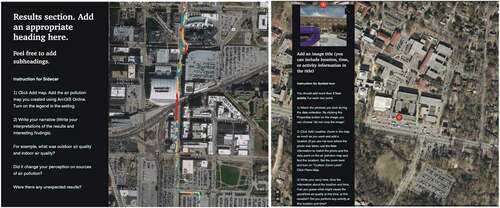
In the final phase of the project, students were asked to create web-based, publicly available, interactive story maps using the ArcGIS StoryMaps application. The author provided them with an example of a story map application as a guide, instructing them on how to create a story map, and clearly describing the project goals and the expectations for their story maps. Students were encouraged to be creative in terms of content, style, and configuration, but there were a few set requirements. The story maps had to include: (1) at least four different sections describing the project background, data collection methods/procedures, results, and conclusions; (2) a “sidecar” block showing the air pollution web map created in the third project phase; and (3) a “guided tour” block including the photographs taken during the data collection at more than three geo-located map tour points (). Students were also allowed to use any other publicly available images downloaded from online sources to create more visually attractive story maps. They were asked to make their stories publicly available to widely disseminate their findings.
Figure 6. Instructions for creating a sidecar block (left) and a guided tour block (right).
Student evaluation
Students were asked to describe their learning experiences and evaluate the technologies, learning methods, and the class project overall by answering open-ended questions. The story map guide that the author provided to students included the following questions to be answered:
In your opinion, what are the benefits and limitations of using GPS-enabled portable air-pollution sensors to understand air pollution and environmental health issues?
What have you learned through this class project in terms of data collection and data visualization?
Did you find this type of learning (field-based learning) useful in understanding the technologies for, and geographies of, environmental health hazards?
How did this project help you understand GPS principles in a variety of indoor and outdoor settings?
How did this project improve your knowledge of local air quality?
Did your findings encourage you to modify your behaviors to reduce air pollution and exposure? If not yet, do you think they might influence your future behaviors, and if so, how?
They included their answers in the conclusion sections of their story maps.
Results
Most students were very enthusiastic about the air-sensing class project and completed all the tasks successfully. Students developed their questions and hypotheses about air-quality hot spots and pollution sources based on their perceptions and previous knowledge; for example, they hypothesized that areas with heavy automobile traffic would have poor air quality due to road vehicle emissions, and that gas stations would have high PM concentrations. Some students were curious about the air quality they are exposed to in their everyday lives and thus collected data along their regular routes to the school campus, grocery store, gas station, parking lot, bank, pharmacy, coffee shop, laundromat, local restaurants, and home. Others undertook indoor experiments to examine the effects of a particular human activity (e.g., cooking) on interior air quality. After the data collection, they created web maps to determine the overall patterns of air quality along their travel routes.
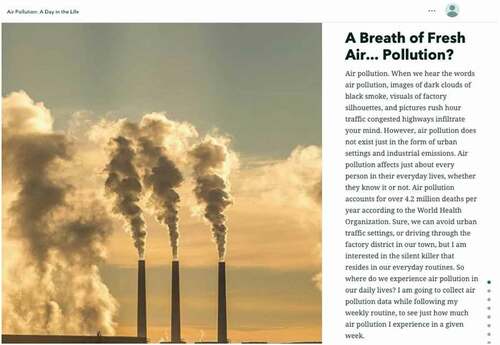
Overall, the students created excellent, interesting story maps. In their introductions, they drew readers’ attention to various sources of air pollution that we are exposed to in our everyday lives but largely unaware of, encouraging readers to consider the quality of the air they breathe (). They explained that the surrounding air seems clean and safe because it is invisible, but this may not always be the case, which they provided as the reason for undertaking the experiment.
Figure 7. The introductory section of a student’s story map.
As part of their story maps, the students also described their research questions/hypotheses and methods, included their previously created air pollution maps, and presented their findings and conclusions (). While constructing the story maps, they reflected critically on what they had discovered during the field experience, trying to make sense of the data and interpret the map patterns in relation to factors that might influence air quality. Although the students formed different questions and collected data at different locations and times, similar major findings emerged. Since the key objective of this paper was not to evaluate the students’ findings, but to examine a new pedagogical strategy and a clearly laid-out class project involving emerging technologies, the following paragraphs focus on several common results and important insights gained from selected student projects as well as the effectiveness and limitations of the described teaching method.
Figure 8. The results section of a student’s story map (using a sidecar block).
During the data collection, students observed multiple pollution hot spots in their communities or the places they frequented. Most students identified automobiles as the major source of air pollution, as many studies suggested (Batterman et al., Citation2015; Isakov et al., Citation2014; Park, Citation2020). One student remained in a parking lot near the intersection of two busy roads for long enough to test her hypothesis about the effect of traffic on air quality and observed that PM2.5 concentrations in the area fluctuated noticeably during her stay. Another noticed that sitting in an idling car at a traffic signal on a busy road can expose the driver and passengers to greater air pollution than when they are in a moving car. She described this finding in her story map as follows:
Areas where I had stopped at a traffic light showed increases in PM2.5 concentrations because of the car exhaust fumes that were able to waft into the vehicle. An area of heavy traffic on W 10th Street was detected to have the worst air quality captured in this project … Once traffic had dissipated in all locations, the concentration of PM2.5 decreased and resulted in better air quality (Student A).
Students also observed pollution hot spots near the fire pits in their apartment courtyards and on construction sites. Some reflected on which of the indoor daily activities they performed might expose them to high levels of air pollution. Using GeoAir, they tested whether cooking elevated PM concentrations at home and observed significantly high concentrations during and after cooking. One student measured air quality before and after frying bacon in a pan and observed a substantial increase in the PM2.5 concentration from 23 μg/m3 to 634 μg/m3. She wrote in her story map that she would be interested in examining in a future study whether different cooking methods generated different concentrations.
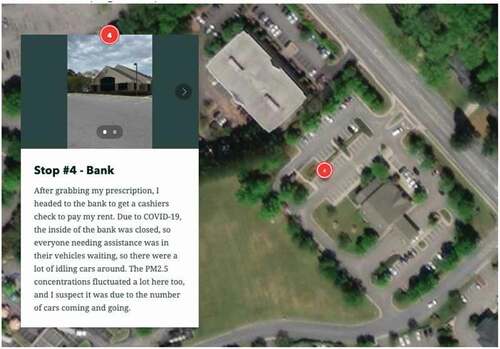
Since this class project was undertaken from late February to mid-March 2020, during which period an increasing number of confirmed COVID-19 cases were reported in the US, one student considered the potential effect of social distancing on personal exposure to air pollution. While collecting data, she observed that people visiting a bank were asked to wait for their turn in their cars as a form of physical distancing. This resulted in many idling vehicles surrounding the bank, which the student concluded might have influenced the high readings and significant spatiotemporal variations in PM concentrations in the area ().
Figure 9. The results section of a student’s story map (using a guided tour block).
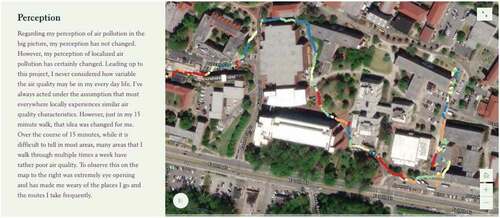
The air-sensing class project enhanced students’ understanding of the spatiotemporal variability of air pollution concentrations. Many students reported that, during the field data collection, they were surprised how the air quality varied from place to place and changed even within a short period of time. Most found that air-pollution readings ranged from healthy to acceptable in the majority of locations, although it was very unhealthy or hazardous to health in a few spots. After the data collection, the students’ perceptions of the spatiotemporal variability of air pollution had changed greatly, as the following comments (obtained from their story maps) indicate:
I never considered how variable the air quality may be in my every day life. I’ve always acted under the assumption that most everywhere locally experiences similar air quality characteristics. However, just in my 15 minute walk, that idea was changed for me. Over the course of 15 minutes, while it is difficult to tell in most areas, many areas that I walk through multiple times a week have rather poor air quality. To observe this on the map to the right was extremely eye opening and has made me weary [wary of] the places I go and the routes I take frequently (Student B).
As I began cooking my dinner, … I was shocked to see in such a small amount of time how drastically the air quality declined as the readings went through the roof at 634 PM 2.5 … It was really concerning seeing that we cook almost all of our meals here in this small space (Student C).
Students also recognized how the portable air monitor could contribute to increasing awareness of air pollution. Looking at their mapped results, they were concerned about the potential effects of air pollution on health. One student wrote that he wished to further explore how to use all these different technologies and applications to assess air quality and make people more aware of their surroundings and the “invisible enemy.” Another student said that the GeoAir device “showcases the ability to empower people to be aware of their surroundings and of the air that they breathe.” The project, therefore, motivated students to actively reflect on what they could do to reduce their air-pollution footprints and minimize their future exposure to unclean air; for example, several students suggested that jogging on sidewalks near major roads or having the car windows rolled down in heavy traffic congestion could increase exposure to air pollution and cause adverse health outcomes. One student noted that it was important “to be well informed and take the proper precautions” to minimize exposure, and suggested opening a window or turning on kitchen ventilation when cooking to protect against indoor air pollution.
The benefits and limitations of GeoAir were also a point of discussion in students’ story maps. As major benefits, the students mentioned the small size, high portability, internal battery, data logging capability, and built-in GPS that enabled the simultaneous collection of air quality, location, and time data, allowing for data mapping and geospatial analysis. However, the accuracy issue of the GPS and air sensor was frequently mentioned as a major limitation. The author was able to have meaningful discussions with students who completed the project before the school closed due to the pandemic, during which they showed their data files and shared their thoughts about what might have influenced the unusually high readings they obtained (e.g., whether a value was true due to nearby sources of pollution at the time of the data collection, erroneous due to technical issues, or overestimated due to high humidity). Despite the limitations, the project allowed students to learn effectively about highly localized air quality, potential sources of air pollution in their daily lives and communities, and factors that may affect the accuracy of GPS and air sensors. Some students evaluated GeoAir as follows:
GPS-enabled portable air pollution sensors are fantastic for measuring and quantifying outdoor air quality at the local and individual levels. The ability to code GPS location to specific air quality concentrations is a huge advantage for those who are both curious and interested in discovering what the air quality of their everyday life is like … On days where [when] relative humidity is high, the GeoAir air sensor overestimates particle number and mass concentrations. Whether this was the case for my data is unknown. However, this is a potential setback with this project regarding collected data and may have an impact on the results found by other users (Student B).
The GeoAir device is not perfect, so the data is not 100% accurate, but the above map showing the results from my data collection does represent the fact that air pollution concentrations vary over space and time, which is important to understand. Low-cost sensor technology … is still rapidly evolving, so hopefully this issue will be fixed in the near future (Student D).
The GPS attachment is not incredibly strong and fails to … record any geographic data while inside some buildings. Despite this drawback, it has the potential to be used in many environmental health or occupational health studies in the future, where participants can carry the monitor on themselves for personal exposure measurements (Student A).
The learning-by-doing approach in this project helped reinforce knowledge and skills that students had gained in the classroom and afforded them hands-on experience that could be important for their future study and careers. The benefits of the field data collection activity were maximized when combined with hands-on opportunities for web mapping and web-based story sharing (Kerski & Baker, Citation2019), since these skills are the same skills needed to conduct research projects. Creating a story map with four sections (i.e., Introduction, Data and Methods, Results, and Conclusions) was similar to writing a term paper or a journal article. However, instead of these more traditional presentation methods, there are distinctive benefits of incorporating web-based story mapping into a class project. First, the web-based presentation allowed students to easily share their maps and findings with classmates, future employers, and the public; students could simply include their story map URLs in their resumes, on social media platforms, or on the course’s web-based learning management system (i.e., Canvas) to showcase their work. Furthermore, using the application to create web maps helped them develop web GIS skills, which are desirable in today’s job market. The following positive comments from students (obtained from their story maps) highlighted these aspects of the pedagogical strategy:
I find it very beneficial to do these kinds of hands-on projects because they reinforce skills that are taught and learned in the classroom. As such, I think these kinds of projects make me more expendable [experienced] in the long run, especially as it regards hands-on experience needed for the job field (Student B).
I really enjoyed doing field based learning because I’m a visual learner, so this project was very helpful (Student D).
Collecting the data alone was interesting, gathering the information from a portable air pollution sensor was surreal. Having the opportunity to get a little experience on things that involve collection of data is important because it can benefit me in my future projects as a GIS student (Student E).
Visualizing data through ArcGIS has given me some ideas of maps that may be added to my own research project and has better equipped me to be a more competitive candidate in future endeavors (Student A).
Limitations and recommendations for future work
The author identified the limitations of the current work and here proposes recommendations for future class projects.
Cost and time constraints: For such a project that involves new technologies and equipment, the major barrier is often a lack of funding to purchase the required devices. Although GeoAir can be built for US$110 or less, which is very reasonable compared to many other supposedly “low-cost” commercially available devices, the cost of this air-sensing class project may not be feasible for a large class. However, the cost of air sensors would become less of a concern because it has continuously decreased as the technologies have evolved. Another issue is that the sensor may be outdated in a few years, requiring instructors to revise existing materials or develop new ones whenever they upgrade the device. This process may be time-consuming and unworkable for some instructors. For these reasons, it is becoming increasingly important to share course materials between instructors in order to introduce effective pedagogy using new technologies.
Data validation: Students critically evaluated data quality based on their knowledge, but did not learn how to validate the data or evaluate the sensor performance in a scientific way (e.g., by developing a calibration model using a reference instrument and comparing the sensor data against the reference measurements by collocating the sensor with on-site reference instruments) because it was not the focus of the project and beyond the scope of the course. However, one of the students commented, “whether this [the overestimation of particle numbers and mass concentrations due to high relative humidity] was the case for my data is unknown”; hence, students were curious about the actual factors that led to high concentrations. In the future, instructors may consider teaching some basic methods for further investigating the effect of local meteorological conditions on air-pollution measurements through a lecture or by facilitating post-fieldwork class discussion to strengthen students’ understanding of the nature of data and to maximize the impact of field-based learning. The class discussion would provide students with an opportunity to share their experiences and critical interpretations of the measurement values with the class and learn about their peers’ opinions and experiences. Finally, hands-on experience of sensor calibration, performance evaluation, and data validation could be embedded in an advanced course that focuses mainly on environmental chemistry, environmental engineering, or exposure assessments. Low-cost sensors should be calibrated in a controlled laboratory before deployment in the field to obtain more reliable data (Sousan et al., Citation2018; Zusman et al., Citation2020), and require constant recalibration and maintenance to ensure data quality (Tsujita et al., Citation2004). However, these processes require unique specialties, a significant amount of time, and expensive equipment, which may not be available to all instructors.
Surveys for student evaluations: In this study, students were asked to reflect on the technologies, learning methods, and the class project overall and include their comments in their story maps. In future work, however, separate, anonymous, comprehensive online surveys could be developed to encourage their reflection on a variety of aspects of class projects. This would provide instructors with a better means of identifying changes in students’ knowledge and understanding of the topics; their general impressions of the air sensor device as a field-based learning tool and of the Story Map web application as a communication/presentation tool; their overall experiences with the technologies and methods; and the challenges they encountered during the learning process.
Group project: Although most students chose to work independently in the present study, a carefully designed group project can make a significant difference to student learning and deepen students’ understanding of both the topic and technologies. A combination of students (from different majors) with different knowledge and skills in a group would promote peer learning and enrich discussion between students by allowing them to learn from the various perspectives and knowledge of their peers (Holloway et al., Citation2020). It would also facilitate critical inquiry among students about data quality, data interpretation, potential causes of good/poor air quality, the benefits and limitations of GPS-enabled air sensors, the health risks associated with exposure, possible action that could be taken at individual and community levels, and so on. Students could be asked to collect data collaboratively and discuss the important points mentioned above in groups during the field data collection. However, to ensure everyone learns data analysis techniques, it would be more beneficial to require students to work independently at the stages of data visualization/analysis and project reporting (story mapping) (Holloway et al., Citation2020), while encouraging them to help their group members during the process.
Conclusions
This article proposes an innovative pedagogical strategy for employing user-friendly, GPS-enabled, portable air-pollution sensors and web GIS technologies as tools for field-based learning in health geography and discusses the effectiveness and challenges of such teaching methods. The case study provided evidence that the proposed teaching strategy improved students’ understanding of local air quality and of the spatiotemporal variation of air-pollution concentrations at various times and locations through real-world experience. The hyper-local air-pollution data generated by a low-cost air sensor provided students with new insights into the spatiotemporal variability of air pollution and indoor air quality that might not have been gained from data collected from national ambient air-monitoring stations, which are sparsely distributed (Ma et al., Citation2020). The field-based air-sensing class project empowered students to better understand the world around them and become aware of the air that they breathe. The increased awareness encouraged them to actively consider what actions they could take to improve air quality and minimize their exposure to air pollution.
The teaching method also offered students hands-on opportunities to develop cutting-edge skills in geospatial data collection, visualization, and analysis within a health geographical context. Students could also develop research skills by engaging in an inquiry-based learning process both inside and outside the classroom: they could develop questions on the topic; collect geospatial data using emerging technologies; visualize their collected data on web maps; critically interpret map patterns to answer their questions; and describe their findings in interactive, web-based story maps. Such practice prepares students for future interdisciplinary studies and workplaces beyond the geography discipline by encouraging a geographical understanding of issues relevant to multiple fields and equipping them with up-to-date knowledge and geospatial skills that are transferable across various fields and industries.
GeoAir, coupled with web mapping technologies, is a highly promising educational tool for health/medical geography and other health-related fields. Students may use the localized air quality data to predict respiratory and cardiovascular disease risks more accurately, examine environmental justice and health disparity issues, or compare air quality before and after major wildfires or public health events (e.g., COVID-19). The class project may be applied to more advanced courses by incorporating advanced methods, such as air pollution modeling, real-time mapping and analysis of IoT data, or machine learning to identify measurement uncertainty. Because this class project does not require commercial desktop GIS software, and all the tasks involved are relatively easy to complete, it can also be easily integrated into K-12 education in which most students have no access to such commercial software.
Its applications can be expanded to include community geography education, public participation GIS (PPGIS), or student-led community-engaged research. The proposed framework for the air-sensing class project can be used as a template “as-is” or modified for application to a specific area of interest. In particular, the user-friendliness of GeoAir opens up new possibilities for community-engaged air monitoring in environmental justice communities because it facilitates the participation of underrepresented people, particularly individuals with low levels of technological literacy, by minimizing the problems of using new technology. PPGIS is an effective method for addressing environmental injustice because it allows people living in “unmonitored” communities to collect data on their own communities’ environmental conditions (e.g., air quality), empowering them to make changes in their communities to improve community health (Maantay, Citation2002). If the proposed teaching method is implemented in the context of environmental justice and health disparities through a community-based PPGIS project, it will offer students a service-learning opportunity to apply their knowledge and newly learned technologies to a real-world situation to meet actual community needs. Schlossberg and Wyss (Citation2007) identified that the integration of new mobile GIS technologies and a community-based PPGIS concept into a course produced positive outcomes, not only for the community, but also for students. In conclusion, the successful integration of low-cost air sensors and web-mapping technologies into medical geography courses, as shown in this study, demonstrates the feasibility of this method for field-based learning and its great potential as an educational tool for health and medical geography.
Note
The Arduino code for the GeoAir software, instructions for making the hardware, and the URL for the GeoAir Data Cleaning Web Program are available under an open source license in the project’s GitHub repository (https://github.com/yoomin-p/GeoAir_v1) The handouts and laboratory instructions for the air-sensing class project are available upon request.
Acknowledgments
The author thanks Kai Zhao for developing the GeoAir device and the web tool for data cleaning. The author also thanks to the students in the Medical Geography course (GEOG 4340/6340) offered in Spring 2020 at East Carolina University for their enthusiasm and creativity, without which this class project would not have been successful. Finally, the author is grateful to the editor and the three anonymous reviewers for their constructive comments that greatly improved the quality of this article.
Disclosure statement
No potential conflict of interest was reported by the author.
Additional information
Funding
References
- Badura, M., Sówka, I., Szymański, P., & Batog, P. (2020). Assessing the usefulness of dense sensor network for PM2.5 monitoring on an academic campus area. Science of the Total Environment, 722, 137867. https://doi.org/https://doi.org/10.1016/j.scitotenv.2020.137867
- Batterman, S., Ganguly, R., & Harbin, P. (2015). High resolution spatial and temporal mapping of traffic-related air pollutants. International Journal of Environmental Research and Public Health, 12(4), 3646–3666. https://doi.org/https://doi.org/10.3390/ijerph120403646
- Bennet, S., Maton, K., & Kervin, L. (2008). The digital natives debate: A critical review of the evidence. British Journal of Educational Technology, 39(5), 775–786. https://doi.org/https://doi.org/10.1111/j.1467-8535.2007.00793.x
- Birenboim, A., Dijst, M., Scheepers, F. E., Poelman, M. P., & Helbich, M. (2019). Wearables and location tracking technologies for mental-state sensing in outdoor environments. The Professional Geographer, 71(3), 449–461. https://doi.org/https://doi.org/10.1080/00330124.2018.1547978
- Carlson, T. (2007). A field-based learning experience for introductory level GIS students. Journal of Geography, 106(5), 193–198. https://doi.org/https://doi.org/10.1080/00221340701697636
- Castell, N., Dauge, F. R., Schneider, P., Vogt, M., Lerner, U., Fishbain, B., Broday, D., & Bartonova, A. (2017). Can commercial low-cost sensor platforms contribute to air quality monitoring and exposure estimates? Environment International, 99, 293–302. https://doi.org/https://doi.org/10.1016/j.envint.2016.12.007
- Clements, A. L., Griswold, W. G., RS, A., Johnston, J. E., Herting, M. M., Thorson, J., Collier-Oxandale, A., & Hannigan, M. (2017). Low-cost air quality monitoring tools: from research to practice (a workshop summary). Sensors, 17(11), 2478. https://doi.org/https://doi.org/10.3390/s17112478
- Cliffe, A. D. (2019). Evaluating the introduction of unmanned aerial vehicles for teaching and learning in geoscience fieldwork education. Journal of Geography in Higher Education, 43(4), 582–598. https://doi.org/https://doi.org/10.1080/03098265.2019.1655718
- Crilley, L. R., Shaw, M., Pound, R., Kramer, L. J., Price, R., Young, S., Lewis, A. C., & Pope, F. D. (2018). Evaluation of a low-cost optical particle counter (alphasense OPC-N2) for ambient air monitoring. Atmospheric Measurement Techniques, 11(2), 709–720. https://doi.org/https://doi.org/10.5194/amt-11-709-2018
- Cromley, E. K. (2019). Using GIS to address epidemiologic research questions. Current Epidemiology Reports, 6(2), 162–173. https://doi.org/https://doi.org/10.1007/s40471-019-00193-6
- Das, D., & Chatterjea, K. (2018). Learning in the field—A conceptual approach to field-based learning in geography. In C. H. Chang, B. Wu, T. Seow, & K. Irvine (Eds.), Learning geography beyond the traditional classroom (pp. 11–33). Springer.
- France, D., Lee, R., Maclachlan, J., & McPhee, S. R. (2020). Should you be using mobile technologies in teaching? applying a pedagogical framework. Journal of Geography in Higher Education, 1–17. https://doi.org/https://doi.org/10.1080/03098265.2020.1773417
- Gao, S., Hilts, R. W., Ross, M. S., & Styler, S. A. (2018). Particulate matters: Student-led air quality research in the third-year environmental chemistry classroom and the field. Analytical and Bioanalytical Chemistry, 410(14), 3223–3229. https://doi.org/https://doi.org/10.1007/s00216-018-0972-3
- Gao, S., & Mai, G. (2016). Mobile GIS and location-based services. In B. Huang (Ed.), Comprehensive geographic information systems (pp. 384–397). Elsevier.
- Gaskins, A. J., and J. E. Hart. (2019). The use of personal and indoor air pollution monitors in reproductive epidemiology studies. Paediatric and Perinatal Epidemiology, 34(5), 513–521. https://doi.org/https://doi.org/10.1111/ppe.12599
- Hohl, A., Delmelle, E. M., Desjardins, M. R., & Lan, Y. (2020). Daily surveillance of COVID-19 using the prospective space-time scan statistic in the United States. Spatial and Spatio-temporal Epidemiology, 34(100354), 100354. https://doi.org/https://doi.org/10.1016/j.sste.2020.100354
- Holloway, P., Kenna, T., Linehan, D., O’Connor, R., Bradley, H., O’Mahony, B., & Pinkham, R. (2020). Active learning using a smartphone app: analysing land use patterns in Cork City, Ireland. Journal of Geography in Higher Education, 45(1), 1–16. https://doi.org/https://doi.org/10.1080/03098265.2020.1802703
- Isakov, V., Arunachalam, S., Batterman, S., Bereznicki, S., Burke, J., Dionisio, K., Garcia, V., Heist, D., Perry, S., Snyder, M., & Vette, A. (2014). Air quality modeling in support of the near-road exposures and effects of urban air pollutants study (NEXUS). International Journal of Environmental Research and Public Health, 11(9), 8777–8793. https://doi.org/https://doi.org/10.3390/ijerph110908777
- Kerski, J. J., & Baker, T. R. (2019). Infusing educational practice with web GIS. In R. De Miguel González, K. Donert, & K. Koutsopoulos (Eds.), Geospatial technologies in geography education (pp. 3–19). Springer.
- Kistemann, T., Dangendorf, F., & Schweikart, J. (2002). New perspectives on the use of Geographical Information Systems (GIS) in environmental health sciences. International Journal of Hygiene and Environmental Health, 205(3), 169–181. https://doi.org/https://doi.org/10.1078/1438-4639-00145
- Levy Zamora, M., Xiong, F, Gentner, D., Kerkez, B., Kohrman-Glaser, J., & Koehler, K. (2019). Field and laboratory evaluations of the low-cost plantower particulate matter sensor. Environmental Science & Technology, 53(2), 838–849. https://doi.org/https://doi.org/10.1021/acs.est.8b05174
- Ma, J., Tao, Y., Kwan, M. -P., & Chai, Y. (2020). Assessing mobility-based real-time air pollution exposure in space and time using smart sensors and GPS trajectories in Beijing. Annals of the American Association of Geographers, 110(2), 434–448. https://doi.org/https://doi.org/10.1080/24694452.2019.1653752
- Maantay, J. (2002). Mapping environmental injustices: pitfalls and potential of geographic information systems in assessing environmental health and equity. Environmental Health Perspectives, 110(2), 161–171. https://doi.org/https://doi.org/10.1289/ehp.02110s2161
- MacQuillan, E. L., Curtis, A. B., Baker, K. M., Paul, R., & Back, Y. O. (2017). Using GIS mapping to target public health interventions: examining birth outcomes across GIS techniques. Journal of Community Health, 42(4), 633–638. https://doi.org/https://doi.org/10.1007/s10900-016-0298-z
- Masson, N., Piedrahita, R., & Hannigan, M. (2015). Approach for quantification of metal oxide type semiconductor gas sensors used for ambient air quality monitoring. Sensors and Actuators. B, Chemical, 208, 339–345. https://doi.org/https://doi.org/10.1016/j.snb.2014.11.032
- Medzini, A., Meishar-Tal, H., & Sneh, Y. (2015). Use of mobile technologies as support tools for geography field trips. International Research in Geographical and Environmental Education, 24(1), 13–23. https://doi.org/https://doi.org/10.1080/10382046.2014.967514
- Pánek, J., and M. Glass. (2018). Gaining a mobile sense of place with collector for ArcGIS. Journal of Geography in Higher Education, 42(4), 603–616. https://doi.org/https://doi.org/10.1080/03098265.2018.1515190
- Park, Y. M. (2020). Assessing personal exposure to traffic-related air pollution using individual travel-activity diary data and an on-road source air dispersion model. Health & Place, 63: 102351. https://doi.org/https://doi.org/10.1016/j.healthplace.2020.102351
- Richard, J. -B., Toubiana, L., Le Mignot, L., Ben Said, M., Mugnier, C., Le Bihan-Benjamin, C., Jaïs, J. P., & Landais, P. (2005). A Web-based GIS for health care decision-support. AMIA Annual Symposium Proceedings, 2005, 365–369.
- Richardson, D. B., Volkow, N. D., Kwan, M. -P., Kaplan, R. M., Goodchild, M. F., & Croyle, R. T. (2013). Spatial turn in health research. Science, 339(6126), 1390–1392. https://doi.org/https://doi.org/10.1126/science.1232257
- Richardson, D. (2017). Five tech trends driving new geospatial development. ArcNews. Accessed July 21, 2020 https://www.esri.com/about/newsroom/arcnews/five-tech-trends-driving-new-geospatial-development/
- Robinson, J. A., Kocman, D., Horvat, M., & Bartonova, A. (2018). End-user feedback on a low-cost portable air quality sensor system—Are we there yet? Sensors, 18(11), 3768. https://doi.org/https://doi.org/10.3390/s18113768
- Schlossberg, M., & Wyss, D. (2007). Teaching by doing: PPGIS and classroom-based service learning. Urisa Journal, 19(1), 13–22.
- Sousan, S., Gray, A., Zuidema, C., Stebounova, L., Thomas, G., Koehler, K., & Peters, T. (2018). Sensor selection to improve estimates of particulate matter concentration from a low-cost network. Sensors, 18(9), 3008. https://doi.org/https://doi.org/10.3390/s18093008
- Spronken-Smith, R., & Kingham, S. (2009). Strengthening teaching and research links: the case of a pollution exposure inquiry project. Journal of Geography in Higher Education, 33(2), 241–253. https://doi.org/https://doi.org/10.1080/03098260802276813
- Thompson, P. (2013). The digital natives as learners: technology use patterns and approaches to learning. Computers & Education, 65, 12–33. https://doi.org/https://doi.org/10.1016/j.compedu.2012.12.022
- Tsujita, W., Ishida, H., & Moriizumi, T. (2004). Dynamic gas sensor network for air pollution monitoring and its auto-calibration. Sensors 2004 IEEE, 1, 56–59. https://doi.org/https://doi.org/10.1109/ICSENS.2004.1426098
- Zusman, M., Schumacher, C. S., Gassett, A. J., Spalt, E. W., Austin, E., Larson, T. V., Carvlin, G., Seto, E., Kaufman, J. D., & Sheppard, L. (2020). Calibration of low-cost particulate matter sensors: model development for a multi-city epidemiological study. Environment International, 134, 105329. https://doi.org/https://doi.org/10.1016/j.envint.2019.105329