
ABSTRACT
Research that tackles the pedagogical use of geolocated social media as an investigative tool for understanding cities in Geography and Urban Studies higher education programs has not been fully exploited. This study contributes by addressing the transferability of these sources as a research medium for enhancing student knowledge of urban phenomena. A collaborative problem-based learning activity was conducted in a third-year compulsory Urban Studies module of the Fundamentals in Architecture Degree at the University of Alicante. Two groups – Spanish (25 students) and English (34 students) language, participated in the activity. Foursquare and Twitter datasets were used as sources of information, and scaffolding in QGIS software, data analysis, and visualization tools were provided. Pre- and post- activity questionnaires as well as the work submitted by students gave an indication of the extent to which the activity was useful for achieving the set objective. Recurring approaches adopted by students and their “how-to” make sense of social media information enabled them to align spatiotemporal and social phenomena to the use and perception of city spaces. Students developed critical thinking and interpretative skills that are key transversal competencies for understanding the huge volume of data available in today’s digitalized world.
Introduction
The use of social media for the study of the city has been extensively covered by the literature (Huang et al., Citation2021; Martin & Schuurman, Citation2020). Scholars from spatial disciplines find these sources useful for their geolocative nature, which provides information about human behaviour in specific geographical contexts (Song et al., Citation2020). These sources of volunteered geographic information – VGI, as coined by Goodchild (Citation2007), p. – offer real potential for informing researchers on the dynamic state of city spaces and how they are used and perceived by individuals (De Lange & De Waal, Citation2019). This is because geolocated social media – GSM – data provide not only textual and visual content, but also temporal information whose combined analysis constructs an interesting up-to-the minute narrative about human practices and their spatial dimension that would otherwise be difficult to obtain (Dunkel, Citation2015; García-Palomares et al., Citation2018).
The readiness and availability of these sources allow both cost and time saving benefits when compared to more intrusive traditional data collection such as field studies and interviews (Pablo Martí et al., Citation2019). However, urban geographers, urban designers, planners, and other professionals interested in understanding the built environment need to receive training to become critical and selective in obtaining and extracting what is relevant so as to more accurately interpret the increasing volume of data sources available from GSM.
There is also an important role for collaborative learning activities in addressing the changing nature of the university lecture as it adapts to the digital age, where vast amounts of knowledge in all fields is readily available to students online, and data sources need to be analysed and interpreted (Caldwell et al., Citation2013). Precisely, collaborative learning in this regard can be seen as a process with great potential as it entails situating learning in a specific context, where learning happens while students engage in activities and, as a result, they become “re-acculturated” into a new knowledge community (Bruffee, Citation1993, p. 3).
In line with the above argument, the objective of this study is to determine how collaborative problem-based learning activities that employ GSM datasets can enrich student understanding of the city, specifically in relation to the spatiotemporal use, perception, and preferences of urban spaces.
For this purpose, a collaborative problem-based learning activity was conducted during a compulsory Urban Studies module of the Fundamentals in Architecture Degree at the University of Alicante. Barcelona was adopted as a case study and geolocated data from the social media platforms Foursquare and Twitter, retrieved from three public holidays (11th September, 1st October and 12 October 2018), were used as the investigative tool to study spatiotemporal dynamics related to the use, preferences and perception of urban spaces.
The remainder of the paper is organized as follows. Section 2 provides an overview of relevant related research; sections 3 and 4, respectively, outline the scope, contribution, and the context of the study; section 5 explains the procedure as well as the scaffolding, materials, and how the activity was evaluated; section 6 includes the most relevant results of the activity; and finally, sections 7 and 8 deal with the discussion and concluding remarks, respectively.
Literature review
The literature review covers the use of Geolocated Social Media – GSM – for analysing city dynamics as well as their use in the Geography and Urban Studies teaching-learning environment, and the significance of problem-based collaborative learning activities as a pedagogical strategy in the context of these disciplines.
Geolocated social media for analysing socio-spatial dynamics
The prolific activity of location-aware social media users and the ever-growing generation of content on these platforms have captured scholars and researcher attention from a wide range of fields engaged in understanding different aspects of today’s society (Snelson, Citation2016). Specially, researchers and professionals in the fields of Geography and Urban Studies, who have traditionally sourced data by manual means and field study through observation, people counting, manual measurements and interviews, have found an opportunity in the automation of the process for collecting large volumes of data from GSM. Thus, new methods for collecting, analysing, and interpreting these sources have emerged and the observation of human activities at scales and resolutions that were previously unimaginable are now possible (Sloan & Quan-Haase, Citation2017).
As these sources have become increasingly geosocial (Croitoru et al., Citation2013), GSM have been proven to be rather useful to study socio-spatial dynamics such as citizen behaviour, preferences, and perceptions associated with a given geographical location. Indeed, Foursquare and Twitter are among the most used GSM sources in research that aim to understand these not so evident aspects of the physical environment (Pablo Martí et al., Citation2019).
Foursquare, a check-in-based GSM platform, has proven to be useful for: identifying signatures of user cultural behaviours (Silva et al., Citation2013); capturing information about tourist activities in a city (Vu et al., Citation2020); reading user preferences over different open public spaces (Pablo Martí et al., Citation2020); and, depicting user sentiment towards the location of accommodation, shopping and restaurants (Aliandu, Citation2015), among others.
Twitter, a short text based GSM platform, has been used for over a decade as a source of collective opinion and it is still in the hotspot for academic research (Noor et al., Citation2020). It includes dynamic user-generated information that is useful for obtaining fine grained perceptual and sentiment-related phenomena as well as the temporal patterns of uses and activities in urban spaces. For instance, mapping spatiotemporal patterns of different kinds of urban activity (Kozlowska & Steinnocher, Citation2020); comparing tweet locations with the existence of local facilities (Lee et al., Citation2013); identifying the socio-spatial relationship between racial protests, counter-protests and demographic variables (Haffner, Citation2019); characterising profile users of urban spaces through tweet languages (Heikinheimo et al., Citation2020); and, acknowledging people’s attitudes, perceptions, and opinions about urban areas (Hess et al., Citation2018).
Foursquare and Twitter have been used together as complementary sources in the research context to identify key spaces and users’ trajectories in the city (Salas-Olmedo et al., Citation2018) and to recognise and analyse socially relevant public spaces (Adelfio et al., Citation2020).
All things considered, the hypothesis set in the learning activity proposed is that these two GSM sources are of interest in the Geography and Urban Studies teaching-learning environment given their usefulness for understanding physical and non-physical city dynamics.
Geolocated social media in the geography and urban studies teaching-learning context
For more than a decade, social media has had an important impact on society as well as in the education research field. Proof of this is the fact that between 2007 and 2013 three high-impact education journals ranked the 5th, 6th, and 14th place in the accumulated number of articles concerned with social media topics (Snelson, Citation2016). Another indication of the increasing interest in these platforms as teaching tools is the finding that during the decade between 2007 and 2017, 80.6% of published education research – out of a corpus of 103 peer-reviewed scientific studies – involved Twitter as a teaching-learning tool in higher education institutions (Malik et al., Citation2019). Even though the use of social media in higher education still presents important challenges that include information overload and distraction, among others (Manca & Ranieri, Citation2016); the usefulness of this technology as perceived by academics has promoted both a pedagogical and attitudinal change in favour of these tools (France et al., Citation2020; Vandeyar, Citation2020).
The benefits of using social media in teaching and learning have been widely covered by previous research (Abdul Kadir, Citation2020). For instance, Twitter has been shown to have a positive impact on class dynamics, social skills, social interaction, motivation, and informal learning (Dhir et al., Citation2013). One of the advantages is that the current generation of students are digital natives and therefore, are totally at ease with using social media as part of their daily activities. Moreover, “lecturers compete for students’ attention with Facebook, Instagram, Snapchat, WhatsApp, Twitter, and other online platforms”, and so enticing them into using the same digital-based tools for academic discussion represents a pedagogical opportunity (Au-Yong-Oliveira et al., Citation2018).
Using the internet and social media in undergraduate courses that aim to explore human geographical issues helps students understand how spaces influence their own cultural and social worlds and how these intersect with the physical environment (Halliwell, Citation2020). Social media in the Geography and Urban Studies teaching context has been broadly used as a facilitator of asynchronous communication between students and professors and as information sources for locations and places. For instance, Twitter has been used as a participative tool for students to share subject-related content with students and among students; extend in-class debates; among many other settings (Dhir et al., Citation2013). Flickr, Panoramio and Instagram have been used as a collaborative visual method to promote (geo) photographic thinking as well as to enhance engagement and teaching during a Geography field course (Davies et al., Citation2019; Welsh et al., Citation2012). Facebook, Instagram and Twitter posts associated to specific hashtags in a given timeframe were helpful to find out the overall feeling of residents towards neighbourhoods in Frankfurt (Venek et al., Citation2016).
These experiences have highlighted the opportunity to use GSM to facilitate participation and interaction with and among students; to encourage critical thinking; and, in general, as a source of information to gauge social and cultural nuances about physical locations. However, to the authors’ knowledge, there is lack of research regarding the potential of GSM research-based databases for knowledge building about multidimensional – physical and perceptual – aspects of the use of city spaces.
Problem-based collaborative learning in the context of geography and urban studies higher education
Collaborative learning, often adopted in problem-based instruction (Smith & MacGregor, Citation1992, p. 11), is a term that describes several educational approaches involving joint intellectual effort by students, or students and teachers together in the pursuit of understanding solutions or meanings.
In open-ended collaborative problem-solving activities, students learn to build knowledge with each other and to solve real-world problems (Davidson & Major, Citation2014, p. 46). Several studies have reported the benefits of including problem-based learning (PBL) in Geography and Urban Studies and Planning education as it encourages more active and effective learning processes (Bradbeer, Citation1996; Drennon, Citation2005; Shepherd & Cosgriff, Citation1998). The nature of these fields is already interdisciplinary, “one of the main ingredients of PBL” (Spronken-Smith, Citation2005, p. 206) – . Indeed, in Geography, Urban Studies and Urban Planning programmes the student-centered approach of PBL is familiar ground since learning activities often involve real world-problems, usually set by the instructor, which defines what is to be learned (Pawson et al., Citation2006, p. 104). These activities are commonly carried out in small groups through both fieldwork and laboratory teaching (Shepherd & Cosgriff, Citation1998).
The best practices in PBL, as compiled by Pawson et al. (Citation2006, p. 113) are: preparation, scenario design, implementation, and assessment. Shepherd and Cosgriff (Citation1998, p. 352) have outlined the phases of the PBL implementation in a Planning course. These are: (i) the instructor introduces a real-world problem presentation to the class; (2) the students must decide on how best to analyse the situation using their own knowledge and expertise, involving “learning what needs to be learned”. They pose questions or “learning issues”, inquiring about aspects that are not fully understood, and the instructor engages in activities such as coaching, modelling, exploration and reflection on what there is to be learned; (3) the problem solution phase is where students generate hypotheses, synthesize problem information, depict new challenges and learning issues and formulate action plans to complete the task; and lastly, (4) the evaluation phase, which can takes place in different forms, one of them being that the students create a professional-quality product from the PBL exercise, documenting the “lessons learned” from the process.
The students’ role is, therefore, that of an “active problem solver”, whereas the instructor presents a real-world problem, defines the scope of the end product and provides cognitive guidance, motivation and scaffolding,Footnote1 which are the materials provided for the activity as well as coaching and feedback (Shepherd & Cosgriff, Citation1998, p. 356).
Scope and contribution
This study contributes to the existing literature by investigating the extent to which students of Urban Studies can grasp qualitative information about public spaces in a supervised collaborative problem-based learning activity that uses Geolocated Social Media (GSM) datasets. Specifically, this study poses the following research question:
How do GSM datasets enrich student understanding of spatiotemporal patterns related to the use, preferences, and perception of urban spaces?
Foursquare and Twitter are selected as main sources of information since previous research demonstrates their complementary nature and value for the analysis of physical and non-physical urban phenomena.
Context of the study
The participating students were enrolled in Urban Studies 2 – US2 – for the 2018–2019 academic year. US2 is a 15-week long compulsory subject taught in the first semester of the third year of the Fundamentals in Architecture Degree at the University of Alicante. It is the second of six compulsory modules that comprise the overall Urban Studies core program. The module offers different groups, two taught in Spanish and one in English. The Spanish groups predominantly comprise local students, who already have some basic knowledge about the city’s components and functions as they attended Urban Studies 1 in the previous academic year. The English group is mostly comprised of Erasmus students, who usually have very different foundations in Urban Studies as they come from other universities and are often enrolled in programmes that are different to that of Architecture, Urban Design or Geography, e.g. interior design, sociology, civil engineering.
The US2 teaching content provides students with skills necessary for the study and design of the urban public space and focuses on four key aspects: physical configuration; use, preferences; and perception. Students are encouraged to use traditional and contemporary methods and techniques. The former includes fieldwork, interviews, field observation, and the latter adopts technologically based sources such as GSM platforms and other web services.
The collaborative activity adopted for this study took place mid semester, after students were given the necessary theoretical and analytical tools to accomplish the tasks, and therefore, they could apply what they had learned about the study of the city. Three specific learning outcomes aligned to the competence-based curricula of the US2 subject have been incorporated into the collaborative learning activity covered by this study: (i) capacity to learn and apply new concepts and methods in an autonomous and interdisciplinary manner; (ii) develop skills to understand the importance of information management in the contemporary world and how to apply the dynamics of information technologies; and (iii) ability to work in groups, distributing tasks and assuming roles.
Method
Procedure, scaffolding and materials
Students were told at the beginning of the session that a collaborative research activity about the study of urban public spaces through GSM would take place. They were also informed that the activity was voluntary and that regardless of whether they declined to participate or if their groupwork resulting from the activity was poor would their final grade have been negatively impacted. For those wishing to participate, a bonus of 0.5 points would be granted regardless the quality of their output.Footnote2 All students present on the day of the activity agreed to participate.
The procedure entailed the following steps:
Individual participation codes were distributed, and students were asked to form groups of six.
A pre-activity survey was conducted to establish the demographics of the group, their familiarity with the case study city and their expectations of the activity.
A student handout () was distributed, which explained the activity, objectives, and work to be submitted. Students were told that the activity centred on the city of Barcelona, but they were not told that the dates chosen for analysis were national and regional holidays.
Figure 1. Summary of the activity handout.
Students were provided with a web-link to download all the materials needed for the activity.
Two researchers were available to handle QGIS technical issues. Another researcher was also present to handle other queries, observe the procedure and take notes.
The lecturers provided scaffolding to students of both groups at the following timeframes:
A few weeks prior to the activity, an introduction to the QGIS software program was provided. In total, 2 practical sessions of 4 hours were given by an expert.
A week before the activity, a four-hour practical session provided students with an introduction to practical considerations for:
- Opening, filtering, and analysing Foursquare and Twitter datasets in Excel and CSV format files; and,
- Using free tools for analysing data and creating and/or editing diagrams such as word clouds.
As for the materials provided, they included
Three Twitter datasets in the form of Excel spreadsheets with geolocated tweets generated in Barcelona during three key public holidays in 2018: 11th September- regional festivity, 1st October- local festivity, and 12th October- state festivity. Twitter datasets included metadata such as the date and time when tweets were shared, the tweet text and hashtags, and the language of the tweets.
A Foursquare dataset in the form of an Excel spreadsheet retrieved on the 10 October 2018. The dataset included geolocated Barcelona’s Foursquare registered venues, specifically those corresponding to the Outdoors and Recreation category. The venues under this category correspond to the city’s urban public spaces (Foursquare Inc, Citation2021).
A QGIS file with the abovementioned four georeferenced datasets imported. These datasets were broken down into the following three layers: tweets by timeframe; heatmaps that visualize the concentration of tweets; and Foursquare Outdoors and Recreation venues represented by the number of visitors.
Providing this QGIS file, with the imported pre-processed and cleaned datasets ensured that all students, including those less experienced with the program, would have the same amount of time to focus on the analysis and interpretation of the information.
The datasets were retrieved through the Foursquare and Twitter API – Application Programming Interface – by means of a desktop program SMUA- Social Media Urban Analyser, that was developed specifically for research purposes by the University of Alicante.
Evaluation of the learning activity
The session took place in a supervised environment as recommended by authors such as Halliwell (Citation2020) to ensure responsible student access to social media data and the exploration of digital portals while investigating social issues.
At the end of the session, each group uploaded their diagrams and results in a Power Point format presentation and were asked to fill in a follow-up questionnaire asking for their feedback on the activity. Lastly, students were asked to create a video file explaining the results and submitting it within seven days.
The researchers met over several sessions to analyse the findings from the pre and post activity questionnaire as well as the uploaded student presentations. All data and materials were evaluated according to three main considerations: (i) participant demographics, career aspirations and awareness of issues relating to Barcelona were gathered from the pre-activity questionnaire; (ii) student perceptions of the in-class activity according to the follow-up questionnaire; (iii) the extent to which the results of the activity were able to meet the objectives and address the research question.
All videos submitted by students were first analysed individually by the researchers and the identified categories that represented the recurring approaches to analysing the data were agreed a-posteriori in subsequent meetings.
Results
The results are organised into four sections: (i) the participant profiles; (ii) the researcher observations of the collaborative activity; (iii) the analysis of the work submitted by students; and (iv) the findings of the pre- and post-activity questionnaires are presented.
Participant profiles
Basic demographic and career aspiration details () were obtained from the pre-activity questionnaire, as well as an indication of how familiar participants were with Barcelona and the controversial issue of Catalan independence from Spain.
Table 1. Demographic breakdown by group derived by pre-activity questionnaire.
Most participants were aged under 25 years in both groups, and had not previously participated in a research activity of this nature. Most participants have career aspirations to become architects ().
Figure 2. Career aspirations of participating students.
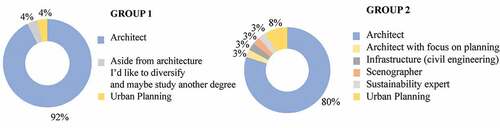
As for previous knowledge of the city selected for study, only one student from Group 2 has previously lived in Barcelona (See pre-activity responses to question Q2 in - Section 6.2). Both groups showed limited awareness of Catalonia’s goal for political independence as being the reason for which the city had been receiving considerable press coverage, with Group 1 showing greater awareness – 48% – than Group 2–34% – . Furthermore, awareness of key public spaces in Barcelona was significantly less for students in Group 2–34% – than for those in Group 1–59% – . Of the students that had some awareness of Barcelona, the key landmarks named prior to the activity were La Rambla, Plaza Cataluña, Paseo de Gracia and Plaza de España.
Researcher observations and analysis of the students work
The post-activity researcher meetings focused on discussing the notes made by the researcher who observed how the activity evolved as well as further points or clarifications provided by the other two researchers that were interacting with the students to resolve questions as they arose.
All teams in both groups were able to use the information provided, namely Foursquare and Twitter datasets as well as the QGIS files to carry out the activity. Initially, the students were overwhelmed by the amount of information provided as they were constantly raising their hands asking to clarify QGIS technical issues or for the lecturer to provide some clues on how to approach the activity. However, after this initial burst of collaboration between lecturer and student, and among students, all teams were interacting to identify their own research strategy.
Three recurring research strategies emerged from both the notes and observations made by the researchers and the analysis of the students work.Footnote3 These are: (i) the significance of the dates analysed; (ii) the demographics, urban activities, and presence of people in specific public spaces; and (iii) the key topics shared in specific spatial and temporal contexts.
Significance of the dates analysed
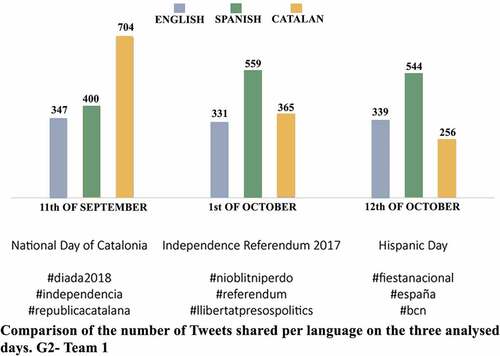
All teams discovered what was celebrated on the three dates. However, Group 1, with predominantly Spanish students, was able to infer this information more quickly than the Erasmus students from Group 2. Four approaches adopted by the students to infer this information can be highlighted. First, the analysis of each main twitter hashtag in relation to their distribution across all three dates for comparative purposes ().
Figure 3. Student diagrams comparing the three dates in terms of the number of tweets generated.
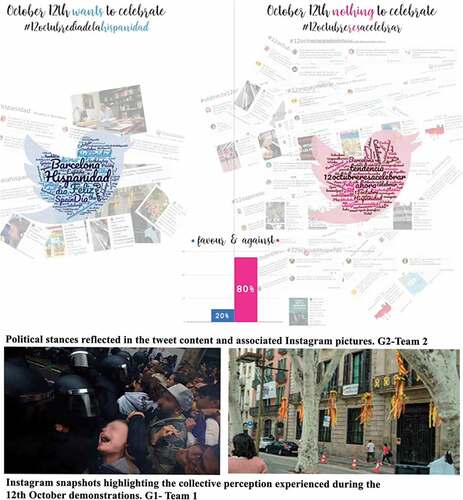
Second, the frequency of phrases, words and tweet hashtags were analysed for each day using word clouds for presenting the results. Third, the classification of tweets, hashtags, and related Instagram pictures according to what students interpreted to be the public sentiment or opinion; for example, in terms of the opposing stances of demonstrators pro-Hispanidad or pro-Catalunya independence (Upper- ). Fourth, the selection of pictures and tweet content that represented the collective perception of the urban realm during the selected dates. For instance, the street façades in Barcelona decorated with the Catalan flag and the confrontation between the Riot Police and the demonstrators (Lower- ).
Figure 4. Visualization of political stances and the collective perception as interpreted from Twitter and Instagram posts.
The demographics, human activities, and presence of people in specific public spaces
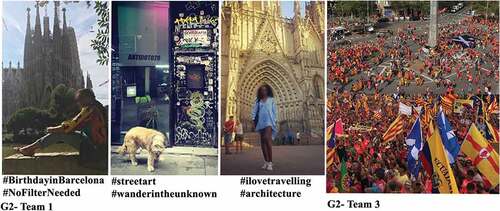
By analysing tweet languages students were able to differentiate user demographics (see ). These findings were often linked to spatial concentration patterns which were indicative of specific profiles of people presence in certain public places. Moreover, by searching and analysing the tweet posts and their associated Instagram pictures, several students noticed the different types of urban activities that took place at the specific locations during those days. There were key landmarks of the city to which political hashtags were associated, whereas other public spaces mostly allocated tourist activities ().
Figure 5. Students selected pictures showing activities that took place at different locations on specific dates (Left, 12th October; right, 11th September).
Key topics shared in specific spatiotemporal contexts
Some students decided to investigate spatial patterns in which keywords had been shared by examining and identifying clusters of tweets and hashtags in the city, thereby recognising the social relevance of certain public spaces. Another approach was to look at the most popular public places which were identified by the number of Foursquare check-ins and then analyse the content of tweets shared at these locations. These two recurrent lines of action have helped students focus their research on specific urban spaces rather than on the entire city.
More complex analyses were conducted by several teams when cross-checking the data from Twitter against Foursquare. For instance, some students identified concentrations of tweets by visualizing them on a map at different timeslots, detecting key urban landmarks, which were then contrasted to the ranking of Foursquare venues by number of check-ins. Once these spaces had been identified for each date analysed, some groups created diagrams showing temporal patterns of Tweets, relating this information to the most relevant hashtags. This approach enabled them to pinpoint the most significant timeframes of people presence at specific urban spaces ().
Figure 6. Student diagrams showing the analysis of spatial and temporal patterns of tweets in relation to different urban public spaces.
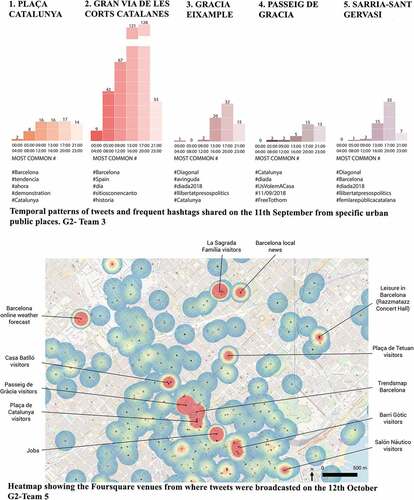
Figure 7. Summary of students’ responses from the pre- and post- questionnaires.
Pre- and post-activity questionnaire findings
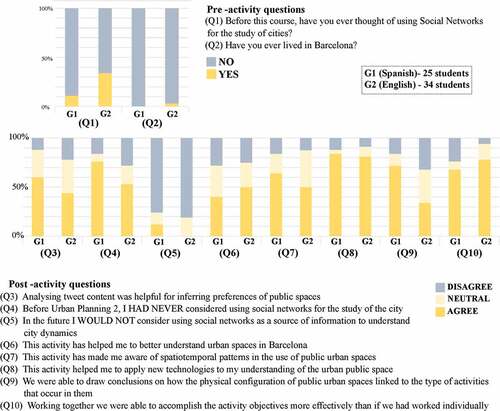
The student responses from both pre- and post-activity questionnaires are summarized in . The nature of the questions from the questionnaires can be grouped into three types as follows.
The first group of questions (Q1 and Q5) refers to whether the students have used and find Geolocated Social Media (GSM) data useful for studying cities. Most students did not consider using GSM to study cities before the activity (Q1). However, after the activity most participants in both groups agreed that they would be using social networks in the future as a source to study city dynamics – 76% and 81% were positive, whereas 12% and 0% were negative for G1 (Spanish) and G2 (English), respectively (Q5) – .
The second group of questions (Q3, Q6, Q7 and Q9) asked students if they considered that GSM data used for the activity were useful for analysing specific urban phenomena. Two different instances can be highlighted. First, more G1 students than those in G2 were positive about how the data allowed them to infer people preferences (Q3) and were able to draw conclusions on the physical configuration of public spaces (Q9). Second, 63% and 50% of G1 and G2 participants, respectively, found the activity and sources useful for understanding spatiotemporal patterns in general (Q7); however, only 40% and 50% agreed that GSM allowed them to “better understand urban spaces in Barcelona” (Q6). Arguably, they came to realise that GSM would offer clues, but they do not reveal the entire complexity of the urban environment, so they understood the sources’ limitations.
A third group of questions relates to the extent that the collaborative activity contributed to the subject’s learning outcomes as outlined in Section 4 Context of the study. Indeed, 80% of the students in both groups agreed that the activity helped them apply new technologies to the understanding of the urban public spaces, thereby learning new concepts and methods and developing information technology skills; and most students – 68% and 78% for G1 and G2, respectively – agreed that working in groups had allowed them to accomplish the objectives set for the activities more effectively than if they had worked individually (Q10).
Discussion
In the Geography and Urban Studies teaching-learning contexts there have been very positive experiences associated with the use of GSM (Davies et al., Citation2019). This study contributes to the field by setting up a collaborative problem-based learning activity that works on developing skills that help students study the city by analysing GSM research-based datasets. Specifically, concurring with previous research that suggested that problem-based learning can bridge the gap between learning and practice in planning education (Shepherd & Cosgriff, Citation1998), this study demonstrated the transferability of GSM as used in a research-based scenario to the Urban Studies teaching-learning context. With this, the potential linkages between research and teaching to benefit student learning have been evidenced (Healey, Citation2005).
Although the vehicular language and knowledge bases were different for both groups – Spanish for Group 1, predominantly comprised of Spanish nationals; and English for the Erasmus Group 2, a more international cohort from various universities across Europe – these differences did not affect the essential nature of each group’s findings. This is likely to be due to two methodological considerations: firstly, the same scaffolding and tools were provided to analyse and visualize the results; and, secondly, the eight-hour QGIS practical sessions provided before the session. It must be highlighted that during these sessions a problem-based learning approach was followed similar to that proposed by Drennon (Citation2005). Although these sessions did not guarantee an equivalent level of QGIS abilities, the provision of a QGIS file with linked and georeferenced datasets did give everyone the opportunity to focus on the analysis rather than spending time in preparing the datasets.
Despite the fact that before the activity Group 1 displayed greater knowledge of urban public spaces in Barcelona than Group 2, this did not produce significant differences in terms of how the activity was carried out and, more importantly, the final output between both groups. Essentially, the activity succeeded in creating a level playing field where students could draw inferences from the datasets provided. This is an important consideration that reinforces the transferability argument of GSM to the pedagogical context because students who may not be as familiar with the urban spaces being studied, are still able to extract meaningful results by using these data sources.
It is worth noting that the current generation of students, especially those in courses related to design and creativity – such as Urban Studies –, are visual learners (Abdul Kadir, Citation2020). Therefore, for this activity, students were receptive to using QGIS maps, as well as online diagram-building pages and word cloud programs to visually represent their analysis as would be done in a research scenario (Dunkel, Citation2015). Moreover, aside from the datasets, they were looking online for more visual and textual clues; for instance, searching for the original tweet posts and finding the specific images associated to the text ( and 5), or investigating more about the venues via other social network platforms such as Instagram (). Therefore, it can be suggested that students are becoming more reliant on digital communication as they are aware of several social media platforms and their potential as sources of information. Thus, digital methods are permeating their research activities and projects (Halliwell, Citation2020).
Another consideration is that these sources could be complementary to field studies that would normally require more time to carry out and are less cost effective. Specifically, in extreme situations like during the COVID-19 pandemic, where field studies and personal interviews are not recommended, sources such as GSM represent a great opportunity for gathering insights about collective preferences and the use of urban public spaces. Nevertheless, despite the widespread use of GSM among digital natives for personal reasons, what became clear from the researcher observations of the activity was that, from the outset, students needed to reflect on how to analyse the information offered by these sources in problem-based contexts. The initial flurry of activity represented the students working through the GSM datasets collectively, clarifying doubts, and reflecting on the best method to interpret the data in a way that would add meaning to their understanding of what was going on in Barcelona on the dates chosen for study.
Students were crosschecking spaces with data from different GSM platforms and realised that their interpretations can be enhanced by using a variety of sources, as previous research have similarly concluded (Adelfio et al., Citation2020). Moreover, critical thinking was evidenced when the case was made for approaching the datasets first by identifying successful spaces in Foursquare and then analysing them in detail through Twitter hashtags across all three days for comparative purposes (), rather than adhering to the instructions in the handout ().
Another significant finding is that the activity elicited three recurring research strategies for the analysis of GSM data that are well acknowledged by the research community. For example, what tweets reveal about the demographic profile and spatiotemporal presence of people (Sloan et al., Citation2015), or how collective sentiments and public opinion can be depicted from semantic analysis of the most frequent tweet topics (Kovács-Győri et al., Citation2018).
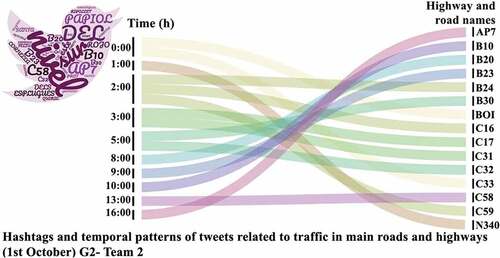
Furthermore, the students were critically thinking about the opportunities and limitations of the sources that were being used. Indeed, some of them noticed that there were tweets generated by user accounts that do not represent individuals sharing a message. This characteristic of Twitter data is often considered a limitation by researchers who, from the outset, discard tweets generated from these accounts for further analysis (Kozlowska & Steinnocher, Citation2020). Instead, one team analysed tweet texts from these accounts and identified spatiotemporal patterns that illustrated traffic jams, some of these caused by the festivities and protests associated with the public holidays analysed ().
Figure 8. Students’ diagram showing the temporal patterns of traffic jams identified through tweets generated from automatic accounts.
Challenges for future implementation of the activity
The use of GSM sources in teaching and learning contexts presents limitations and ethical considerations worth considering.
The bulk retrieval of social media data could be a challenging technical task for lecturers that are not familiar with technical methods used for this purpose. However, research has shown that small-sized datasets through manual retrieval is also a good option for future activities in line with the one proposed in this research (P. P. Martí et al., Citation2017).
In terms of the GSM selected for the purpose of this study, an important acknowledged limitation of Twitter datasets is that many users do not wish to share their location, therefore, the geolocated data available may not be representative of the entire population or it may be scarce (Hess et al., Citation2018). The same limitation could occur when using manual means for collecting data (López Baeza et al., Citation2016). For this reason, adopting different complementary data sources such as different kinds of GSM could compensate for the lack of information and allow students to approach the activity from different perspectives. Indeed, superimposing different data sources to thicken data samples is often a strategy adopted by researchers in the field (Latzko-Toth et al., Citation2017).
The scaffolding provided for the activity ensured that all students had the basic skills necessary to carry out the collaborative activity. However, pre-processed datasets had to be offered to make sure that the activity could take place within a single 4-hour supervised session. Future problem-based activities could be planned so that the cleaning of raw datasets would be developed by the students themselves to practice these necessary research skills. Moreover, future experiences must include scaffolding that raises awareness of the ethical implications of using private “digital spaces” of social media users for research purposes (Holton & Harmer, Citation2019). For instance, students should know that social media users are not aware that their volunteered generated data will be used for analysis. However, results presented in abstract and aggregated form are a means by which to preserve social media user privacy (Sloan et al., Citation2015).
Although most teams in both groups were able to identify complex non-physical socio-spatial dynamics, there was no reference made to the physical configuration of these urban spaces in their videos – spatial dimensions and façade details of plazas, for example, – . This was confirmed by the overall post-activity questionnaire where students expressed that they were looking forward to finding more information about the physical aspects of public spaces through GSM data. Clearly, future experiences could benefit from complementing GSM information with more traditional approaches, including field study measurements and observations and/or other virtual fieldwork tools – such as Google Earth – (Haast & Brien, Citation2021) that enable more precise measurements and insights on the physical aspects of city spaces to be obtained.
Conclusions
The aim of this research was to determine how a collaborative problem-based learning activity using GSM can enrich Urban Design students’ understanding of urban spaces. The main findings indicate that students were able to develop their own methods and approaches for gathering insights on urban dynamics that are similar to those currently used by researchers in the field. These approaches emerged via student interaction, enabling them to reach highly relevant conclusions. The results obtained in the four-hour long activity evidenced an understanding of the city that mostly covered nonphysical and social aspects – collective perception and citizen preferences in very specific geographic and temporal locations – . These complex phenomena are often very challenging to study through more traditional methods such as interviews and field observations.
All in all, the collaborative activity provided an opportunity for students to develop two transversal competences that are crucial for preparing professionals to operate effectively in the digitalized 21st century: information management skills and critical thinking skills to analyse and interpret the huge volume of readily available user-generated data from GSM.
Acknowledgments
The authors would like to thank all participating students and MSc (Arch) Álvaro Bernabeu Bautista for his valuable technical input.
Disclosure statement
No potential conflict of interest was reported by the author(s).
Additional information
Funding
Notes
1. The concept of scaffolding, originally coined by Bruner (1978), refers to the support provided by the teacher to help learners focus on the task. Nowadays, the term has evolved to include “tools, strategies, or guides that support students in gaining higher orders of understanding” (Devolder et al., 2012, p. 559).
2. Ethical approval was obtained from the University of Alicante with the understanding that the nature of the study involved presenting the findings of an educational intervention. The following conditions were met: 1) the research has an educational value and is related to the course objectives outlined in the syllabus, and 2) the participation in the research was voluntary. Students choosing not to participate were not negatively impacted and could still obtain the maximum grade possible in the module by submitting the scheduled and obligatory course assignments.
3. Exemplary student submitted videos (G2- English group. Teams 2, 3 and 5) can be downloaded from the following link: https://cutt.ly/RRSSactivity
References
- Abdul Kadir, S. (2020). The use of social media in millennials’ teaching and learning activities in design-related course. Environment-Behaviour Proceedings Journal, 5(13), 133–141. https://doi.org/10.21834/e-bpj.v5i13.2087
- Adelfio, M., Serrano-Estrada, L., Martí-Ciriquián, P., Kain, J.-H., & Stenberg, J. (2020). Social activity in Gothenburg’s intermediate city: Mapping third places through social media data. Applied Spatial Analysis and Policy, 13, 985–1017. https://doi.org/10.1007/s12061-020-09338-3
- Aliandu, P. (2015). Sentiment analysis to determine accommodation, shopping and culinary location on Foursquare in Kupang City. Procedia Computer Science, 72, 300–305. https://www.sciencedirect.com/science/article/pii/S1877050915036054
- Au-Yong-Oliveira, M., Gonçalves, R., Martins, J., & Branco, F. (2018). The social impact of technology on millennials and consequences for higher education and leadership. Telematics and Informatics, 35(4), 954–963. https://doi.org/10.1016/j.tele.2017.10.007
- Bradbeer, J. (1996). Problem-based learning and fieldwork: A better method of preparation? Journal of Geography in Higher Education, 20(1), 11–18. https://doi.org/10.1080/03098269608709340
- Bruffee, K. A. (1993). Collaborative learning: Higher education, interdependence, and the authority of knowledge. Johns Hopkins University Press.
- Bruner, J. S. (1978). The role of dialogue in language acquisition. In A. Sinclair, R. Jarvella, & W. J. M. Levelt (Eds.), The child’s conception of language. Springer-Verlag.
- Caldwell, G. A., Foth, M., & Guaralda, M. (2013). An urban informatics approach to smart city learning in architecture and urban design education. Interaction Design and Architecture(S), 17, 7–28. http://www.mifav.uniroma2.it/inevent/events/idea2010/index.php?a=10&link=ToC_17_P&link=17_1_abstract&s=10
- Croitoru, A., Crooks, A., Radzikowski, J., & Stefanidis, A. (2013). Geosocial gauge: A system prototype for knowledge discovery from social media. International Journal of Geographical Information Science, 27(12), 2483–2508. https://doi.org/10.1080/13658816.2013.825724
- Davidson, N., & Major, C. H. (2014). Boundary cross-ings: Cooperative learning, collaborative learning, and problem-based learning. Journal on Excellence in College Teaching, 25(4), 7–55. http://celt.muohio.edu/ject/fetch.php?id=592
- Davies, T., Lorne, C., & Sealey-Huggins, L. (2019). Instagram photography and the geography field course: Snapshots from Berlin. Journal of Geography in Higher Education, 43(3), 362–383. https://doi.org/10.1080/03098265.2019.1608428
- De Lange, M., & De Waal, M. (2019). The hackable City. Digital media and collaborative city-making in the new society (Vol. 87, Issue 1). Springer. https://doi.org/10.1007/978-981-13-2694-3
- Devolder, A., van Braak, J., & Tondeur, J. (2012). Supporting self-regulated learning in computer-based learning environments: Systematic review of effects of scaffolding in the domain of science education. Journal of Computer Assisted Learning, 28(6), 557–573. https://doi.org/10.1111/j.1365-2729.2011.00476.x
- Dhir, A., Buragga, K., & Boreqqah, A. A. (2013). Tweeters on campus: Twitter a learning tool in classroom? Journal of Universal Computer Science, 19(5), 672–691. https://doi.org/10.3217/jucs-019-05-0672
- Drennon, C. (2005). Teaching geographic information systems in a problem-based learning environment. Journal of Geography in Higher Education, 29(3), 385–402. https://doi.org/10.1080/03098260500290934
- Dunkel, A. (2015, October). Visualizing the perceived environment using crowdsourced photo geodata. Landscape and Urban Planning, 142, 173–186. https://doi.org/10.1016/j.landurbplan.2015.02.022
- Foursquare Inc. (2021). Foursquare Venue Categories. https://developer.foursquare.com/docs/resources/categories
- France, D., Lee, R., Maclachlan, J., & McPhee, S. R. (2020). Should you be using mobile technologies in teaching? Applying a pedagogical framework. Journal of Geography in Higher Education, 45(2), 221–237. https://doi.org/10.1080/03098265.2020.1773417
- García-Palomares, J. C., Salas-Olmedo, M. H., Moya-Gómez, B., Condeço-Melhorado, A., & Gutiérrez, J. (2018). City dynamics through Twitter: Relationships between land use and spatiotemporal demographics. Cities, 72(February), 310–319. https://doi.org/10.1016/j.cities.2017.09.007
- Goodchild, M. F. (2007). Citizens as sensors: Web 2.0 and the volunteering of geographic information. GeoFocus, 7(420893), 8–10. https://doi.org/10.1007/s10708-008-9190-4
- Haast, B., & Brien, P. O. (2021). Digital Investigations: Using virtual fieldwork in the classroom. In D. Kenley (Ed.), Teaching about asia in a time of pandemic (pp. 151–160). Asia Shorts.
- Haffner, M. (2019). A place-based analysis of #BlackLivesMatter and counter-protest content on Twitter. GeoJournal, 84(5), 1257–1280. https://doi.org/10.1007/s10708-018-9919-7
- Halliwell, J. (2020). Applying social media research methods in geography teaching: Benefits and emerging challenges? Journal of Geography, 119(3), 108–113. https://doi.org/10.1080/00221341.2020.1755717
- Healey, M. (2005). Linking research and teaching to benefit student learning. Journal of Geography in Higher Education, 29(2), 183–201. https://doi.org/10.1080/03098260500130387
- Heikinheimo, V., Tenkanen, H., Bergroth, C., Järv, O., Hiippala, T., & Toivonen, T. (2020). Understanding the use of urban green spaces from user-generated geographic information. Landscape and Urban Planning, 201(May), 103845. https://doi.org/10.1016/j.landurbplan.2020.103845
- Hess, D. B., Iacobucci, E., & Väiko, A. (2018). Network connections and neighbourhood perception: Using social media postings to capture attitudes among Twitter users in Estonia. Architecture and Urban Planning, 13(1), 67–78. https://doi.org/10.1515/aup-2017-0010
- Holton, M., & Harmer, N. (2019). “You don’t want to peer over people’s shoulders, it feels too rude!” The moral geographies of using participants’ personal smartphones in research. Area, 51(1), 134–141. https://doi.org/10.1111/area.12425
- Huang, J., Obracht-Prondzynska, H., Kamrowska-Zaluska, D., Sun, Y., & Li, L. (2021, February). The image of the City on social media: A comparative study using “Big data” and “Small data” methods in the Tri-City region in Poland. Landscape and Urban Planning, 206, 103977. https://doi.org/10.1016/j.landurbplan.2020.103977
- Kovács-Győri, A., Ristea, A., Havas, C., Resch, B., & Cabrera-Barona, P. (2018). #London2012: Towards citizen-contributed urban planning through sentiment analysis of twitter data. Urban Planning, 3(1), 75–99. https://doi.org/10.17645/up.v3i1.1287
- Kozlowska, A., & Steinnocher, K. (2020). Urban activity detection using geo-located Twitter data. GI_Forum, 8(1), 15–31. https://doi.org/10.1553/giscience2020_01_s15
- Latzko-Toth, G., Bonneau, C., & Millette, M. (2017). Small data, thick data: Thickening strategies for research, trace-based social media. In L. Sloan & A. Quan-Haase (Eds.), The SAGE handbook of social media research methods (pp. 199–212). SAGE Publications Ltd.
- Lee, R., Wakamiya, S., & Sumiya, K. (2013). Urban area characterization based on crowd behavioral lifelogs over Twitter. Personal and Ubiquitous Computing, 17(4), 605–620. https://doi.org/10.1007/s00779-012-0510-9
- López Baeza, J., Serrano Estrada, L., & Nolasco-Cirugeda, A. (2016). Percepción y uso social de una transformación urbana a través del social media. Las setas gigantes de la calle San Francisco. I2 Innovación E Investigación En Arquitectura Y Territorio, 4(2), 1–19. https://doi.org/10.14198/i2.2016.5.03
- Malik, A., Heyman-Schrum, C., & Johri, A. (2019). Use of Twitter across educational settings: A review of the literature. International Journal of Educational Technology in Higher Education, 16(1), 1. https://doi.org/10.1186/s41239-019-0166-x
- Manca, S., & Ranieri, M. (2016, April). Facebook and the others. Potentials and obstacles of social media for teaching in higher education. Computers & Education, 95, 216–230. https://doi.org/10.1016/j.compedu.2016.01.012
- Martí, P., Nolasco-Cirugeda, A., & Serrano-Estrada, L. (2017, September). Assessment tools for urban sustainability policies in Spanish Mediterranean tourist areas. Land Use Policy, 67, 625–639. https://doi.org/10.1016/j.landusepol.2017.06.015
- Martí, P., García-Mayor, C., Nolasco-Cirugeda, A., & Serrano-Estrada, L. (2020). Green infrastructure planning: Unveiling meaningful spaces through Foursquare users ’ preferences. Land Use Policy, 97(September), 104641. https://doi.org/10.1016/j.landusepol.2020.104641
- Martí, P., Serrano-Estrada, L., & Nolasco-Cirugeda, A. (2019). Social media data: Challenges, opportunities and limitations in urban studies. Computers, Environment and Urban Systems, 74(March), 161–174. https://doi.org/10.1016/j.compenvurbsys.2018.11.001
- Martin, M. E., & Schuurman, N. (2020). Social media big data acquisition and analysis for qualitative GIScience: Challenges and opportunities. Annals of the American Association of Geographers, 110(5), 1335–1352. https://doi.org/10.1080/24694452.2019.1696664
- Noor, S., Guo, Y., Shah, S. H. H., Nawaz, M. S., & Butt, A. S. (2020). Research synthesis and thematic analysis of Twitter through bibliometric analysis. International Journal on Semantic Web and Information Systems, 16(3), 88–109. https://doi.org/10.4018/IJSWIS.2020070106
- Pawson, E., Fournier, E., Haigh, M., Muniz, O., Trafford, J., & Vajoczki, S. (2006). Problem-based learning in geography: Towards a critical assessment of its purposes, benefits and risks. Journal of Geography in Higher Education, 30(1), 103–116. https://doi.org/10.1080/03098260500499709
- Salas-Olmedo, M. H., Moya-Gómez, B., García-Palomares, J. C., & Gutiérrez, J. (2018, June). Tourists’ digital footprint in cities: Comparing big data sources. Tourism Management, 66, 13–25. https://doi.org/10.1016/j.tourman.2017.11.001
- Shepherd, A., & Cosgriff, B. (1998). Problem-based learning: A bridge between planning education and planning practice. Journal of Planning Education and Research, 17(4), 348–357. https://doi.org/10.1177/0739456X9801700409
- Silva, T. H., Horizonte, B., Salles, J., & Loureiro, A. A. F. (2013, August 13). Urban social behavior. A comparison of Foursquare and Instagram to the study of city dynamics and urban social behavior. Proceedings of the 2nd ACM SIGKDD International Workshop on Urban Computing (UrbComp ’13), August, Article 4, 1–8. https://doi.org/10.1145/2505821.2505836
- Sloan, L., Morgan, J., Burnap, P., Williams, M., & Preis, T. (2015). Who tweets? Deriving the demographic characteristics of age, occupation and social class from twitter user meta-data. PLoS ONE, 10(3), 1–20. https://doi.org/10.1371/journal.pone.0115545
- Sloan, L., & Quan-Haase, A. (2017). The SAGE handbook of social media research methods. SAGE Publications Ltd.
- Smith, B. L., & MacGregor, J. T. (1992). What Is Collaborative Learning? In A. Goodsell, M. Maher, V. Tinto, B. L. Smith, & J. MacGregor (Eds.), Collaborative learning: A sourcebook for higher education (pp. 9–22). National center on postsecondary teaching, learning, and assessment publishing. Pennsylvania State University.
- Snelson, C. L. (2016). Qualitative and mixed methods social media research: A review of the literature. International Journal of Qualitative Methods, 15(1), 1–15. https://doi.org/10.1177/1609406915624574
- song, X. P., Richards, D. R., Tan, P. Y., Matiasek, J., & Elbe-Bürger, A. (2020). Using social media user attributes to understand human–environment interactions at urban parks. Scientific Reports, 10(1), 1–11. https://doi.org/10.1038/s41598-019-56847-4
- Spronken-Smith, R. (2005). Implementing a problem-based learning approach for teaching research methods in geography. Journal of Geography in Higher Education, 29(2), 203–221. https://doi.org/10.1080/03098260500130403
- Vandeyar, T. (2020, February). The academic turn: Social media in higher education. Education and Information Technologies, 25(6), 5617–5635. https://doi.org/10.1007/s10639-020-10240-1
- Venek, V., Brunauer, R., & Schneider, C. (2016). Developing a learning line on GIScience in education. GI Forum, 2(2013), 57–66. https://doi.org/10.1553/giscience2016
- Vu, H. Q., Li, G., & Law, R. (2020). Cross-country analysis of tourist activities based on venue-referenced social media data. Journal of Travel Research, 59(1), 90–106. https://doi.org/10.1177/0047287518820194
- Welsh, K. E., France, D., Whalley, W. B., & Park, J. R. (2012). Geotagging photographs in student fieldwork. Journal of Geography in Higher Education, 36(3), 469–480. https://doi.org/10.1080/03098265.2011.647307