
ABSTRACT
When evaluating environmental challenges such as vulnerability to natural hazards, it is important to consider both the physical exposure as well as the socio-demographic characteristics of a population. Human populations and their characteristics vary considerably over space and time. This paper introduces and evaluates an open-source resource that has been developed to introduce students in higher education to the quantitative skills required to evaluate pressing social and environmental challenges. It utilises census and hazard data within QGIS and R for a flood risk example in southwest England. A standalone online practical resource supports students to obtain, prepare, visualise and analyse geospatial data with reference to population characteristics. Within the exemplar provided, it is determined that there is a significant (p < 0.01) but small difference in the population exposed to flood risk based on socio-economic classification within SW England. The resource is reviewed following student feedback as well as a discussion for its use as a possible outreach tool.
Introduction
It has been estimated that worldwide more than 4.6 billion gigabytes of data will be generated daily by 2025 (Forbes, Citation2022). In this digital and data rich world, geospatial data and associated analyses occupy a central role within geography. This paper reviews a final year geography undergraduate module and associated resource, developed by the author, in “Big Data and Spatial Analytics” which has run since 2020 (). It also presents a standalone, open source, teaching and learning resource that can be used by geography students, or by practitioners for geospatial skill development or as a widening participation outreach activity. The principal focus of this paper is on the open software and to develop the geospatial skills required to tackle socioenvironmental issues. An illustrative application concerning flood risk in southwest England is used to demonstrate the applicability of the resource reviewed in this paper.
Table 1. Big data and spatial analytics module cohort size.
In the United Kingdom (UK), subject specific benchmarking statements describe the nature of academic study and skills expected to be evidenced by graduates. For geography, this includes data acquisition and analysis of spatial and environmental information using geographic information systems (GIS) and statistical analyses. Subject specific skills require the retrieval and manipulation of secondary data sets and application of spatial statistics as well as tools to examine spatial autocorrelation (QAA, Citation2022). It is over twenty years since the UK’s first national benchmarking statement for higher education geography was published by the Quality Assurance Agency for Higher Education (QAA). These benchmarking statements still aim to ensure quality assurance practices and consistent use of vocabulary from beyond the education sector (Chalkley & Craig, Citation2000). It describes the nature of academic study and standards expected from British geography graduates and was most recently revised in 2022. The Royal Geographical Society (with the Institute of British Geographers), the UK’s learned society and national body for geography, has adopted these principles in their own voluntary accreditation scheme (RGS, Citation2022). In relation to Geographical Information Systems (GIS) and spatial data, the QAA geography subject benchmarking statement requires that (QAA, Citation2022, p. 14):
Geography graduates are adept at research design and data collection; analysing, presenting, interpretating and communicating qualitative and quantitative data; retrieving and manipulating big geospatial data sets; using inferential and relational statistics; modelling and mapping geospatial events; coding; using geospatial technologies such as digital cartography, GIS and remote sensing.
The UK Government’s Geospatial Commission Citation2030 strategy has committed to a target to work with universities to publish best practice as a first step towards embedding geospatial into data science and geography courses (Geospatial Commission, Citation2023). The combination of geospatial skills and an understanding of social and environmental issues means that geographers and environmental scientists are well placed to investigate some of the most pressing challenges facing society. Questions such as population flood risk and vulnerability. Knowing the “social profile” of those at risk can help target warning strategies but also allow for better disaster preparedness (Fielding, Citation2018). This practical resource enables participants to reflect on the following questions: why do some people live in hazardous locations? how many people or households are at risk of flooding? is there a difference in the characteristics of the people or households who are situated in an area exposed to flood risk versus those who are not? These questions are explored and evaluated using population and flood risk data. Previous work has shown that population exposure to flood risk is varies by both temporal and spatial characteristics (Smith et al., Citation2016). The principal aim of this task is to evaluate “are people from lower socio-economic backgrounds (routine occupations) disproportionately exposed to flood risk in SW England?” It achieves this by comparing small area population counts for people with a routine occupation within and outside of flood-exposed areas. Finally, this paper concludes with a discussion on the use of this resource as an outreach tool.
Materials and methods
The standalone resourceFootnote1 developed is hosted within an ESRI StoryMap, but the data and analysis software required are open source. This format is not crucial so the content can be developed into alternative display mechanism to best suit the aim of the intended delivery. Although a proprietary online service, the interactive StoryMap was chosen for its interactive functionality as well as inclusivity features on colour schemes and adaptability across platforms (e.g. phone or tablet). The service itself is still free to use and fully functional for the end user. The activity guides users through a set of tasks using the open-source software QGIS (evaluated on v. 3.28.12-Firenze LTR) and R Studio (2023.09.1 Build 494). Another advantage for this set up is compatibility across Mac OS and Microsoft Windows operating systems.
An analytical overview is provided in which shows the hazard assessment processes using both GIS and R. Participants are guided through the acquisition and preparation of open source 2021 Census data tables and spatial geographies for England and Wales. It utilises 2021 Census Output Area (OA) counts for the usually resident population as well as OA-level National Statistics Socio-economic Classification (NS-SEC) (). This is the smallest geographic level for which detailed census population counts and characteristics are available in England and Wales. The National Statistics Socio-economic Classification (NS-SEC) indicates a person’s socio-economic position based on their occupation and other job characteristics (Office for National Statistics, Citation2023a). Each OA contains an average population of 316 usual residents, with 188,888 OAs covering England and Wales in a contiguous layer without gaps (2021 Census). In QGIS, the usually resident 2021 Census population count and NS-SEC is joined (by OA code) to its respective OA population weighed centroid (PWC). The PWC represent the centre of population (density) within each OA, rather than simply the geographic centre (Office for National Statistics, Citation2023b) to add spatial representation. Areas of flood risk were identified using the Environment Agency’s Flood Map Zone 3 for SW England. This dataset represents areas with a 1 in 100 (1%) or greater chance of flooding each year from rivers; or with a 1 in 200 (0.5%) or greater chance of flooding each year from the sea (ignoring defences) (Environment Agency, Citation2023). The select by location/invert selection tools are used to differentiate the PWCs located within the flood risk zones. The exported flood risk and non-flood risk PWCs files (as.csv format) are statistically compared using a pre-prepared script in R Studio. Firstly, their normality is assessed in R using the shapiro.test() function. Secondly, an appropriate statistical test for difference is selected, in this case an unpaired two-sample Wilcoxon test (also known as Mann–Whitney U) wilcox.test() is chosen. The example uses freely available population census data and Environment Agency flood map data () for a case study concerning population exposure to flood risk in southwest England. These datasets are available under the UK’s open government licencing framework, compatible with the Creative Commons Attribution (CC-BY) licence.
Figure 1. An analytical overview of population flood risk assessment using QGIS and R.
Table 2. Data sources.
Results and evaluation
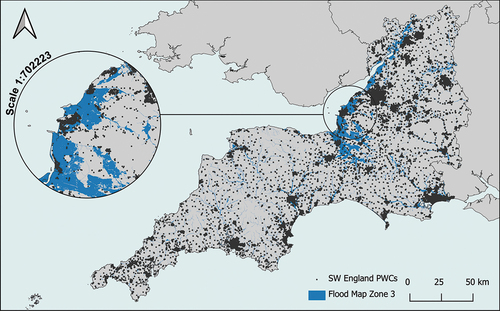
It is evident that flood risk is not uniformly distributed. shows the location of centres of population (OA PWCs) in relation to areas of designated flood risk across SW England. In this example, there are 232,388 people potentially exposed to flooding, based on their OA PWC location. This represents approximately 5% of the region’s population. This measure is widely used but is often considered a “night-time” estimate (e.g. Smith et al., Citation2016) as it concerns the residential address of the usually resident census population count.
Figure 2. A map showing the location of population (by OA PWC) by flood risk exposure for SW England.
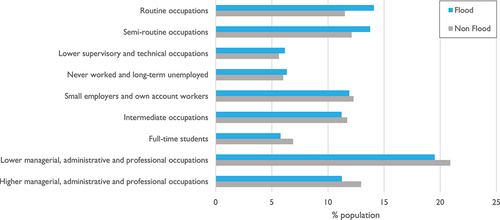
By examining OA population counts by NS-SEC for flood risk and non-flood risk areas () it is observed that the greatest difference between these groups is within the routine occupation classification. The mean OA percentage population within a routine occupation classification was 34.69% for those located within flood risk areas, compared to 29.43% for those who were not. Statistical analysis of these results (using the underlying count data) reveal that there is a significant difference in the population with lower socio-economic status (routine occupations) and exposure to flood risk across SW England (p < 0.01). Although it could be argued, in this example, that people with lower socio-economic status are disproportionately affected by flooding in SW England additional analysis is required. To examine this the effect size, Cohen’s d was calculated: 0.325, signifying a small difference between the flood versus non-flood population groups based on routine occupations. Therefore, this reveals that although the difference is significant, it is only a small difference based on the data used in this study location. This builds on ideas developed by Fielding (Citation2018) where in selected English locations there does appear to be a difference in flood risk exposure by selected population socio-demographic characteristics. This is only a small-scale example using limited variables, but it still brings to attention that scale matters in geographic analyses. For example, although the size of the significant difference of disproportional flood risk exposure is small at the regional scale, it does not mean there is local variability. This resource paves the way for user to gain experience in geospatial data handling as well as consider additional variables that may be most relevant to them in any extension to this approach.
Figure 3. Bar chart showing the percentage SW England population by NS-SEC by flood risk using 2021 Census OA level data.
This resource has been evaluated in formal end of module evaluation questionnaire feedback. Since its development in the current format in 2020 it has received 2,903 views (as of 13/12/2023). It has also been updated to utilise the most current 2021 Census data available. The interactive guide has been found a helpful format for both staff and students. One selected student comment stated:
[The GIS StoryMap guide] was really useful to refer back to all the time. Very well laid out and informative. Feel like we now have a new very useful skill in R which can be used in dissertations and jobs.
Hosting the guide online allows for staff to make real-time updates in response to direct feedback when being operated within a face-to-face setting. This has been beneficial in providing live edits for additional clarity, which can instantly be rolled out to all users simultaneously. This format also allows for embedded interactive maps to serve as a progress check and a visual aide memoire. This approach facilities a two-way dialogue and joint input into the development of the resource based on feedback from end users. Although designed to function as a standalone online distance learning tool, this resource has been delivered within timetabled face-to-face practical sessions when used within a credit-bearing module setting. Within the institutional course context module prerequisites are not stipulated. Therefore, this resource is designed for users without advanced specialist prior knowledge.
Conclusions
This paper has presented and evaluated an open source geospatial exercise that has arisen following the creation of a final-year undergraduate geography module in big data. It uses the example of differential flood risk assessment based on population socio-economic characteristics. This example reveals that populations, with an occupation classified as routine, live in areas that have a significant (but small) higher exposure to flood risk within SW England.
There is an opportunity for this resource to be adapted or utilised by geography professionals when considering curriculum development or as a standalone activity. This resource also provides a tool that could be used within an outreach or external engagement workshop setting. These could be for the purpose of widening participation or promoting the academic discipline. It is intended to work as a self-guided activity but in an engagement, style setting it would also be operated as a face-to-face self-paced activity with face-to-face assistance available to offer local institutional context or technical support. Geographers are well placed to lead conversations around the interaction of the social and physical sciences, and in this example it is demonstrated through hazard vulnerability.
Disclosure statement
No potential conflict of interest was reported by the author(s).
Notes
1. The online resource: https://storymaps.arcgis.com/stories/4966ec0ce52e4d37953c6f3b70a5c2f4
References
- Chalkley, B., & Craig, L. (2000). JGHE symposium: Benchmark standards for higher education introducing the first benchmark standards for higher education geography. Journal of Geography in Higher Education, 24(3), 395–398. https://doi.org/10.1080/713677416
- Environment Agency. (2023). Flood map for planning (rivers and sea) -flood zone 3. https://www.data.gov.uk/dataset/bed63fc1-dd26-4685-b143-2941088923b3/flood-map-for-planning-rivers-and-sea-flood-zone-3
- Fielding, J. L. (2018). Flood risk and inequalities between ethnic groups in the floodplains of England and Wales. Disasters, 42(1), 101–123. https://doi.org/10.1111/disa.12230
- Forbes. (2022). How big data empowers organizations to work smarter, not harder. Retrieved February 21, from https://www.forbes.com/sites/forbestechcouncil/2021/08/23/how-big-data-empowers-organizations-to-work-smarter-not-harder/?sh=774eb3c3532f
- Geospatial Commission. (2023). Policy paper: UK Geospatial Strategy 2030: Unlocking the power of location. Geospatial Commision. https://assets.publishing.service.gov.uk/media/6489b1fb103ca6000c039ea2/2023-06-15_UK_Geospatial_Strategy_2023_.pdf
- Office for National Statistics. (2023a). National statistics socio-economic classification (NS-SEC) variable: census 2021. Retrieved December 13, from https://www.ons.gov.uk/census/census2021dictionary/variablesbytopic/labourmarketvariablescensus2021/nationalstatisticssocio-economicclassificationns-sec
- Office for National Statistics. (2023b). Population weighted centroids: guidance for 2021 statistical geographies. Retrieved December 6, from https://open-geography-portalx-ons.hub.arcgis.com/datasets/ons:population-weighted-centroids-2021-statistical-guidance/about
- QAA. (2022). Subject benchmark statement for geography. Retrieved April 5, from https://www.qaa.ac.uk/docs/qaa/sbs/sbs-geography-22.pdf?sfvrsn=29addc81_2
- RGS. (2022). Programme accreditation handbook. Retrieved April 5, from https://www.rgs.org/research/programme-accreditation/apply-for-accreditation/downloads/rgs-ibg-geography-programme-accreditation-hand-(1).pdf/
- Smith, A., Martin, D., & Cockings, S. (2016). Spatio-temporal population modelling for enhanced assessment of urban exposure to flood risk. Applied Spatial Analysis and Policy, 9(2), 145–163. https://doi.org/10.1007/s12061-014-9110-6