
ABSTRACT
In the UK, most prospective university students study ‘traditional’ academic qualifications such as A-Levels. However, increasing numbers of students are entering UK higher education with 'non-traditional' or vocational qualifications. This has provoked debate about the relationships between entry qualifications and degree outcomes; this paper investigates this relationship in sport and exercise science. Data from five large cohorts of undergraduates at a post-1992 university in the Midlands of England are analysed to investigate predictors of degree outcomes. The models predict better degree outcomes for those with higher UCAS tariff points; who studied A-Levels; who were female and white. Students entering with only vocational qualifications were more likely to be BME, male, and from poorer backgrounds. Therefore, the apparent associations between entry qualifications and outcomes can misrecognise the importance of the qualifications themselves. Students are not randomly distributed between post-16 qualification pathways and any associations with degree outcomes might be a function of factors that influenced choices at aged 16. This is particularly important now, amidst major reforms of post-16 qualifications in England, including the development of the new Technical Level qualifications.
Introduction
Since the 1960s, UK higher education (HE) has moved from being for an elite minority to being a mass experience (Smith and White Citation2015). In 1963, just 8.5% of the British population went to university, increasing to 40% by the start of the 21st century (Chowdry, Dearden, and Wyness Citation2010). The Government’s commitment in the late 1990s to widening participation (WP) aimed to increase participation from socio-economically disadvantaged backgrounds and other under-represented groups which has contributed to the growth in numbers.
In the UK, most prospective university students take ‘traditional’ academic qualifications such as A-Levels. However, over the last two decades there has been a substantial increase in the number of students entering HE with non-traditional or vocational qualifications (Rouncefield-Swales Citation2014) even though these qualifications were not always envisaged as routes into HE; the Business and Technology Education Council (BTEC) is one such example. BTECs, and other Level 3 qualifications, are considered as equivalents to the traditional A-level route into university but are typically associated with students from differing educational backgrounds or socio-economic groups. UCAS (UCAS Citation2019) suggests the increased HE participation from less affluent groups has been largely due to those with BTECs.
Hayward and Hoelscher (Citation2011) comprehensive study of HE access for students with vocational qualifications showed that they were at a relative disadvantage in terms of the institutions and subjects that they could access. Schwartz (Citation2004) and Hoelscher et al. (Citation2008) reported that students with non-traditional qualifications typically progress to post-1992 universities and colleges of HE, whilst students with academic qualifications were more likely to study at pre-1992 universities. Furthermore, data analysed as part of the Transforming Transitions Project shows that BTEC students were less likely to study at a Russell Group university and more likely to study at low-tariff providers (Banerjee Citation2019).
This paper explores these issues of entry qualification pathways and degree outcomes in Sport and Exercise science. Many higher education institutions (HEIs) are now offering undergraduate courses in this subject, although the majority are post-1992 universities. These courses include both theoretical aspects and practical application and attract students from ‘traditional’ and ‘non-traditional’ entry routes. Data analysed as part of the Transforming Transitions Project in the subject areas of Business, Computer Science, and Sport and Exercise Science showed that the highest proportion of those that failed the first year of their degree had studied only BTECs. Despite the progression from first to second year of degree study being lower for BTEC compared to A-Level students, the vast majority of BTEC students do succeed, and are particularly more successful in Sport and Exercise Science compared to those that studied degrees in the areas of Business and Computer Science.
Higher education degree outcomes
BTEC students are more likely to drop out of university study than A-Level students, even when prior attainment is accounted for (Hayward and Hoelscher Citation2011; Office for Students Citation2019). Rouncefield-Swales (Citation2014) reported that 67% of BTEC students completed their studies compared to 92.3% of A-Level students. This is not solely due to academic failure but other personal and social challenges such as finance, health, and employment. Importantly, she argues that whilst there is a correlation between disadvantaged students and vocational study at post-16, attrition rates are linked to all disadvantaged students regardless of qualification pathway.
Most research that relates degree outcomes to qualifications focuses on the predictive capability of A-Levels, and sub-categories of students (HEFCE Citation2003, Citation2014; Naylor and Smith Citation2004). Peers and Johnston (Citation1994) meta-analysis of A-Levels and degree performance showed a small but significant relationship, and differing by discipline; A-Levels were the weakest predictors for social science outcomes and the best predictors in the sciences. Using HESA data, Gill and Vidal Rodeiro (Citation2014) showed attainment in all qualifications to be a good predictor of degree outcome, but the BTEC cohort was weaker in terms of degree outcome, and had the lowest correlation with degree class. They argued that the UCAS tariff overvalues BTECs in terms of a student’s probability of obtaining a ‘good’ degree (2.1 or 1st) compared to A-Levels (see also Huws and Taylor Citation2008).
Research within HEIs has often focused on specific subjects and post-1992 universities: for example, Huws and Taylor (Citation2008) with equine and animal studies, Hatt and Baxter (Citation2003) with social sciences, Brimble (Citation2015) with pre-registration nursing, and Huntley et al. (Citation2017) with sports development. Brimble (Citation2015) compared the performance of nursing students with the same UCAS tariff who entered the course with A-Levels, BTEC or Access courses and found no significant differences in attainment between A-Level and BTEC students. Huntley et al. (Citation2017) reported similar findings but only one graduate cohort was analysed. Conversely, others have found differences in the degree performance of those entering with alternative entry qualifications; A-Level students performing better than International Baccalaureate (IB) and BTEC students, with Access and franchise students performing better still (Hatt and Baxter Citation2003; Huws and Taylor Citation2008). They suggest the skills, expectations, and experiences these students bring into HE differ from the traditional A–Level entrant (e.g. with different forms of assessment).
In agreement with Gill (Citation2018), there is reason to be cautious in making comparisons between qualifications because they are aimed at different types of students and have different objectives. For example, A-Levels are taken by students across a broad range of abilities but qualifications such as BTECs are usually taken by students with lower prior attainment and are more likely to lead to progression into employment rather than to HE (Gill Citation2018). Furthermore, entry qualifications only explain a small part of degree attainment so there must be other factors at play. Yet, university admissions in the UK currently focus almost entirely on students’ prior attainment (Gill and Vidal Rodeiro Citation2014), often without giving any consideration to the context in which this was achieved. The use of contextual data in UK HEI admissions is central to the WP agenda (Universities Citation2003). Thiele et al. (Citation2016) have suggested that the use of contextual data within admission processes could help to identify students who may need additional academic support. This needs to be supported by robust evidence of the impact of students’ background characteristics on attainment within HE, for example, gender, ethnicity, and social class.
Recent research suggests that females are now more likely to outperform males (Woodfield Citation2014), including in the study on sports development students by Huntley et al. (Citation2017). White students perform significantly better than non-white students, even after controlling for a variety of factors (Connor Citation1996; Broecke and Nicholls Citation2006; Richardson Citation2008). Variations exist about the ethnic groups that perform less well, though HEFCE (HEFCE Citation2014) showed that whilst prior attainment is a key factor in degree attainment, it does not explain the differences between ethnic groups. The least-advantaged students consistently have lower attainment and progression even after controlling for other factors. Given that young people from a lower social class and BME are the groups that are more likely to be taking vocational qualifications, it adds to the complexity of predicting student degree outcomes.
The aim of this paper is to investigate the association between prior educational attainment in Level 3 qualifications and degree outcomes in sport and exercise science and whether differences can be explained by the type of Level 3 qualification studied and other student demographics such as gender, ethnicity, and socio-economic class.
Methodology
This paper is the quantitative aspect of a larger mixed methods study, the design of which had an implementation sequence which was sequential; beginning with the collection and analysis of the quantitative data followed by the collection and analysis of qualitative data obtained from student interviews. Pragmatism was the paradigm that underpinned this methodological approach, which acknowledges that ‘there may be both singular and multiple versions of the truth and reality, sometimes subjective and sometimes objective, sometimes scientific and sometimes humanistic’ (Cohen, Manion, and Morrison Citation2011, 23). Therefore, using quantitative and qualitative methods together would address both the ‘what’ and the ‘why’ aspects of the research question. A more in-depth account and justification of the study’s methodological approach, including an account of the good practice that has been adopted in respect of research methodology, can be found in Hastings (Citation2023).
The analysis presented in this paper is based on five cohorts of sport and exercise science graduates, who started the course between the academic years of 2011/12 and 2015/16, in a post-1992 university in the Midlands of England. It includes student Level 3 qualifications (type of qualification, subjects, and grades), degree outcomes (% mark and classification), gender, ethnicity, and measures of social class (i.e. the Registrar General’s classification system employed by HESA, and POLAR4). Statistical analysis of the five cohorts highlighted broad homogeneity, and there were no changes in entry criteria during this period, so the five cohorts were merged to increase sample size. A total of 531 students started the course over the five-year period making their records eligible for inclusion. Non-UK students were excluded (28), along with those with qualifications at Level 4 and above (31), those who had left the course for reasons other than academic failure (29), those that had not yet completed the course (26), and those where classification and/or Level 3 qualification information was absent (68). In total 182 student records were excluded, leaving a final sample for analysis of 349 students.
Data was analysed using predominantly non-parametric statistics of categorical data. Multinomial regression modelled the relationship between the independent variables (e.g. qualification, gender, ethnicity, etc.) and three degree classification groups: 2.2, 2.1, 1st, with Fail as the reference category. Parametric statistics were used when the data of both dependent and independent variables were scale (continuous), and included the use of the independent sample t-test to measure the difference between the means of two samples containing different people; the paired t-test to measure the difference between the means of two samples that contain the same people; one-way analysis of variance (ANOVA) to measure the difference between means of more than two samples, with the use of a Tukey post hoc test to identify where significant differences lie; and Pearson’s correlation, to quantify the strength of the relationship between two variables. Where appropriate, scale data was presented as Mean ± SD. Statistical significance was set at p < 0.05.
Results
Descriptive statistics for the sample are in . Due to a large amount of missing data and many categories, socio-economic class (SEC) was re-grouped into SEC representation in HE with reference to the UK Performance Indicators information provided by HESA: High representation in HE group includes SEC categories 1–3, and the under-represented in HE category includes SEC categories 4–7, with the decision made to include category 8 (long-term unemployment and never worked) within the under-represented group. The ‘other’ category within Level 3 qualification included students that had studied IB, Access to HE, and Foundation year (year of study that gives access onto a degree course).
Table 1. Descriptive statistics for the student sample.
The modal degree awarded was a 2.1 (45.3%) with the proportion of students obtaining a ‘good’ degree (1st/2.1) 55.6%, and those awarded a degree (any honours degree classification and unclassified) were 83.7%. This data is skewed due to the proportion of those who did not obtain a degree (16.3%). There was no significant association between the degree start year and degree classification (χ2(20) = 21.67, p = 0.359).
Total UCAS tariff includes all of a student’s qualifications at Level 3 that carry tariff points. As a typical offer is based on 3 A-Levels or equivalent, UCAS ‘Tariff from 3’ (A-Levels or equivalent) was also calculated. Total UCAS Tariff was significantly higher than Tariff from 3 (p < 0.05), neither being predicted by gender or ethnicity. POLAR4 was correlated with tariff point groupings with Quintile 5 having the lowest points and Quintile 2 the highest. Qualifications had a significant effect on both Total UCAS tariff (p < 0.05; A-Level vs Mixed; A-Level vs. BTEC) and Tariff from 3 (p < 0.05; between all pairwise comparisons), A-Level students having the lowest points and BTEC students the highest
There was a significant association between ethnicity and Level 3 qualification (χ2(3), = 20.70, p < 0.001) with white students more likely to have studied A-Levels (62.9% vs 39.7%) whilst Black and minority ethnic (BME) students were more likely to study BTEC (33.8% vs. 17.4%) or a mix of A-Levels and BTEC (24.3% vs. 16.4%). There was a significant association between Level 3 qualification and gender (χ2(3) = 12.18, p = 0.007) with females more likely to have studied A-Levels (55.4% vs. 53.5%) or a mix of A-Levels and BTEC (25.7% vs. 17.8%) whilst males were more likely to have studied BTECs (26.9% vs.12.2%). There was a significant association (χ2(12), = 27.73, p = 0.006) between Level 3 qualification studied and POLAR4 (). Students from the higher quintiles are more likely to have studied A-Levels and those from the lower quintiles BTEC. No significant associations were observed between POLAR 4 and gender (χ2(4) = 5.16, p = 0.27) or ethnicity (χ2(4) = 5.43, p = 0.25). There was no significant association observed between SEC Representation in HE and Level 3 qualification (χ2(21) = 29.2, p = 0.11) or ethnicity (χ2(1) = 2.09, p = 0.15). ‘Other’ Level 3 qualification has been removed from all figures due to small numbers.
Figure 1. Percent of level 3 qualification by POLAR4 quintile.
Level 3 qualification
Of the students who had studied A-Levels, 67.5% obtained a ‘good’ degree compared to Mixed (42.6%) and BTEC (42.2%) groups (). Students were more likely to obtain a degree and get a higher classification if they had studied A-Level. The association between Level 3 qualification and degree classification was significant (χ2(15) = 71.74, p < 0.001).
Figure 2. Percent of degree classification by level 3 qualification.
UCAS tariff points
For the analysis of the association between UCAS tariff points and degree classification, Total UCAS Tariff points (<250, 250–320, >320) and Tariff from 3 (<220, 220–260, >260) were each subdivided into three similarly sized groups. For the correlation analysis between degree mark and UCAS points, the points data was ungrouped and in its original form.
The proportion of students who obtained a ‘good’ degree was highest for the 250–320 group (; 65.8%). Results suggest that when all qualifications are considered together, an increase in Total UCAS Tariff points from <250 points to 250–320 points results in a higher degree classification but increases above 320 points results in a decrease. The association between Total UCAS Tariff and degree classification was not significant (χ2 (10) = 15.42, p = 0.12). Correlation analysis investigating the relationship between degree mark (%) and Total UCAS Tariff found no significant relationship (r = 0.094, p > 0.05). When all qualifications are considered together, there is a possibility that the BTEC qualifications may be overvalued in terms of UCAS tariff. For that reason, it is important to also consider the qualifications separately in the analysis.
Figure 3. Percent of degree classification by Total UCAS tariff group. a) all Level 3 qualifications, and b) A-Level only.
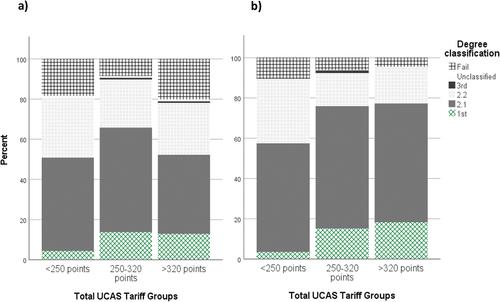
The association between Total UCAS Tariff and degree classification for those that studied A-Levels was just outside of significance ( χ2(8); = 14.80, p = 0.063). However, there was a clear trend for A-Level students who enter the course with higher points getting a better degree class, with the proportion of students obtaining a ‘good’ degree lowest in the <220 group (57.4%) and highest in >260 (77.3%). Correlation analysis of degree mark and Total UCAS Tariff shows a weak but significant positive relationship (r = 0.27, p < 0.001). There was no significant association between Total UCAS Tariff and degree classification for the BTEC or Mixed groups when analysed separately (p > 0.05). There was no significant relationship (p > 0.05) between degree mark and Total UCAS Tariff points.
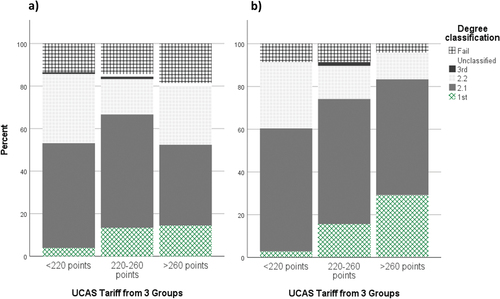
There was a weak but significant association between Tariff from 3 and degree classification ( χ2(10); = 20.28, p = 0.027). Obtaining 220–260 points resulted in a greater proportion of students obtaining a ‘good’ degree (66.6%) compared to both <220 (53.2%) and >260 (52.4%). Correlation analysis of degree mark and Tariff from 3 was not significant (r = 0.089, p > 0.05). It is important, for the reasons previously outlined, to consider the qualifications separately. Analysis showed that both the A-Level (χ2(8) = 23.99, p = 0.002) and the Mixed groups (χ2(10) = 18.98, p = 0.041) had a weak but significant association between Tariff from 3 and degree classification, but the BTEC group did not (p > 0.05). When analysing those with A-Levels only (), there was a clear increase in the proportion of students obtaining a ‘good’ degree with increasing tariff points. The relationship between degree mark and Tariff from 3 was weak but significant (r = 0.30, p < 0.001). For the Mixed group, the smallest proportion of students who obtained a ‘good’ degree was in the <220-point group (14.3%) but the largest was in the 220–260 group (58.9%). The relationship between degree mark and Tariff from 3 was not significant (r = 0.15, p > 0.05).
Figure 4. Percent of degree classification by Tariff from 3 group a) all Level 3 qualifications, and b) A-Level only.
Gender
The association between gender and degree classification was on the border of significance (χ2(5) = 10.96, p = 0.052). However, the small female sample size will be considered when interpreting the results. A greater proportion of females achieved a ‘good’ degree (64.9%) compared to males (53.1%) who also had a higher failure rate despite both genders entering the course with similar attainment as shown by tariff points, although it is important to note that a larger proportion of male students took BTECs than females
Ethnicity
The association between ethnicity and degree classification is significant (χ2(5) = 25.93, p < 0.001). A greater proportion of white students achieved a ‘good’ degree (64.8%) compared to BME (41.2%) who also had the highest failure rate despite both groups entering the course with similar attainment. It must be noted that white students were more likely to have studied A-Levels and BME students BTEC.
SEC representation in higher education
Despite the under-represented in HE students entering the course with a higher attainment, the high representation group have slightly better degree attainment as shown by a higher proportion of students achieving a ‘good’ degree (58.9% vs. 54.6%) and degree overall (86.5% vs. 81.5%). However, there was no significant association between degree class and SEC representation in HE (χ2(5) = 3.35, p = 0.80).
POLAR4
The association between POLAR4 and degree classification was significant (χ2(20) = 35.87, p = 0.016). Despite students from Quintile 5 entering the course with the lowest attainment, these students had the largest proportion of ‘good’ degrees (60.2%). This association is not as clear and as easy to interpret as other factors considered. Furthermore, students in Quintile 5 were more likely to have studied A-Levels than BTECs .
Multinomial logistic regression analysis
The next step in the analysis explored which predictors of degree classification had the strongest explanatory power and which were not relevant once they have been controlled for each of the other factors. Multinomial logistic regression analysis was used to model the relationship between the independent (predictor) variables and membership of three-degree classification groups: 2.2, 2.1, 1st, with Fail as the reference group. The unclassified and 3rd class (degree classification groups) were removed from the analysis due to small numbers. For the same reason, the ‘other’ qualification group was removed.
A parsimonious approach to modelling was adopted, with predictors only included if they had explanatory benefit. Tariff from 3 was selected for entry to this regression model rather than Total UCAS Tariff, since it was the better predictor of degree classification in univariate analysis. This model significantly improved the model fit (χ2(18) = 76.08, Nagelkerke R2 = 0.28, p < 0.001). These results show the overall effect and illustrate which predictors improve the model’s ability to predict the outcome category (one of the three-degree classifications) ().
Table 2. Predictors’ unique contributions in the final multinomial logistic regression model.
provides the individual parameter estimates for the final multinomial logistic regression analysis.The B values represent the improvement in the logarithm of the odds of a student achieving one of the three-degree classification outcomes, compared to the ‘fail’ base category. However, it is more usual for such models to report the odds ratios, which are the exponential of the B estimates, and show the (multiplicative) effect on the odds of a student achieving one of the three-degree classification outcomes. If the odds ratio is greater than 1, for example, 3.2 for females obtaining a 1st, then females are more likely to obtain a 1st than males. This is interpreted as the odds of a female student obtaining a 1st are 3.2 times the odds of a male student obtaining a 1st, all other things being equal (Level 3 qualifications, Tariff from 3 and ethnicity). No odds ratio is shown for males as their odds ratio is simply 1/3.2 if we wished to compare them to females. If the odds ratio is less than 1, for example, 0.25 for a BME student obtaining a 1st, the interpretation is that a BME student is less likely to achieve as 1st than a white student (since the white ethnicity group is the reference category for this variable). The 95% confidence interval (CI) for the odds ratio provides a range of values for which the true odds ratios could be in the wider population.
Table 3. Individual parameter estimates for the final multinomial logistic regression model.
BTEC and Mixed students are less likely to achieve a degree classification in comparison to A-Level students. Having a BTEC predicted whether a student obtained a 2.2, 2.1, and 1st compared to a Fail. As A-Level is the reference category, this is the effect of BTEC compared to A-Level. The odds of BTEC student getting a 2.2 is 0.151 times that for an A-Level student, which is better expressed as the odds of an A-Level student getting a 2.2 is ~6.6 (1/0.151) times that for a BTEC student. This increases to ~7.6 times that for a 2.1 and increases hugely to ~83 times that for a 1st. It must be noted though that the CI of the odds ratio for a 1st is large and therefore this could be as low as 7.7 (1/0.13) but does show clearly that there is a big effect. Having Mixed qualifications only significantly predicted whether a student obtained a 2.1 compared to a Fail. The odds of an A-Level student getting a 2.1 is ~6 times that for a Mixed student.
As shown by the individual parameter estimates for Tariff from 3, values below 1 indicate that having lower tariff points (<220 and 220–260) had a negative effect on degree outcomes compared to having higher tariff points (>260; the reference category). For example, the odds of a student with >260 points getting a 1st class degree is over 16 times that for a student with <220 points, and 4 times that for a student with 220–260 points.
When looking at individual parameter estimates for gender, the odds ratio values are greater than 1 which indicates that being female has a positive effect on obtaining a degree classification in comparison to males. However, being female only significantly predicted whether a student obtained a 2.1 compared to a Fail; the odds of a female getting a 2.1 classification being ~5.5 times that of a male.
The individual parameter estimates for ethnicity show that the odds ratio values are less than 1 indicating that being a BME student has a negative effect on obtaining a degree classification. However, being BME only significantly predicted whether a student obtained a 1st compared to a Fail; the odds of a white student obtaining a 1st compared to failing is ~3.9 that of a BME student.
Discussion
Prior attainment and degree outcomes
The analysis shows clear relationships between prior attainment and degree outcomes, but these are complicated. Tariff from 3, which had a significant association with degree class () was a much better predictor that Total UCAS tariff (). Furthermore, the relationship between degree mark and tariff points was slightly stronger for Tariff from 3 compared to Total UCAS Tariff. This suggests that quality, rather than quantity, of points (and thereby prior qualifications) is key.
Although there is evidence of the relationship between prior attainment and degree outcomes, the results suggest that when all qualifications are considered together in the analysis, there may be an attenuation effect at the top of the points range whereby more points do not necessarily lead to a higher degree attainment. In fact, for both Total UCAS Tariff and Tariff from 3, the mid-point group had the highest proportion of ‘good’ degrees. An attenuation effect was also found in the study by Gill (Citation2015) when total UCAS tariff points were used to predict degree outcomes.
Most studies in this area focus on A-Levels, so it was important to consider qualification pathway separately. For those students who only studied A-Levels, results suggest that an increase in tariff points results in higher degree attainment in terms of degree class () and degree mark. This effect was particularly clear for Tariff from 3 (). These results align with earlier research as previously described. There was no such positive relationship for the BTEC group in this study (c.f. Huws and Taylor Citation2008). These results show that homogenising the student cohort is unhelpful for these kinds of analyses. The BTEC group, who had the highest UCAS tariff points on entry, had lower degree attainment compared to the A-Level group. When all qualifications are considered together, the significant positive association seen for A-Levels is obscured. This may be because of the UCAS Tariff overvaluing BTEC, as suggested by Huws and Taylor (Citation2008) and Gill (Citation2016) and this might help to explain why BTECs (alone or mixed with A-Levels) were not a good predictor of degree outcome in this present study. Therefore, it is more difficult to predict the degree outcomes of students who have studied BTECs. Gill (Citation2016) suggests that experienced admission tutors can adjust BTEC offers accordingly to account for the overvaluing of this qualification, though there are clear issues of consistency and equity.
Can differences in degree outcome be explained by the type of level 3 qualification studied?
Students are more likely to obtain a degree and get a higher degree classification if they had studied A-Levels, despite having the lowest UCAS tariff points on entry and supporting the results of others as detailed previously. Degree outcomes for those students who have studied both A-Levels and BTECs (Mixed) fall in between BTEC and A-Level only. Huntley et al.’s (Citation2017) study on Sports Development courses found that type of qualification had no significant effect on outcome measures, including final degree mark. This course differs from Sport and Exercise Science, having a focus on supporting sport and physical activity participation across diverse groups of people. At first reading, the analysis in the present study suggests that BTECs are not as good as A-Levels at preparing students for a degree in Sport and Exercise Science. However, a closer look at the data is needed. Of the students who had studied BTEC 42.2% obtained a ‘good’ degree (vs 67.5% for A-Levels and 42.6% for Mixed) which is still a sizeable proportion of students that succeed with BTECs. The number of fails is the most alarming as 33.7% of BTEC students failed their degree. Whilst similar findings have been found by others, often giving the impression that ‘A-Levels are good, BTECs are bad’ in terms of preparation and outcomes in HE, it is not that simple. Therefore, an exploration of post-16 qualification choices and other factors that may be involved is required.
Gender, ethnicity, and socio-economic status predictors of outcomes
According to Myhill and Morgan (Citation2019) students with vocational qualifications such as BTECs have the characteristics of HE WP target groups. They stress the importance of not making simplistic causal assumptions based on the possession of vocational qualifications when other factors, for example, social class and ethnicity, may be equally important. In support of recent studies, gender influences degree attainment in our analysis as the proportion of females obtaining a degree and ‘good’ degree was slightly higher than males. Although this was just outside of significance when analysed as a univariate model and when controlling for the other independent variables (), the small sample size of females needs consideration. It must also be noted that a higher proportion of females studied A-Levels and Mixed qualifications compared to males who had a higher proportion studying BTEC. Therefore, some of the effect of gender on degree classification could be partly related to the Level 3 qualification studied rather than gender itself, the type of Level 3 qualification studied being influenced by the student gender. This would then minimise the gender effect, so when the other independent factors were accounted for it became less significant, as in this present study.
Ethnicity is also associated with degree attainment as a greater proportion of white students obtained a degree and ‘good’ degree compared to BME students. There was an association between ethnicity and type of Level 3 qualification studied, with BME students more likely to study BTEC and white students were more likely to study A-Levels. This is supported by previous research (Leathwood and Hutchings Citation2003; Rouncefield-Swales Citation2014).
Due to the intersectionality between factors, it was important to control for the other independent variables measured in the study. The association between ethnicity and degree attainment was just outside of significance when those variables were controlled for (), but the small sample size may explain this. There are many other studies that have found white students to have significantly better degree outcomes than BME students even when a variety of controls are allowed for (Connor Citation1996; HEFCE Citation2014, Citation2015; Broecke and Nicholls Citation2006; Richardson Citation2008). The effect of ethnicity on degree classification could therefore be partly related to the Level 3 qualification studied rather than ethnicity itself, the Level 3 qualification studied being determined by the student ethnicity. This would then minimise the ethnicity effect so when the other independent factors were accounted for it becomes less significant as is the case in the present study.
When analysed as univariates, SEC representation in HE did not have a significant association with degree classification, however POLAR4 classification did with students from areas of low participation (Quintile 1) less likely to gain a degree compared to the most advantaged (Quintile 5). However, the association between POLAR4 and degree class was not significant when controlling for the other independent variables and therefore was not included in the final regression model (). As previously reviewed, research has often reported that the social class background of students is an associated factor in differential degree outcomes, even when controlled for other factors (Gill Citation2018; HEFCE Citation2013, Citation2014). There are several reasons that could provide an explanation in the present study as to why social class did not have a significant association when other factors were controlled for, including the small subject numbers compared to others reviewed, and lots of missing data for SEC. Another reason could be the categorical measures used in this study to define social class which despite being widely used, have been criticised. The method employed in this present study uses occupational classifications of parents if the student is under 21 and can be problematic where people may change jobs regularly or do not live in ‘traditional’ households. Furthermore, such occupational classification methods are often based on the male occupation and do not consider families in which men and women engage in differently classed employment (Archer Citation2003, 10). Using geodemographic profiling, such as with POLAR4, has also been suggested to be problematic. The characterisation of residential areas can be criticised as being too broad to account for inner city and urban areas, where there is variation in the population and housing within a small geographical area (Archer Citation2003, 10).
That POLAR4 is significant when assessed as a univariant, but not when controlling for the other factors, could be related to the Level 3 qualification studied. As previously detailed, it is not just that working-class young people do less well than their middle-class peers in the same examinations; they take different educational routes and qualifications in the first place. Leathwood and Hutchings (Citation2003, 139) state that of those 16–18-year-olds who stay in post-16 education, the divisions of the schools and exam systems are replaced by which FE provider they attend. Sixth forms are more likely attended by middle-class students taking A-Levels and the working-class students are more likely to be studying vocational qualifications at FE colleges. In support of previous findings, including Rouncefield-Swales (Citation2014), our analysis found that students from the higher quintiles are more likely to have studied A-Levels and those from the lower quintiles BTECs.
Further considerations
The data analysed in this study was for entrants to the sport and exercise science degree course between 2011 and 2016. However, the educational landscape in terms of those entering HE for degree-level study continues to change with the introduction of the new Technical qualifications, and the rapid rise in the number of foundation year programmes since these cohorts graduated, tripling from around 10,000 students to around 30,000 students between 2012–13 and 2017–18 (Office for Students Citation2019; Dampier et al. Citation2019).
Summary and conclusions
Tariff from 3 and Level 3 qualifications are the strongest predictors of degree outcomes. Gender and ethnicity, whilst playing a role, are weaker predictors of degree outcome and influenced by the Level 3 qualifications, as demonstrated by the analysis. However, the final regression model, which includes tariff from 3, Level 3 qualifications, gender, and ethnicity, still only explains 28% of the variation in degree outcomes so there is a lot of unexplained variance. Explaining the remaining 72% of the variance is complex and includes factors not considered in the present study including those that are not easy to measure and many unknown variables.
The model predicts that students who have a higher Tariff from 3, are female, white, and have studied A-Levels have better degree outcomes. This is in comparison to those with a lower Tariff from 3, are male, BME, and have studied BTEC only. We have shown that the distinction between students with different entry qualifications is not clear cut and issues related to degree outcomes are not simply due to entry qualifications.
This study challenges the assumptions that some students do badly because they have done BTECs, and BTECs are not suitable qualifications to prepare a student for degree-level study; entry qualifications are only part of the story. The associations between entry qualifications and degree outcomes can misrecognise the effect of previous qualification pathways. Students are not randomly distributed between post-16 qualification pathways, and degree outcomes might well be a function of those factors that influence their choices at aged 16; such as their GCSE grades, the subjects they wish to study, as well as where they want to study, for example, 6th form or FE college.
Regardless of qualification route or student demographics, it is vital that all students entering HE achieve their potential. This research contributes to our understanding of the association between academic and social factors with degree attainment in sport and exercise science. It can also inform admissions policy and procedures and can help target and support students at risk of poor attainment.
Whilst it is acknowledged that the context of this study is sport and exercise science within one HEI, the findings will be of relevance to similar disciplines, particularly post-1992 HEIs and/or those with a significant cohort of students who enter with non-traditional entry qualifications or disadvantaged backgrounds. This is particularly important at the present time, amidst major reforms of post-16 qualifications in England, including the development of the new Technical Level qualifications and the imminent transition of students with these qualifications into HE, and the increase in students transitioning to degree level study (Level 4–6) from foundation years.
Disclosure statement
No potential conflict of interest was reported by the author(s).
References
- Archer, L. 2003. “Social Class and Higher Education.” In Higher Education and Social Class: Issues of Exclusion and Inclusion, Edited by Louise Archer, Merryn Hutchings, and Alistair Ross, 5–20. London: Rutledge Falmer.
- Banerjee, P. A. 2019. “Statistical Analysis of National Data Sets: Exploring Demographics, Access and Progression of Students in Higher Education from Vocational Entry Routes.” In Transitions from Vocational Qualifications to Higher Education: Examining Inequalities, edited by P. a. M. D. Banerjee, 39–58. Bingley: Emerald Publishing.
- Brimble, M. J. 2015. “Does Entry Route Really Affect Academic Outcome? Academic Achievement of Traditional versus Non Traditional Entrants to Bn(Hons) Pre-Registration Nursing Programmes.” Journal of Further and Higher Education 39 (3): 379–398. https://doi.org/10.1080/0309877X.2013.858675.
- Broecke, S., and T. Nicholls. 2006. Ethnicity and Degree Attainment. Department for Education and Skills.
- Chowdry, H., L. Dearden, and G. Wyness. 2010. Higher Education Reforms: Progressive but Complicated with an Unwelcome Incentive. ISRC. https://doi.org/10.1920/bn.ifs.2010.00113.
- Cohen, L., L. Manion, and K. Morrison. 2011. Research Methods in Education. Seventh edn ed. Abingdon, Oxfordshire, England: Routledge.
- Connor, H. (1996) “Ethnic Minority Graduates: Differences by Degrees.” Report 309. [online]. Accessed January 10th, 2018. https://eric.ed.gov/?id=ED398411.
- Dampier, G., L. A. Baker, C. Spencely, N. J. Edwards, E. White, and A. M. Taylor. 2019. “Avoiding the Deficit Model and Defining Student Success: Perspectives from a New Foundation Year Context.” Journal of the Foundation Year Network 2:41–52.
- Gill, T. 2015. “Using Generalised Boosting Models to Evaluate the UCAS Tariff.” Research Matters: A Cambridge Assessment Publication 20:2–6.
- Gill, T. 2016. “Assessing the Equivalencies of the UCAS Tariff for Different Qualifications.” Research Matters 21:16–23.
- Gill, T. 2018. “Preparing Students for University Study: A Statistical Comparison of Different Post-16 Qualifications.” Research Papers in Education 33 (3): 301–319. https://doi.org/10.1080/02671522.2017.1302498.
- Gill, T., and C. L. Vidal Rodeiro. 2014. Predictive Validity of Level 3 Qualifications: Extended Project, Cambridge Pre-U, International Baccalauréate, BTEC Diploma. Cambridge, UK: Cambridge Assessment.
- Hastings, J. (2023) “The Influence of Academic and Social Factors on Degree Attainment in Bsc Sport and Exercise Science.” [ online] EdD thesis or dissertation
- Hatt, S., and A. Baxter. 2003. “From Fe to He: Studies in Transition: A Comparison of Students Entering Higher Education with Academic and Vocational Qualifications.” Widening Participation and Lifelong Learning 5 (2): 18–29.
- Hayward, G., and M. Hoelscher. 2011. “The Use of Large-Scale Administrative Data Sets to Monitor Progression from Vocational Education and Training into Higher Education in the UK: Possibilities and Methodological Challenges.” Research in Comparative and International Education 6 (3): 316–329. https://doi.org/10.2304/rcie.2011.6.3.316.
- HEFCE (2003) “Schooling Effects on Higher Education Achievement. Issues Paper.” Bristol: Higher Education Funding Council for England. Accessed September 1st, 2020. https://dera.ioe.ac.uk/5452/1/05_09.pdf.
- HEFCE (2013) “Trends in Young Participation.” [ online]. Accessed November 6th, 2017. https://mmpt.pasca.ugm.ac.id/downloads/140106080005young%20participation.pdf.
- HEFCE (2014) “Differences in Degree Outcomes: Key Findings.” [ online] Accessed November 6th, 2017. http://dera.ioe.ac.uk/19811/1/HEFCE2014_03.pdf.
- HEFCE (2015) “Differences in Degree Outcomes: The Effect of Subject and Student Characteristics.” [ online]. Accessed November 6th, 2017]<http://www.hefce.ac.uk/media/HEFCE,2014/Content/Pubs/2015/201521/HEFCE2015_21.pdf>.
- Hoelscher, M., G. Hayward, H. Ertl, and H. Dunbar-Goddet. 2008. “The Transition from Vocational Education and Training to Higher Education: A Successful Pathway?” Research Papers in Education 23 (2): 139–151. https://doi.org/10.1080/02671520802048679.
- Huntley, T., A. Whitehead, D. Cullinane, S. Nixon, and E. Huntley. 2017. “Investigating Relationships between and within Entry Pathways on a Sport Related Programme and the Degree Outcome Obtained.” Cogent Education 4 (1): 1276665. https://doi.org/10.1080/2331186X.2016.1276665.
- Huws, N., and L. Taylor. 2008. “University Performance of Learners from Vocational versus Traditional Backgrounds in Equine and Animal Studies.” VETNET LLN, the National Lifelong Learning Network for Veterinary and Allied Professionals 1–11.
- Leathwood, C., and M. Hutchings. 2003. “Entry Routes to Higher Education.” In Higher Education and Social Class: Issues of Exclusion and Inclusion, Edited by L. Archer, M. Hutchings, and A. Ross, 137–154. London: RoutledgeFalmer.
- Myhill, D., and S. Morgan. 2019. “Vocational Qualifications, University Access and Widening Participation: Setting the Context.” In Transitions from Vocational Qualifications to Higher Education: Examining Inequalities, Edited by P. a. M. Banerjee., 13–38. Bingley, England: Emerald Publishing.
- Naylor, R., and J. Smith. 2004. “Degree Performance of Economics Students in UK Universities.” Scottish Journal of Political Economy 51 (2): 250–265. https://doi.org/10.1111/j.0036-9292.2004.00305.x.
- Office for Students. 2019. Preparing for Degree Study. https://www.officeforstudents.org.uk/publications/preparing-for-degree-study/
- Peers, I. S., and M. Johnston. 1994. “Influence of Learning Context on the Relationship between A‐Level Attainment and Final Degree Performance: A Meta‐Analytic Review.” British Journal of Educational Psychology 64 (1): 1–18. https://doi.org/10.1111/j.2044-8279.1994.tb01081.x.
- Richardson, J. 2008. “The Attainment of Ethnic Minority Students in UK Higher Education.” Studies in Higher Education 33 (1): 33–48. https://doi.org/10.1080/03075070701794783.
- Rouncefield-Swales, A. 2014. “Vocational Progression to Selecting Universities: Comparisons and Trends 2010-13.” Western Vocational Progression Consortium.
- Schwartz, S. 2004. Fair Admissions to Higher Education: Recommendations for Good Practice. London: Higher Education Steering Group.
- Smith, E., and P. White. 2015. “What Makes a Successful Undergraduate? the Relationship between Student Characteristics, Degree Subject and Academic Success at University.” British Educational Research Journal 41 (4): 686–708. https://doi.org/10.1002/berj.3158.
- Thiele, T., A. Singleton, D. Pope, and D. Stanistreet. 2016. “Predicting Students’ Academic Performance Based on School and Socio-Demographic Characteristics.” Null 41 (8): 1424–1446.
- UCAS (2019) “2019 End of Cycle Report.” [ online]. Accessed September 1st, 2020. <https://www.ucas.com/data-and-analysis/undergraduate-statistics-and-reports/ucas-undergraduate-end-cycle-reports/2019-end-cycle-report>.
- Universities, U. K. 2003. Fair Enough? Wider Access to University by Identifying Potential to Succeed. London: Universities UK.
- Woodfield, R. (2014) “Undergraduate Retention and Attainment Across the Disciplines.” [ online]. Accessed February 6th, 2018. https://www.heacademy.ac.uk/system/files/resources/undergraduate_retention_and_attainment_across_the_disciplines.pdf.