
ABSTRACT
According to the UK’s Health and Safety Executive (HSE), there has been a 36.5% rise in reported cases of work-related stress between 2018/19 and 2019/20, to over 822,000 individual cases. Europe stress-related absence was second only to musculoskeletal disorders, with estimated work-related stress costing European companies 20 billion euros per year and accounted for nearly 60% of lost working days. This paper focuses on the under-researched area of stress among middle leaders in education. While it is widely reported that teachers face high levels of stress, as a result of organisational pressures, there is a paucity of research on middle leaders. This paper considers whether there will be a significant negative relationship between self-reported levels of resilience and self-reported levels of stress amongst 61 middle leaders. The two sets of data were subjected to cross-correlational quantitative analysis to establish the strength of the relationships between each of the six dimensions of resilience on perceived stress. Among the findings, a key result was that the question in the title was answered, namely that high resilience results in low stress in middle leaders in education. However, it was more nuanced than this and there were factors such as levels of peer support and an individual’s perception of their future which did contribute to a reduction in perceived levels of stress. The findings suggest that senior leaders in education have a greater impact on middle leaders’ levels of resilience and perceived levels of stress than they may think.
Introduction
This paper explores how middle leaders in education, that is those who report to a member of the organisation’s senior leadership team (or equivalent), perceive the stress that they encounter and whether resilience or components of resilience help to reduce this.
Work-related stress is a major issue for both individuals and employers. Marcatto et al. (Citation2022) found that in Europe stress-related absence was second only to musculoskeletal disorders, while the EU-OSHA (Citation2014) estimated that work-related stress cost European companies 20 billion euros per year and accounted for nearly 60% of lost working days.
In the United Kingdom (UK), cases of work-related stress increased to over 822,000 cases in 2019/20, an increase of 36.54% on the 2018/19 figure of 602,000 cases (HSE Citation2022) which resulted in 17.9 million days being lost. Indeed, the UK’s Health and Safety Executive (HSE) found that work-related stress has been on an upward trajectory since 2001/02. However, it is unclear whether this is a result of increased prevalence or a willingness to report stress to employers. The Chartered Institute of Personal Development (CIPD) (Citation2020) reported that heavy workload was a significant contributory factor in work-related stress, resulting in record levels of presenteeism (working when unwell) and leavism (using holiday allowances to work).
The focus of this paper is middle leaders in education settings. Lipscombe et al. (Citation2023) suggest that middle leaders operate in an uncomfortable place between teachers and senior leaders or as they put it, at the interface between influence and change. Whilst scholars are in general agreement that a middle leader is a teacher with formal leadership responsibilities, Edward-Groves et al. (2016) and Lipscombe et al. (Citation2023) state that there is little agreement on the significance of their teaching responsibilities in relation to their leadership ones. For example, are they teachers with leadership responsibilities, or leaders who maintain a teaching commitment? Yet, Li et al.’s (Citation2021) study of middle leaders in England does not include teaching as an aspect of the role. This opens up the concept of middle leadership being an individual with formal leadership responsibility situated between the school or college principal (or equivalent) and teachers. For this study, middle leaders were defined as those individuals who report to a member of the organisation’s senior leadership team. This paper does not intend to discuss the responsibilities that form the nature of the role or the considerable variation between sectors and organisational structure (Grice Citation2019; Li et al. Citation2021; Su et al. Citation2019). For example, a middle leader in a small primary school (elementary school) may only line manage one or two staff, in a secondary (high) school, possibly fifteen to twenty staff, depending on the role, whereas in a university department, maybe one hundred plus staff. However, what constitutes a middle leader’s role is not the focus of this paper and is explored in Lambert (Citation2023). What is starting to be highlighted is the contested nature of the middle leadership role. The extent to which individuals are exposed to organisational pressures such as performance measures or external factors such as contracts arising from government funding will to some extent be related to individual context. Likewise, the scope of responsibility will vary significantly. For example, a middle leader in a primary or secondary school may have no budgetary responsibility, compared to those in further or higher education who may have the added complexity of having a budget in which to operate.
It is also important to note that this paper considers work-related stress at a time immediately following the SARS-CoV-2 (commonly called COVID-19) pandemic. A time which has tested the stress and resilience of those individuals working in education. This provides a unique opportunity to consider the extent to which resilience has impacted a level of stress at a time when individuals are experiencing unprecedented challenges. The true impact of COVID-19 is not going to be known for some time. Indeed, the British Academy (Citation2021) is suggesting that it will take a decade before the impact is fully understood. If this research were to be replicated in years to come, would we be able to see the impact of COVID-19 through a decline in levels of resilience as individuals regress to pre-pandemic levels?
While there is an extensive body of literature relating to stress more generally in society and specific occupational areas (Patil Citation2023; Rathi and Kumar Citation2022), there is, however, less research relative to stress in education (Ravalier and Walsh Citation2018) and in particular middle leadership. However, Harris et al. (Citation2019) have suggested that since 2003 there has been a marginal increase in the volume of literature focusing on the role of middle leadership.
To remedy this, the paper will start by providing an overview of conceptual notions of stress and resilience before looking in detail at the extent to which there is a relationship between the two.
Stress, resilience and the middle leader
What is stress?
Stress is a term that is used ubiquitously and as both Quick et al. (Citation2013) and Robinson (Citation2018) note is one of the most widely studied topics in psychology. The aphorism ‘the straw that broke the camel’s back’ encapsulates the essence of stress. Nonetheless, stress is often widely used as a term relating to how individuals and organisations respond to environmental issues. Kahn (Citation1990) states that there is little agreement as to a scientific definition. However, operationally there are agreed definitions relating to the individual elements that comprise stress.
Stress is a positive or negative response to a stimulus, which can be either a physical or psychological stimulus that can be related to a particular context, such as a workplace, or an individual’s experience of, or perceived experience of a situation. Once a stress-inducing stimulus has been experienced, individuals could respond (or feel) in several different ways. These responses result in the release of hormones, primarily adrenaline or noradrenaline. Individuals feel this response through increases in heart rate, respiration, perspiration, disturbed sleep or irregular eating. While these manifestations are the most recognisable, there are psychological responses that are less obvious such as increased levels of anxiety. These responses are typically designed to prepare an individual for a fight-or-flight response.
Not all stress leads to a fight-or-flight response. Some stress can be positive, leading to an improvement in an individual’s performance (Cooper, Dewe, and O’Driscoll Citation2001; Robinson Citation2018). This form of ‘good stress’ is referred to as Eustress, and since 1908 has been expressed as the Yerkes-Dodson law (Bong, Fraser, and Oriot Citation2016). This model shows how an individual’s performance increases with increased stress to an optimum point after which performance levels decrease as stress levels continue to rise. The difficulty with this model is that the optimum level is different for each individual. This is also affected by factors such as susceptibility to stress and fatigue, as well as familiarity with tasks. Yet Cooper, Dewe, and O’Driscoll (Citation2001) argue that the Yerkes-Dodson model is an oversimplification of the complex nature of stress due to not addressing any psychological responses to stress. However, Christian and Lolas (Citation1985) argue that the model remains valid for responses to physical factors, such as heat and cold, but does not adequately explain psychological stress.
One of the major criticisms of existing models of stress is that they reflect only one component of the stress process, either the phenomenon causing the stress or the impact and say little about the process of stress. Thus, conceptualising stress as one-dimensional negates the complexities of the phenomenon. The second criticism is the failure to consider an individual’s response to stress may be moderated by individual differences, for example, personality attributes such as expectations, values and goals, or contextual factors, such as levels of support from families and friends as well as role and status within the organisation. Therefore, what might be perceived as stressful to one individual, may not be to another.
Cooper, Dewe, and O’Driscoll (Citation2001) suggest that work-related stress is not as simple as a correlational relationship between stimulus (stressor) and associated response. Instead, they propose that work-related stress should be viewed as transactional – an ongoing relationship between the individual and their environment. This approach tries to explore the nature of the stressor–response relationship as a dynamic process and not merely a static one as in the response-based model of stress.
The HSE Management Standards (see ) also offer six factors which contribute to workplace stress. These commonly used descriptors allow organisations to identify areas that are causing employees particular stress.
Table 1. HSE (Citation2022) work-related stressors contextualised for educational leaders.
Having explored notions of stress, both in terms of prevalence and work-relatedness, we now need to focus on resilience. As a potential moderating factor, it is vital to understand how it is defined and conceptualised.
Resilience
With its roots found in two bodies of literature: psychological aspects of coping and the physiological aspects of stress (Tusaie and Dyer Citation2004), resilience is often seen as the ability to bend but not break, bounce back, and perhaps even grow in the face of adverse life experiences. However, the APA (Citation2014) states that resilience is focused on developing and maintaining a healthy mental state with Anyan et al. (Citation2020) going on to say that this is crucial for positive development and adaptations throughout life. The study of resilience is seen positively as a way of understanding the factors that may protect or promote a healthy adaptation despite threats, chronic stressors or adverse life situations (Reivich et al. Citation2013). It is important to note that being resilient does not mean that individuals will not experience difficulty or distress. There will be certain factors that may mitigate the level of distress someone feels, making them more resilient than others. However, resilience is not necessarily a personality trait that only some people possess. On the contrary, resilience involves behaviours, thoughts and actions that can be learned and developed. Southwick, Douglas-Palumberi, and Pietrzak (Citation2014) state that while useful, the definition offered by APA (Citation2014) does not reflect the complex nature of resilience, which includes a range of biological, psychological and social factors that interact to determine how individuals respond to distress.
Pietrzak and Southwick (Citation2011) suggest that resilience is often viewed incorrectly, suggesting that it should not be viewed in a dichotomous manner, you either have it or not. Instead, they argue that resilience is more akin to a continuum, with an individual having differing degrees of resilience depending on the domain in which it is viewed. For example, an individual who adapts well in the workplace, thus demonstrating higher levels of resilience, may fail to adapt to the same level in their personal life. Likewise, Kim-Cohen and Turkewitz (Citation2012) state that levels of resilience can change over time; reinforcing the notion that resilience is a learned behaviour.
Ledesma (Citation2014) suggests the principal models of individual resilience are the compensatory model and the challenge model.
Werner and Smith (Citation2001) define compensatory resilience as neutralising the exposure that one might experience to risk, in essence working in opposition to the risk. They argue that the risk factors and the compensatory factors independently contribute to predicting the outcome; ideally, the compensatory factors mitigate or neutralise the risks altogether. However, there is a lack of consensus on what the compensatory factors might be.
The challenge model of resilience assumes that if the factors that cause stress are not too extreme, they can actually prepare an individual for their next challenge. However, Fleming and Ledogar (Citation2008) note that exposure to both low and high levels of stress results in negative outcomes but does not define any thresholds, possibly due to levels of exposure being individual, similar to what is seen with stress.
Ahern et al. (Citation2006) critiqued six different approaches to measuring resilience. Of these six, two, the Adolescent Resilience Scale (ARS) and the Baruth Protective Factors Inventory (BPFI) relied on undergraduate students as their target population. This raises questions, particularly with the BPFI as to its application outside of the population group. Fletcher and Sarkar (Citation2013) point out that most resilience theories are specific to a particular population. For example, adolescents, families or specific occupational groups such as police officers or nurses. Both Richardson (2002) and Fletcher and Sarkar (Citation2013) advocate for greater use of the Resilience Scale for Adults (RSA), due to its ability to be applied to different types of stressors, adversities and life events.
The RSA has been developed as a general model of resilience, structured around the original factors of resilience from a range of existing models. This model (See ) of resilience will be adopted for the remainder of this paper.
Table 2. Summary of Friborg et al. (Citation2006) six domains of resilience.
Methodology
This research employed a cross-sectional approach (Haslam and McGarty Citation2003) which measures the outcome and the exposure to stress of participants at the same time. This was achieved by using an online survey which considered perceived levels of stress and resilience.
Therefore, the design of this research was a correlational analytic study. The two key variables were stress and resilience and in particular, the six domains of resilience (see ).
Sample
The sample size was 62 participants to ensure that there was a statistically valid basis for analysis. In total 66 completed the survey, based on the inclusion criteria of being in a middle leadership role in education and consenting to complete the questionnaire. Four individuals were excluded as they did not meet the aforementioned inclusion criteria. Therefore, in total 62 (n = 62) participants were included in the analysis.
The sample had a greater proportion of females, 43 (69.40%) than male participants, 19 (30.60%). The disparity of females to males in teaching suggests that the number of males in the sample might be too low for valid statistical analysis based on gender, therefore caution is needed when drawing conclusions based solely on gender. This sample is also reflective of the disparity in staffing that the Department for Education identified in their staffing survey (DfE (Citation2022) which showed that across the primary and secondary phases of education, 36.50% of teachers were male. Within further education, 62.00% of middle leaders were female in the 2018/19 data; the last published dataset.
The majority of respondents were in the age range 45–54 years old, 35% as shown in . Higher than that in schools with 27% of staff within the same age category. Whereas in the FE sector, the mean age of staff was 47 years old, although the distribution of staff across age brackets was similar at approximately 12% of staff within each of the aforementioned age categories.
Table 3. Distribution of participant ages.
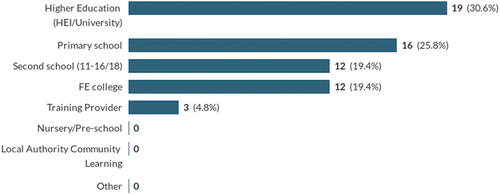
A snowball strategy (Cohen, Manion, and Morrison Citation2003) was used to obtain the sample of participants. The initial group of individuals was identified through professional contacts within further and higher education settings. illustrates the range of educational settings that participants in the sample group worked in, with a third of individuals working within higher education, a quarter in primary schools and the remainder split across secondary schools, further education colleges and independent training providers.
Figure 1. Participant sectors.
Finally, the majority of the participants, 53 (85%) reported coming from a white ethnic group or background. There were five participants (8%) from Asian backgrounds and two who were Chinese (3%). The majority of participants were from white ethnic backgrounds, compared to government data which suggest that 78.5% of the general working-age population were rising to 85.9% of the teaching population (DfE Citation2020). Data from the DfE (Citation2020) look only at the teaching population whereas this study is looking at middle leadership, ethnicity data remain important as Adams et al. (Citation2023) point out that middle leaders are generally recruited from the teaching population, although their study was primarily focused on schools.
Questionnaire
To collect the data, participants were sent an online questionnaire which comprised:
General demographic questions
A general set of questions was used to examine demographic characteristics, such as age, gender and ethnicity. Using Office for the National Statistics (ONS) questions and categories allowed for comparisons and the possibility of modelling data (ONS Citation2021).
HSE management standards indicator tool (HSE-MSIT) (HSE, Citation2008)
A questionnaire consisting of a 35-item, 5-point Likert scale, from strongly disagree to strongly agree, designed to measure the six primary work-related stressors. Marcatto et al. (Citation2022) found evidence that the HSE-MSIT offered significant levels of correlation when measuring work-related stress.
Resilience scale for adults (RSA)
Focuses on the 6-domains of resilience (personal strength/perception of self; personal strength/perception of future; structured style; social competence; family cohesion; social resource). Participants were asked to use a 5-item scale to position themselves between two opposing responses to a given statement. While there is a risk of individuals opting for the middle option, this appears not to be a significant issue as tested in the validated version of the tests (Fribory et al. Citation2005).
The questionnaire was open for 2 months, and reminders were sent to those individuals within the sample group prompting them to complete the questionnaire.
Analysis, findings and discussion
The analysis and discussion section of this paper examines whether there is a relationship between resilience and the perceived level of stress as reported by individuals who work in education. This will be achieved initially by looking at the findings from the stress element of the survey, followed by those of the resilience section of the survey. The discussion would then lead to the relevance of these findings in relation to examining the hypothesis.
provides a visual overview of the analysis that was undertaken on each aspect of the dataset. The diagram shows that the data were split into three strands, the demographic data were used to provide some contextual information, while the other two strands (resilience and stress) provide details of the statistical tests carried out. Within the findings section, each of these texts will be explained and the results discussed.
Figure 2. Overview of analyses conducted.
The results were analysed using the Statistical Package for the Social Sciences (SPSS, version 27.0.1). A linear regression was performed to examine the hypotheses. This would explore the correlation between the overall level of resilience and the level of work-related stress.
Stress findings
The analysis of the results from the stress survey was undertaken using the analysis tool available as part of the HSE-MSIT question set. Overall, male participants had a mean average of 3.31 and females of 3.42. Both sets of scores suggest that sometimes they experience stress within the workplace. An independent-sample t-test was conducted to compare perceived stress levels between male and female participants. There was a significant difference between the scores for male (M = 3.31, SD = .377) and female (M = 3.34, SD = .327) participants; t(30)= −1.120, p = 0.0272. These results suggest that gender does affect the perceived level of stress that individuals experience within the workplace.
However, further analysis was undertaken to visualise the data. provides the averages for each of the elements associated with stress.
Figure 3. Averages by group vs stress domains.
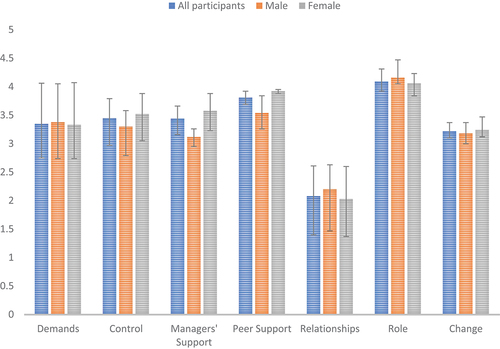
The results presented are on a scale from 1 (Never), 2 (Seldom), 3 (Sometimes), 4 (Often) and 5 (Always). This chart shows that middle leaders are clear about their role with an average score of 4.09 (often), although male respondents report a slightly higher score of 4.16. Within the domain of work relationships, participants scored 2.08, and female participants scored 2.03, which has questions on personal harassment, friction or anger between colleagues, bullying and relationships being strained, and scored lower. This suggests that participants Seldom experience any form of bullying or harassment. This is possible as a result of the emphasis employers place on requiring staff to complete equality and diversity training, which covers the legislation pertaining to protected characteristics and forms of harassment. However, the literature on this is inconclusive. Dobbin and Kalev (Citation2018) and Nathoo (Citation2021) argue that mandatory workplace training has little impact, whereas the NHS England (Citation2023) states that within healthcare equality and diversity training has helped to reduce the number of incidents year on year.
The domain of demands focuses on conflicting workplace demands, unachievable deadlines, having to neglect tasks due to work pressures and an assumption that long hours are the norm. Participants scored on average 3.35, within the Sometimes range, however, males scored slightly more at 3.38 and females less at 3.33. This suggests that sometimes middle leaders’ work causes demands on them, but looking at the scores to individual questions, staff report that they often have to work very intensively to complete their tasks.
The perceived level of support from managers and their peers was particularly interesting. All participants said that they sometimes received support from their managers and their peers. Female participants scored higher in this section, still within the boundary of Sometimes, while peer support was notably higher than that from managers. Suggesting that support was sought from peers more than managers. This raises some interesting questions worthy of subsequent exploration. This includes whether accessibility to peers contributes to perceived increased support, or whether it is more systematic with senior leaders being unable to provide the level of support that participants wanted or expected. Furthermore, are senior leaders through a deficit of skills unable to provide this support, or are so pressured within their role that they do not have sufficient time in the working day to provide this support? Either way, this identifies a line of questioning that needs to be followed up regarding the relationship between the two parties.
Interestingly, the scores relating to change showed that on average participants scored 3.29 (scores ranged from 3.12 to 3.50), which is in the lower half of the Sometimes range. In particular, the questions on being consulted about changes scored particularly low (3.12); however, respondents did feel that they could challenge managers about potential changes. Yet the findings of the change element portray the change in a single dimension. What is neglected is that change is multi-dimensional, in so much as the phenomenon being changed, which the questions in the HSE-MSIT relate to, but also of how change is implemented by managers and the emotional impact it has on individuals. In addition, the impact the change is likely to have on individuals needs to be factored in and is usually considered through Kübler-Ross’s model of change (see Buller Citation2015).
The above scores provide greater insights into the experiences and challenges that middle leaders face in their roles. Particularly around their understanding of the role and the expectations placed on them. This is important as De Nobile (Citation2018) states that middle leadership is under-theorised and ambiguities persist in relation to who the individuals are that occupy these roles and what they do compared to senior leaders and other teaching staff. Additionally, the findings support Bennett et al. (Citation2007) who state that the middle leadership role in education is one of the most demanding due to opposing pressures from senior leaders and teaching staff.
While the above section presented the scores from the survey, it does not tell us whether any of the individual factors were significant in relation to respondents’ overall perceived stress levels. The multiple regression showed that some of the perceived stress factors such as how much control an individual had, or the relationship with colleagues had a greater impact on stress compared to the demands of the role which did not have a significant impact on stress.
A multiple regression was used to determine perceived levels of stress based on individual stressors. The model explained a statistically significant amount of variance in stress, F(7, 54) = 1602.20, p = .001, R2 = .99, R2adjusted = .99. The findings tell us that there are key factors, some of which are in an individual’s control, others less so, that are strong predictors of the perceived level of stress an individual will encounter.
For example, the element of control that an individual had over their job was a significant predictor of overall perceived stress level, β = .36, t(−.95) = 4.79, p = .001. Alongside this, the level of support received from their peers was also a significant predictor of overall perceived stress level, β = −.29, t(−3.21) = −4.22, p = .001. An increase by one in the score of peer support corresponds to a decrease, by −.257, in the perceived levels of stress, B = −.257, 95% CI [−.379, −.135]. Alongside this, the level of support from a manager was a significant predictor of perceived stress level β = .29, t(1.50) = 3.62, p = .001. However, an increase in one in the score of manager’s support corresponds to a slight increase, by .251, in the perceived levels of stress, B = .251, 95% CI [.112, .390]. An individual’s relationship with the other elements has an impact on perceived levels of stress, β = .57, t(14.87) = 5.29, p = .001. Finally, understanding an individual’s role also has a significant impact on stress β = .15, t(4.83) = 6.53, p = .001.
Interestingly, while the demands of the role element were not significant p = .001, it did have a positive impact on the perceived levels of stress. With an increase of one in this score corresponding to a decrease by −.133 in stress, B = −.133, 95% CI [−.210, −.056]. This suggests that while the role may be demanding, clarity of expectations within the role does reduce the level of stress and individual experiences. On the other hand, issues relating to change did not have a significant impact on perceived stress levels, p = .582.
The significance of the aforementioned factors (demands of the role, control over their own, perceived support, responses to change) has not been considered in relation to gender, as the sample population is skewed towards females and as discussed earlier the number of males in the sample is too small to generalise the results relating to male leaders. While this is a limitation of this study, future work could be done to explore these findings with respect to gender. In addition, as already stated, the perceived level of overall stress experienced does not appear to be significantly different based on gender.
Therefore, it could be suggested that there is a level of control over their work, and the interactions individuals have with their peers and managers all have a significant contribution to lessening the level of perceived stress they experience.
Resilience findings
The relationship between perceived workplace stress and resilience was assessed using Pearson’s correlation. The results showed that there was a negative relationship between levels of resilience and perceived stress.
The dataset was inspected to determine whether there were any missing data or extreme values due to input errors. There was one participant with missing data. Therefore, data for this participant were excluded from the analyses, meaning that the total dataset was n = 61.
As predicted, there was a significant negative relationship between these two variables, stress and resilience: r −.377, N = 61, p < .001 (one-tailed). Having found support for the research hypothesis that resilience does help to reduce the perceived level of stress, the next step was to investigate the individual contributions of the six factors of resilience in terms of how they relate to perceived workplace stress.
The Cronbach's Alpha test is used to test the reliability of the data for each of the six domains of resilience. This showed how reliable was the data for each of the six domains of resilience. A score of 0.7 or above is good, with 0.9 being a very good score in terms of how reliable the findings were. We found that most of the scores were reliable; however, perception of an individual’s self was not a reliable indicator of resilience.
Internal consistency was satisfactory for six of the seven measures – ranging from .719 for the measure of Perception of Self to .935 for Perceived Workplace Stress. However, Cronbach’s Alpha for the measure of Structured Style was .574 and the removal of any of the items for this measure reduced the internal consistency; therefore, this measure of resilience was not included in the regression model. In addition, the measure of Perception of Self, which evidenced a low corrected item-total correlation of .284, was removed from this measure. For the measure of the dependent variable of Perceived Workplace Stress, two items also had corrected item-total correlations below .3 (Field Citation2013, 713). Similarly, these items were removed for the regression analysis. The means and standard deviations for each of the measures were computed and are presented in .
Table 4. Minimum and maximum scores, means and standard deviations (SD) for perceived workplace stress and the six factors of resilience (N = 61 for all measures).
This data is important as it provides a level of reliability, so much so that across all respondents, their scores did not deviate significantly from the mean average. Therefore, we can infer that the responses gained were representative of the group.
Correlations
The seven measures of resilience under investigation were then correlated to assess the relationships between them and the perceived levels of stress. Pearson’s correlations and associated p-values are presented in .
Table 5. Pearson’s correlation coefficients and associated p-values for the variable under investigation (N = 61, all tests two-tailed).
Aside from how the six predictor variables related to the criterion variable of workplace stress, it was part of the research to assess possible instances where there was a strong correlation between predictor variables which might be indicative of excessive multicollinearity. As can be seen in the relationship between family cohesion and social resources was .717. A preliminary multiple regression analysis revealed that Variance Inflation Factor values for these two variables were greater than 2.0, indicating a problem with the multicollinearity of predictor variables. Given this issue, the fact that these two variables were highly correlated, and they were both concerned with support, in particular, from outside of the educational setting. It was decided to create a composite variable by combining the items from these two factors. Reliability analysis of this composite yielded a Cronbach’s alpha of .888 and corrected item-total correlations were all above .40. This new variable was given the label ‘Family and Social Support’. The participant mean for this variable was 3.91 (SD = 0.52) with minimum and maximum scores of 2.38–4.54. The relationships between this variable and the remaining original variables are also presented in (item 7).
It can also be seen in that the variable of Structured Style (which also suffered from poor internal consistency) evidenced a weak relationship with both the criterion variable and the other measures of resilience. These findings gave additional support for the decision not to include this variable in the final regression model.
Multiple regression
A multiple regression was used to determine the strength of the effect between the elements of resilience (as shown in ) with the perceived level of stress. As the data will demonstrate, only an individual’s perception of themselves had a significantly strong effect on their stress level. However, there are other factors, which will be demonstrated, that strongly influence perceived stress levels. Senior leaders need to be aware that how they interact with individuals will directly contribute to the notions of perceived stress.
The data was checked to determine whether it satisfied the assumptions for multiple regression analysis. Cook’s D was computed and indicated that there were no multivariate outliers. A histogram indicated that residuals were normal and a scatterplot indicated that there was a linear relationship between the predictor variables and the criterion variable. Finally, Variance Inflation Factor values were satisfactory, with the highest value being 1.67, indicating that there was no excessive multicollinearity between the predictor variables.
The multiple correlations between the four remaining predictor variables measuring resilience and the criterion variable of perceived workplace stress were .482. R2 = .232 and R2adjusted = .177, indicating that 17.7% of the variance in Perceived Workplace Stress was accounted for by these four variables. The standard error of the estimate was 0.55. There was a significant model fit: F (4, 56) = 4.23, p = .005.
The individual contributions of the four predictor variables revealed that only Perception of the Future gave a significant contribution to the model fit: β = −.411, t (56) = 2.94, p = .005. The next strongest predictor was Social Competence (β = −.186, t (56) = 1.23, p = .226), then Perception of Self (β = .105, t (56) = 0.70, p = .488) and finally Social Support (β = −.057, t (56) = 0.40, p = .688). Therefore, when taken individually through Pearson’s correlations, Perception of the Future, Social Competence, and Family and Social Support were significantly related to Perceived Workplace Stress. However, the unique contributions of these variables revealed through multiple regression analysis revealed that only Perception of the Future remained a significant predictor.
The domain of Perception of the Future, which focuses on the extent to which a middle leader has a medium or long-term career plan, or do they take every day as it comes, was a significant predictor in relation to perceived workplace stress. This agrees with the HSE (Citation2008) and Cartwright and Cooper’s (Citation1997) identification of work-related stressors in which both studies identify perceptions of an individual’s role within the organisation and factors relating to personal career development are key factors in determining levels of workplace stress.
Marelich and Piercy (Citation2020) suggest that positive expectancies of the future are a form of dispositional trait based on a model of behavioural self-regulation. They go on to state that having a positive perception of the future is associated with various positive outcomes, including enhanced mental and physical health, survival, mortality and well-being. Cervera-Torres et al. (Citation2021) found in their recent study that resilience and levels of optimism about the future can have a positive impact on how individuals manage stress. However, they caveated this by suggesting that resilience had a greater impact, in their study, on individuals who experienced low levels of stress, whereas, optimism had a greater positive impact on how those experiencing high levels of stress coped. Yet the authors did not define any form of a threshold for low- or high levels of stress. This notion of a positive outlook on the future links well with Werner and Smith’s (Citation2001) compensatory model of resilience which has already been discussed in this paper.
The next most prominent element was that of Social Competence. This is how well individuals find engaging with new people, and whether they need to be with other people or are comfortable with their own company. As before, this element aligns well with that of the HSE (Citation2008) and Cartwright and Cooper (Citation1997) who both state that relationships at work are important, although the findings in this study suggest that relationships with peers are more important than those with managers. This was closely followed by Perception of Self. Interestingly, Cervera-Torres et al. (Citation2021) found that how individuals engage with others depends on the levels of stress experienced. They observed that in general, women who reported higher levels of stress were more likely to engage with those around them. Men, however, showed the opposite pattern, preferring to isolate themselves from others. An important observation in Cervera-Torres et al. (Citation2021) study to note is the intention to self-isolate and the evidence is not sufficient to establish a causal relationship.
The combined domain of family and social support did have a particularly high impact on the stress score. This is particularly interesting given that resilience is not an innate feature of an individual’s personality (UCL Citation2014) and therefore has to be developed primarily within the family, but also through society’s structures, notably schools. The notion of social support refers to the ‘verbal and nonverbal communication between recipients that reduces uncertainty about the situation, the self, the other, or the relationship’ (Albrecht, Adelman, and Albrecht Citation1987, 19).
The results here pose several questions to follow up in further research, regarding the extent to which families are involved in the development of participants’ resilience. An alternative hypothesis could be that individuals do not communicate work-related issues with sufficient meaning to their partners. Carr and Kella (Citation2018) argue that communicated support from a marital partner was particularly important in coping with work-related stress and developing higher levels of resilience.
The data suggest that it is our internal perceptions of ourselves and our future that are the strongest contributors to how workplace stress is managed. This aligns with Bem’s (Citation1967) literature on self-perception theory, where certain situations lead to self-described attitudes that result from an individual’s observations of their behaviour. Holland, Verplanken, and van Knippenberg (Citation2002) state that an individual’s attitude moderates both the extent to which their attitude predicts future behaviours and the extent to which it is impacted by past behaviour, both of which appear to have an impact on the level of workplace stress one experiences.
Conclusion
The findings of this research demonstrated that there is an inverse correlation between high levels of resilience and perceived levels of stress among middle leaders in education. This agrees with previous studies (Friborg et al. Citation2006; Lara-Cabrera et al. Citation2021) that state there is an inverse correlation between high levels of resilience and low levels of work-related stress. This is a holistic view of middle leadership and the relationship between resilience and stress. Yet it is more nuanced than this. The findings of this research demonstrated that an individual’s:
perception of the future,
ability to engage in social situations, either formally or informally (making casual conversation)
support from family and peers
are all key attributes in managing work-related stress. Interestingly, the support from peers featured amongst the work-related stress scores, compared to support from managers. This implies that peer support is possibly valued more than support from senior managers.
It is worthwhile noting that this study was completed towards the end of the COVID-19 pandemic, which resulted in imposed government restrictions on population movement and adaptations to working patterns. The effects of these environmental and organisational restrictions would undoubtedly have tested an individual’s resilience and stress. This means that there is a strong argument for extending this study so that the true impact of COVID-19 can be evaluated, ensuring that there is a more gender-balanced sample to test the validity of the findings.
While the data is statistically valid, further research is needed to determine the extent to which the findings are correlated by sector. Given that most of the participants were from further and higher education, are there any notable differences between these two sectors, or indeed the school sector? Likewise, more work is needed to determine what the stress-causing factors are. While resilience can help to reduce workplace stress, it is a coping mechanism and it is more important to alleviate the causes rather than treat the symptoms.
Disclosure statement
No potential conflict of interest was reported by the author(s).
References
- Adams, L., S. Coburn-Crane, A. Sanders-Earley, R. Keeble, H. Harris, J. Taylor, and B. Taylor. 2023. Working Lives of Teachers and Leaders -Wave 1. https://assets.publishing.service.gov.uk/government/uploads/system/uploads/attachment_data/file/1148571/Working_lives_of_teachers_and_leaders_-_wave_1_-_core_report.pdf.
- Ahern, N. R., E. M. Kiehl, M. Lou Sole, and J. Byers. 2006. “A Review of Instruments Measuring Resilience.” Issues in Comprehensive Pediatric Nursing 29 (2): 103–125. https://doi.org/10.1080/01460860600677643.
- Albrecht, T. L., and M. B. Adelman: T. L. Albrecht. 1987. “Communicating Social Support: A Theoretical Perspective.” In Communicating Social Support, edited by M. B. Adelman, 18–38. Newbury Park, CA: Sage.
- Anyan, F., O. Hjemdal, B. Bizumic, and O. Friborg. 2020. “Measuring Resilience Across Australia and Norway.” European Journal of Psychological Assessment 36 (2): 280–288. https://doi.org/10.1027/1015-5759/a000509.
- APA (American Psychological Association). 2014. The Road to Resilience, Washington, DC: American Psychological Association. http://www.apa.org/helpcenter/road-resilience.aspx.
- Bem, D. J. 1967. “Self-Perception: An Alternative Interpretation of Cognitive Dissonance Phenomena.” Psychological Review 74 (3): 183–200. https://doi.org/10.1037/h0024835.
- Bennett, N., P. Woods, C. Wise, and W. Newton. 2007. “Understandings of Middle Leadership in Secondary Schools: A Review of Empirical Research.” School Leadership & Management 27 (5): 453–470. https://doi.org/10.1080/13632430701606137.
- Bong, C. L., K. Fraser, and D. Oriot. 2016. “Cognitive Load and Stress in Simulation.” In Comprehensive Healthcare Simulation: Paediatrics, edited by V. J. Grant and A. Cheng, 3–17. Cham: Springer International Publishing.
- The British Academy. 2021. The COVID Decade: Understanding the Long-Term Societal Impacts of COVID-19. The British Academy. https://www.thebritishacademy.ac.uk/publications/covid-decade-understanding-the-long-term-societal-impacts-of-covid-19/.
- Buller, J. L. 2015. “The Only Thing We Have to Change Is—Change Itself.” Change Leadership in Higher Education: A Practical Guide to Academic Transformation: 1–27.
- Carr K., and J. K. Kellas. 2018. “The Role of Family and Marital Communication in Developing Resilience to Family-of-Origin Adversity.“ Journal of Family Communication 18 (1): 68–84. https://doi.org/10.1080/15267431.2017.1369415.
- Cartwright, S., and C. Cooper. 1997. Managing Work-Place Stress. CA: Sage.
- Cervera-Torres, S., S. Ruiz-Fernández, H. Godbersen, L. Massó, D. Martínez-Rubio, S. Pintado-Cucarella, and R. M. Baños. 2021. “Influence of Resilience and Optimism on Distress and Intention to Self-Isolate: Contrasting Lower and Higher COVID-19 Illness Risk Samples from an Extended Health Belief Model.” Frontiers in Psychology 12:662395. https://doi.org/10.3389/fpsyg.2021.662395.
- Chartered Institute of Personnel and Development. 2020. Health and Wellbeing at Work 2022. London: CIPD.
- Christian, P., and F. Lolas. 1985. Social Science & Medicine. CA: Sage. https://doi.org/10.4135/9781452231235.
- Cohen, L., L. Manion, and K. Morrison. 2003. Research Methods in Education. London: Routledge Farmer.
- Cooper, C. L., P. J. Dewe, and M. P. O’Driscoll. 2001. What is stress? In Organizational Stress: A Review and Critique of Theory, Research, and Applications, 1–26. SAGE Publications, Inc. https://doi.org/10.4135/9781452231235.n1.
- Corbett, S. 2017. “From Teacher to Manager: Expectations and Challenge in the Further Education Sector. a Relationship Model.” Research in Post-Compulsory Education 22 (2): 208–220. http://doi.org/10.1080/13596748.2017.1314680.
- De Nobile, J. 2018. “Towards a Theoretical Model of Middle Leadership in Schools.” School Leadership & Management 38 (94): 395–416. https://doi.org/10.1080/13632434.2017.1411902.
- Department of Education (DfE). 2020. “School Teacher Workforce.” Reporting Year 2020. https://www.ethnicity-facts-figures.service.gov.uk/workforce-and-business/workforce-diversity/school-teacher-workforce/latest#data-sources.
- Department of Education (DfE). 2022. “Education and Training Statistics for the UK.” Reporting Year 2021https://www.gov.uk/government/publications/standards-for-official-statistics-published-by-the-department-for-education.
- Dobbin, F., and A. Kalev. 2018. “Why Doesn’t Diversity Training Work? The Challenge for Industry and Academia.” Anthropology Now 10 (2): 48–55. https://doi.org/10.1080/19428200.2018.1493182.
- EU-OSHA. 2014. Calculating the Cost of Work-Related Stress and Psychosocial Risks. Publications Office of the European Union. https://doi.org/10.2802/20493.
- Field, A. 2013. Discovering Statistics Using IBM SPSS Statistics: And Sex and Drugs and Rock “N” Roll. 4th ed. Los Angeles, London, New Delhi: Sage.
- Fleming, J., and R. J. Ledogar. 2008. “Resilience, an Evolving Concept: A Review of Literature Relevant to Aboriginal Research.” Pimatisiwin 6 (2): 7–23.
- Fletcher, D., and M. Sarkar. 2013. “Psychological Resilience: A Review and Critique of Definitions, Concepts, and Theory.” European Psychologist 18 (1): 12–23. https://doi.org/10.1027/1016-9040/a000124.
- Friborg, O., O. Hjemdal, J. H. Rosenvinge, M. Martinussen, P. M. Aslaksen, and M. A. Flaten. 2006. “Resilience as a Moderator of Pain and Stress.” Journal of Psychosomatic Research 61 (2): 213–219. https://doi.org/10.1016/j.jpsychores.2005.12.007.
- Fribory, O., D. Barlaug, M. Martinussen, J. H. Rosenvinge, and O. Hjemdal. 2005. “Resilience in Relation to Personality and Intelligence.” International Journal of Methods in Psychiatric Research 14 (1): 29–42. https://doi.org/10.1002/mpr.15.
- Grice, C. 2019. “Leading Pedagogical Reform.” International Journal of Leadership in Education 22 (3): 355–370. https://doi.org/10.1080/13603124.2018.1463462.
- Harris, A., M. Jones, N. Ismail, and D. Nguyen. 2019. “Middle Leaders and Middle Leadership in Schools: Exploring the Knowledge Base (2003–2017).” School Leadership & Management 39 (3–4): 255–277. https://doi.org/10.1080/13632434.2019.1578738.
- Haslam, S. A., and C. McGarty. 2003. Research Method and Statistics in Psychology. London: Sage.
- Holland, R. W., B. Verplanken, and A. van Knippenberg. 2002. “On the Nature of Attitude–Behavior Relations: The Strong Guide, the Weak Follow.” European Journal of Social Psychology 32 (6): 869–876. https://doi.org/10.1002/ejsp.135.
- HSE (Health and Safety Executive). 2008. HSE Management Standards Indicator Tool. Bootle: HSE.
- HSE (Health and Safety Executive). 2022. “Working Days Lost in Great Britain. https://www.hse.gov.uk/statistics/dayslost.htm.
- Kahn, R. L., D. M. Wolfe, R. P. Quinn, J. D. Snoek, and R. A. Rosenthal. 1964. Organizational Stress: Studies in Role Conflict and Ambiguity. John Wiley.
- Kahn W. A. 1990. “Psychological Conditions of Personal Engagement and Disengagement at Work.“ AMJ 33 (4): 692–724. https://doi.org/10.5465/256287
- Kim-Cohen, J., and R. Turkewitz. 2012. “Resilience and Measured Gene–Environment Interactions.” Development & Psychopathology 24 (4): 1297–1306. https://doi.org/10.1017/S0954579412000715.
- Lambert, S. 2020. “Emotional Awareness Amongst Middle Leadership.” JWAM 12 (2): 233–243. http://doi.org/10.1108/JWAM-02-2020-0009.
- Lambert, S. 2023. “Factors Influencing Perceived Stress in Middle Leaders of Education.” Management in Education. https://doi.org/10.1177/08920206231189844.
- Lara-Cabrera, M. L., M. Betancort, C. A. Muñoz-Rubilar, N. Rodríguez Novo, and C. De las Cuevas. 2021. “The Mediating Role of Resilience in the Relationship Between Perceived Stress and Mental Health.” International Journal of Environmental Research & Public Health 18 (18): 9762. https://doi.org/10.3390/ijerph18189762.
- Ledesma J. 2014. “Conceptual Frameworks and Research Models on Resilience in Leadership.” SAGE Open 4 (3): 215824401454546. https://doi.org/10.1177/2158244014545464.
- Li, S. C., A. Y. K. Poon, T. K. H. Lai, and S. T. C. Tam. 2021. “Does Middle Leadership Matter? Evidence from a Study of System-Wide Reform on English Language Curriculum.” International Journal of Leadership in Education 24 (2): 226–243. https://doi.org/10.1080/13603124.2018.1529823.
- Lipscombe, K., S. Tindall-Ford, and J. Lamanna. 2023. “School Middle Leadership: A Systematic Review.” Educational Management Administration & Leadership 51 (2): 270–288. https://doi.org/10.1177/1741143220983328.
- Lynch, K., B. Grummell, and D. Devine. 2012. New Managerialism in Education Commercialization, Carelessness and Gender. London: Palgrave Macmillan.
- Marcatto, F., L. Di Blas, O. Luis, S. Festa, and D. Ferrante. 2022. “The Perceived Occupational Stress Scale: A Brief Tool for Measuring workers’ Perceptions of Stress at Work.” European Journal of Psychological Assessment38 (4): 293–306. https://doi.org/10.1027/1015-5759/a000677.
- Marelich, W. D., and B. Piercy. 2020. “Optimism/Pessimism Carver and Scheier Theory.” The Wiley Encyclopedia of Personality and Individual Differences: Models and Theories 299–303.
- McLeod, S. 2007. “Maslow’s hierarchy of needs.“ Simply psychology 1:1–18.
- Nathoo, Z. 2021 June 17. “Why Ineffective Diversity Training won’t Go Away.” https://www.bbc.com/worklife/article/20210614-why-ineffective-diversity-training-wont-go-away.
- NHS England. 2023 June 8. “NHS England» NHS Equality, Diversity, and Inclusion Improvement Plan.” https://www.england.nhs.uk/long-read/nhs-equality-diversity-and-inclusion-improvement-plan/.
- ONS (Office for National Statistics). 2021. “Demography Question Development for Census 2021. https://www.ons.gov.uk/census/censustransformationprogramme/questiondevelopment/demographyquestiondevelopmentforcensus2021.
- Patil, S. 2023. “Work Place Stress Among Employees: A Literature Review.” https://presidencyuniversity.in/wp-content/uploads/2023/08/8.Work-Place-Stress-Literature-Review.pdf.
- Pietrzak, R. H., and S. M. Southwick. 2011. “Psychological Resilience in OEF-OIF Veterans: Application of a Novel Classification Approach and Examination of Demographic and Psychosocial Correlates.” Journal of Affective Disorders 133 (3): 560–568. https://doi.org/10.1016/j.jad.2011.04.028.
- Quick, J. C., T. A. Wright, J. A. Adkins, D. L. Nelson, and J. D. Quick. 2013. Preventive Stress Management in Organizations. 2nd ed. Washington, DC, US: American Psychological Association.
- Rathi, S., and P. Kumar. 2022. “Job Stress: A Systematic Literature Review.” International Journal of Health Sciences 6 (S6): 6204–6222. https://doi.org/10.53730/ijhs.v6nS6.10971.
- Ravalier, J. M., and J. Walsh. 2018. “Working Conditions and Stress in the English Education System.” Occupational Medicine 68 (2): 129–134. https://doi.org/10.1093/occmed/kqy017.
- Reivich, K., J. E. Gillham, T. M. Chaplin, and M. E. Seligman. 2013. “From Helplessness to Optimism: The Role of Resilience in Treating and Preventing Depression in Youth.” In Handbook of Resilience in Children, edited by S. Goldstein and R. B. Brooks, 201–214. New York, NY: Springer. https://doi.org/10.1007/978-1-4614-3661-4_12.
- Robinson, A. M. 2018. “Let’s Talk About Stress: History of Stress Research.” Review of General Psychology 22 (3): 334–342. https://doi.org/10.1037/gpr0000137.
- Southwick, S. M., H. Douglas-Palumberi, and R. H. Pietrzak. 2014. “Resilience.” In Handbook of PTSD: Science and Practice, edited by M. J Friedman, P. A Resick, and T. M Keane, 590–606. 2nd ed. New York: Guilford Press.
- Su, R., L. Tay, H. Liao, Q. Zhang, and J. Rounds. 2019. “Toward a Dimensional Model of Vocational Interests.” Journal of Applied Psychology 104 (5): 690–714. https://doi.org/10.1037/apl0000373.
- Tusaie, K., and J. Dyer. 2004. “Resilience: A Historical Review of the Construct.” Holistic Nursing Practice 18 (1): 3–8. https://doi.org/10.1097/00004650-200401000-00002.
- UCL (University College London). 2014. Local Action on Health Inequalities: Building Children and Young people’s Resilience in Schools. London: Public Health England.
- Werner, E. E., and R. S. Smith. 2001. Journeys from childhood to midlife: Risk, resilience, and recovery. Cornell University Press.