
Abstract
The COVID-19 pandemic is transforming the global labour market, including the Australian archaeological profession. This, the fourth in a series of comprehensive surveys of Australian professional archaeologists undertaken in early 2020, provides longitudinal data on trends in the state of the archaeological profession in Australia. Findings include the early impacts of COVID-19. Headline results show a young (average age 42 years), well-qualified (92% holding an Honours degree or higher), well-renumerated (average salary AUD102,430) workforce focused on Indigenous archaeology (65%), working in the private sector (60%), and predominantly based on the eastern seaboard (78%). Longitudinal data show an expanding archaeological industry in Victoria and a softening of demand in all other states and territories, particularly Western Australia. Sex and age data show a profession dominated by females (58%) with increasing numbers of young females in the career pipeline (average age of males 46 years and females 40 years). Indigenous participation rates in professional archaeology remain low (1.9%). The impact of COVID-19 had a considerable effect on confidence in stability or growth in the coming year, with a slump of 15% across the profession after the declaration of the pandemic. But confidence remained positive at 58% overall. Data show slowing wages growth (6.5% over 5 years compared to the national average of 11.4%) and a continuing profound gender pay gap of 18.8%, or on average males taking home $17,800 more than females.
Introduction
The 5-yearly Australian Archaeology in Profile: A Survey of Working Archaeologists (aka Profiling the Profession) surveys provide unique insights into longitudinal trends in the archaeological profession practised in Australia and practised overseas by Australian-based archaeologists. Since 2005, the surveys have charted changing professional employment conditions and workplaces, access and participation rates, skill gaps and industry confidence. At the same time, the summative reports of survey findings (Mate and Ulm Citation2016; Ulm et al. Citation2005, Citation2013) have aimed to assess how survey responses reflect the changing context in which professional archaeologists operate, such as the impacts of changing legislation and regulatory frameworks, oscillating growth and contraction in the resources and urban construction sectors, and broader labour market trends.
This long-term survey has contributed to a growing international suite of surveys of the archaeological profession across Europe, Asia, and the Americas (Aitchison Citation2013; Aitchison and Edwards Citation2003, Citation2008; Aitchison and Rocks-Macqueen Citation2013, Citation2020; Gaspar et al. Citation2020; Lazar et al. Citation2014; Tan Citation2019; Zeder Citation1997; Zorzin Citation2010). The outcomes of previous Profiling the Profession surveys in Australia have informed teaching and learning practice and university course design (Fairbairn et al. Citation2013; Wallis et al. Citation2013), contributed to the development of The Australian Archaeology Skills Passport (ANCATL et al. Citation2021) and national benchmarking of archaeology degrees (Beck et al. Citation2020), supported survey designs for the archaeological profession in other countries (Tan Citation2019), and underpinned debate about the practice and professionalisation of archaeology (Wallis Citation2020), particularly the participation of Aboriginal and Torres Strait Islander people in the profession (Costello Citation2021; Wilson Citation2014).
In the five years since the last Profiling the Profession survey in 2015, the landscape of the archaeological profession and archaeological workplaces across Australia have continued to change. The growth of the discipline and the volatility of the resources sector, paired with an increase in urban and infrastructure development, have continued to shape the nature of the work undertaken and the availability of employment. This fourth survey provides longitudinal data, with an attendant ability to demonstrate trends in demographic profile, employment stability, qualifications, and teaching and learning practices.
The survey was deployed across a period of major global disruption due to the COVID-19 pandemic, providing a unique opportunity to create a benchmark of where the Australian archaeological profession was immediately before the pandemic and to explore the early impacts of the pandemic on sector confidence.
Methods
The fourth survey in the Profiling the Profession series adds to data acquired in 2015 (Mate and Ulm Citation2016), 2010 (Ulm et al. Citation2013), and 2005 (Ulm et al. Citation2005). This long-running survey allows an increasing focus on longitudinal analysis. The survey was once again carried out under the auspices of the Australian National Committee for Archaeology Teaching and Learning (ANCATL), a subcommittee of the Australian Archaeological Association Inc. (AAA), which includes representatives from Australian universities teaching archaeology, professional associations, Indigenous groups, industry groups, and public sector employers.
The survey instrument comprised four parts: demographic profile (20 questions); employment information (14 questions); professional activities (12 questions); and learning and training issues (5 questions) as well as an open comments field. The full survey instrument is included in the Supplemental Material. As the aim of the survey was to continue building a profile of professional archaeology in Australia, eligibility to complete the survey was limited to anyone who:
used archaeological skills in paid employment during the calendar year preceding the survey (i.e. 2019); and
worked in Australia, or was based in Australia and worked overseas.
In the 2020 survey, some minor changes to the survey instrument were made, but these were designed to ensure backwards compatibility with responses from previous surveys to allow longitudinal analysis:
In response to comments in the previous survey that it was too long and might deter respondents, we split the survey into two sections. The first comprised questions on demographic profile, employment information, and professional activities. The second optional section comprised questions on learning and training issues. All respondents had access to a final open comments field.
Six additional salary brackets were added to the question on income (‘$190,000 or greater’ was expanded in $10,000 increments to ‘$250,000 and greater’) to capture detail on higher salary brackets, as data from 2015 indicated the aggregation of salaries over $190,000 concealed the range of higher salaries earned.
Answers to the question on ‘What is your sex?’ were expanded to be more inclusive, adding options for ‘None of the above’ and ‘Rather not say’.
We replaced closed tick box responses with drop-down selections for four larger questions to make the survey less cluttered and quicker to complete.
In developing the 2020 survey instrument we consulted with a broad range of stakeholders, including members of ANCATL and the executives of the AAA, Australasian Society for Historical Archaeology Inc. (ASHA), Australasian Institute for Maritime Archaeology Inc. (AIMA), Australian Association of Consulting Archaeologists Inc. (AACAI) and Australian Indigenous Archaeologists' Association (AIAA). This consultation phase resulted in two additional minor changes:
We added a new question about specifying interests in professional development topics (‘What type of professional development courses would you be interested in participating in the next year?’).
We added a new subquestion to the Likert scale statements on Teaching and Courses on non-university learning opportunities (‘Outside of universities there is a need for vocationally-based learning opportunities in archaeology’).
This study was approved by the James Cook University (JCU) Human Research Ethics Committee (Ethics Approval Number H7938). The final survey was vetted and tested by members of ANCATL before deployment. SurveyMonkey® was used to gather survey responses. The survey was launched on 13 January 2020 and closed on 1 May 2020.
With the cooperation of the major archaeological associations in Australia, the online survey was distributed using the listservers and social media channels of the AAA, ASHA, AIMA, AACAI, and AIAA. In addition, the survey was widely promoted on major archaeology listservers and social media platforms.
Results
The 2020 survey received 603 responses. Nineteen responses were removed as they did not meet the primary conditions of employment (i.e. they did not earn income from archaeology in 2019), or because of non-completion of mandatory questions (answering questions on age, sex and qualification were taken as indicative of completion of the survey, if no other questions were answered). Overall the final number of responses (n = 584) was much higher than in previous surveys (2015 n = 355; 2010 n = 399; 2005 n = 301) (). The response drop-out throughout the first section of the survey was 8.7% from beginning to end. Overall 88% of respondents who reached the end of the first section elected to complete the optional second section dedicated to skills analysis and teaching and learning. Responses also included a range of qualitative comments (5,669 words, n = 122), mostly focused on professional standards, graduate skill levels, industry accreditation, systemic racism, collaborating with Indigenous communities and employment security.
Table 1. Survey response rates versus the estimated number of archaeologists, 2005–2020.
The survey was deployed across a period of major global disruption with the declaration of the COVID-19 pandemic on 11 March 2020. A total of 488 responses were collected before the pandemic declaration and 96 afterwards, allowing a unique opportunity to explore changing attitudes around sector confidence through examination in particular of the questions around the number of archaeological staff in respondents’ workplaces, and any changes in employment numbers expected. The post-COVID-19 pandemic declaration lockdowns may have increased participation from people who would otherwise have been engaged with fieldwork.
The demographics of Australian archaeologists
Ordinary association membership of the major Australian archaeological associations (i.e. not a student or institutional membership category) was used in combination with survey data to estimate the current size of the archaeological profession. The combined membership of the four peak associations in the survey census year of 2019 was reported at 1,139 members (608 members of AAA, 278 of ASHA, 163 of AACAI, 90 of AIMA).
This number was then adjusted proportionally using information from the survey. Overall 64% of respondents were a member of at least one of the four major associations. Some respondents held memberships of more than one of the four major associations—21.4% were members of two, and 4.1% were members of three or all four of them, resulting in an overestimate of 49% of the size of the profession. Accounting for this reduced the estimate to 770. However, 36% of respondents were not members of any of the 4 major associations. So, increasing 770 by 36% gave an estimate of 1,040. Taking this approach to estimating the number of archaeologists in Australia (which follows the approach used in the last two surveys), the estimated number of archaeologists in Australia has increased by c.41.5% since 2015.
It should also be noted that membership of an archaeological association does not necessarily equate with eligibility to complete the survey. Members may not have earned a salary in archaeology in the census year, may be retired but not self-identifying as a concessional member, or may have earned a salary in a job which they did not regard as using their archaeological skills. Thus the calculated response rate may be artificially low due to a potential overestimation of the gross number of working archaeologists.
Age and sex profile
Overall, the average age for the discipline has changed little over the last 15 years. While the 2020 survey results show the highest average age since the survey began—42.3 years old ()—this is a net change of less than one year over the four surveys. The average age of males has increased from 42.5 years in 2005 to 46.3 in 2020, while the average age of females has been stable and lower than that of males, decreasing from 41.4 years in 2005 to 40.1 in 2020. It also shows in the differences between the median age range for males (46–50) and that for females (36–40), which is fully 10 years younger. The lower average and median age of females could be influenced by an overall increase in younger females entering the discipline, and also personal circumstances such as the relative proportion of females leaving the profession earlier with family responsibilities or pursuing careers outside of archaeology that provide a different work-life balance.
Table 2. The average age of respondents in all four surveys, 2005–2020.
Previous surveys have indicated a trend towards a younger discipline. Results from 2020 indicate 60.9% of respondents are aged 45 years and under (). The greater proportion of females under 45 appears to be a direct reflection of the ongoing changing profile of our profession. The demographic profile of females and males shows increasingly more females in younger age groups. In 2020, females dominate all but one age group up to 51–55 years old, while males dominate in age groups of 56 and above (). This profile has changed considerably across the four surveys (). In comparison, in 2005 males dominated all age groups except 16–25. This distribution also reflects observable differences in the composition of enrolments in university courses in archaeology and more broadly, with more females than males enrolled in higher education (Norton et al. Citation2018).
Figure 1. Respondents by age and sex, 2020 (n = 555).
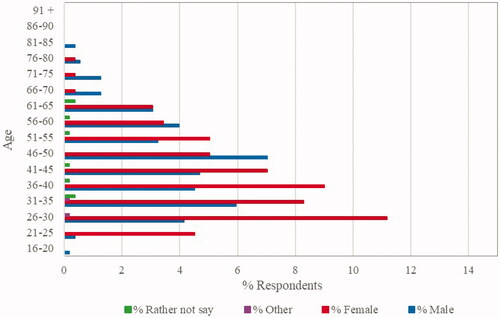
Figure 2. Demographic profile by sex/age, 2005–2020. Note that 1.7% of respondents (n = 10) in 2020 who responded ‘None of the above’ and ‘Rather not say’ to the sex question are included in the overall average but not the results analysed by sex owing to the small sample size, and to aid comparison across surveys.
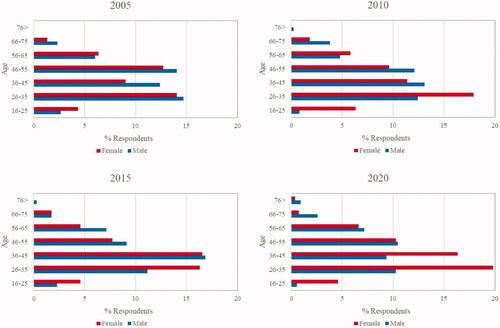
Table 3. The proportion of respondents under 45, by sex across four surveys.
In the 2020 survey, the previously noted trend towards more females in the sector overall in comparison to the number of males increased markedly (, ). There are now 16.8% more females in the archaeological workplace than males (female 58.4% vs male 41.6%) in Australia. This trend has been observable in surveys in other countries, including several European countries (Lazar et al. Citation2014) and Canada (Jalbert Citation2019), but it is still in direct contrast to the United Kingdom (e.g. Aitchison and Rocks-Macqueen Citation2013:93) and America (Altschul and Patterson Citation2010). The greater representation of females across the profession in Australia is influenced by the continuing flow-through of a larger proportion of females in younger age groups. The demographic profile, showing a dip in the employment of women after 30 (), also matches population-wide employment trends reported by the Australian Bureau of Statistics who note a distinctive drop in employment for women around 30 years of age (ABS Citation2021).
Figure 3. Changing proportion through time of males and females in the archaeological profession, 2005–2020. Note that 1.7% of respondents (n = 10) in 2020 who responded ‘None of the above’ and ‘Rather not say’ to the sex question are not included here owing to the small sample size.
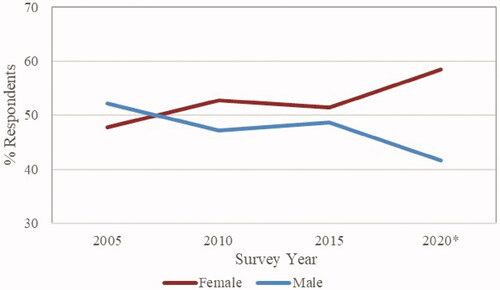
Table 4. The proportion of males and females in the discipline by survey year, 2005–2020.
Indigenous participation
Indigenous participation rates in professional archaeology as reported by previous surveys have been highly variable, but remain at low levels, ranging from 1.9% in 2020 to 2.8% in 2015. The number of respondents identifying as Indigenous in the 2020 survey is lower than the proportion of Aboriginal and Torres Strait Islander people in the broader Australian population, measured at 3.3% in the 2016 census data (ABS Citation2018).
International linkages and participation
Another changing demographic is the proportion of Australian-born to non-Australian-born archaeologists working in and from Australia. When we began the survey we were especially interested in the proportion of non-Australians in the older age groups, representing the international beginnings of archaeology in Australia, including Australian archaeologists who were trained overseas. Over the first three surveys we saw a falling off of the proportion of overseas-born archaeologists, however, that reduction has plateaued over the last five years (, ). In previous surveys, overseas-born archaeologists dominated some age groups, particularly in the older age ranges. In 2020, as for 2015, Australian-born archaeologists predominate in all age groups (except for 76–85 in 2020). In 2020 there has been, however, a marked increase in representation of overseas-born archaeologists in the 26–35 age group, anecdotally attributed to more young professionals pursuing careers in Australia. Of the 26.6% non-Australian born archaeologists, 76.7% are qualified at postgraduate level and above (compared to 60% across the board—see below), 32% work in universities (higher than the survey average of 24%—see below), and 52% work in the private sector. These data emphasise a high level of imported expertise, but also may be attributable to better employment opportunities and remuneration in Australia compared to other countries. Overall, 53.2% of archaeologists born outside of Australia come from the UK, and a further 18.3% come from the USA, with New Zealand-born archaeologists the third-largest representation (13.8%). In comparison, Aitchison and Rocks-Macqueen (Citation2020) report that only 14% of archaeologists practising in Britain are from outside the UK, 11% from the European Union.
Figure 4. Changing proportion of Australian-born and non-Australian-born archaeologists by survey year, 2005–2020.
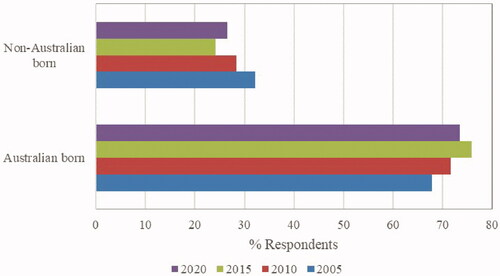
Figure 5. Age profile for Australian-born vs. non-Australian-born archaeologists in 2005 (n = 299); 2010 (n = 399); 2015 (n = 352); and 2020 (n = 554).
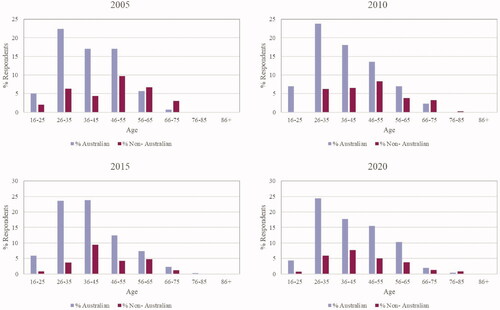
Table 5. The proportion of Australian-born and non-Australian-born archaeologists through time, 2005–2020.
Working in archaeology
Like the demographic profile of the profession, the archaeological workplace has changed in the last 15 years. From a starting point in 2005 of relatively recent professionalisation, to a dynamic and impactful workforce (albeit still making up only a very small proportion of the adult labour market in Australia), archaeology in Australia is recognised as a growth industry with very high skill levels—defined as 5+ years training or experience, or a Bachelor Degree or higher (National Skills Commission Citation2021a)—and strong future demand (National Skills Commission Citation2021c). Successive Profiling the Profession surveys have highlighted just this context, and provide a fine-grained picture of where and how archaeologists are employed.
Australian archaeologists are employed across the world. While for the most part archaeologists based in Australia work in Australia (98.3% of survey respondents are based in Australia and of those 88.5% work predominantly in Australia), the next three most regular regions people worked were Europe, Asia, and the Pacific. Those working in Australia remain predominantly based on the eastern seaboard with New South Wales (NSW), Victoria (VIC), Queensland (QLD) and Australian Capital Territory (ACT) accounting for 78.2% of respondents, while 73.9% of respondents work on the eastern seaboard. Longitudinal data show some movement in where archaeologists are based and where they work. In 2020 more archaeologists lived in VIC and NSW than any other state () and VIC and NSW also represented the states where the most work was undertaken (). Those data show that this balance is different from previous surveys, with higher proportions of people living and working in QLD and Western Australia (WA) in 2015. The decline of work in WA is likely to be correlated with the historically low iron ore price between 2015 and 2019. Work in WA is likely to have rebounded after the survey period with the twin influences of a rebounding iron ore price and the ramifications of the destruction of archaeological sites at Juukan Gorge engendering greater investments in cultural heritage management by major miners (Koolmatrie Citation2020). In Queensland, the resources sector has been through a period of relative downturn between the 2015 and 2020 surveys (Queensland Resources Council Citation2019). In previous surveys, it has been reported that larger proportions of NSW and VIC archaeologists work in historical archaeology, while in QLD and WA, those working in Indigenous archaeology predominate. In the 2020 survey the highest proportion of historical archaeologists was represented in NSW (49.1%) followed by VIC (25.4%). For Indigenous archaeology, VIC is again the location of the highest proportion of work (32.5%—i.e. 32.5% of people working in Indigenous archaeology in Australia primarily work in Victoria), followed by WA (20.4%), NSW (21.5%), and then QLD (16.5%).
Table 6. State in which archaeologists are based, 2005–2020.
Table 7. State in which archaeologists undertake work, 2010–2020.*
The vast majority of archaeologists (74%) remain based in capital cities. Over time this has ranged from a minimum of 72% in 2015 up to 78% in 2010, while regional centres have similarly ranged from 14% in 2010 and 2020, up to 19% in 2015. Only 10% of respondents in 2020 live in rural areas and 2% are based remotely.
Subject focus
The longitudinal data show decreasing participation rates from historical and maritime archaeologists and increasing participation in Indigenous archaeology, with relatively static participation from Classical archaeologists (). The ‘Other’ category comprises professionals with particular focus areas and methods (e.g. archaeological science, heritage and planning, prehistorical archaeology). Indigenous archaeology and historical archaeology remain the two most populous subject areas.
Figure 6. The longitudinal trend in primary subject focus, 2005–2020.
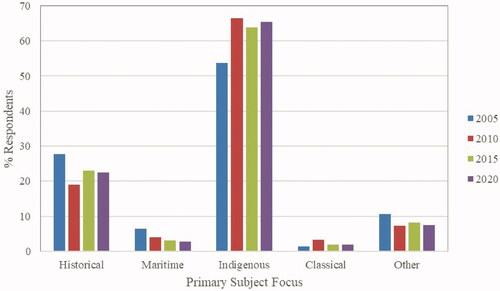
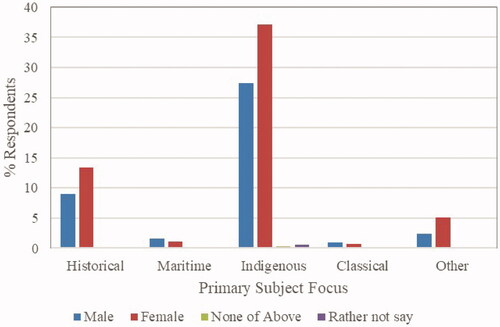
Across the profession as a whole, 65.4% of all respondents identified Indigenous archaeology as their primary subject focus (). This is a slight increase since 2015 when 63.9% of respondents worked in Indigenous archaeology. A further 16.6% of respondents active in other subject foci indicated they were also active in Indigenous archaeology, representing in total 81% of the discipline. Overall, more females than males primarily work in Indigenous archaeology, a marked change from the last survey (in 2015, 31% of respondents were females working in Indigenous archaeology, and 33% were males; in comparison in 2020, 37.1% of respondents were females in Indigenous archaeology and 27.4% were males). In historical archaeology, there remain proportionally more females. Once again, Classical archaeology appears to be under-represented in the survey as only 10 respondents identified this as their primary subject focus, with a further 21 respondents reporting working in that subdiscipline some of the time.
Figure 7. Distribution of respondents by primary subject focus and sex, 2020 (n = 547).
Workplace confidence
There is a continuing upward trend of engagement in cultural heritage management (CHM) across all disciplinary areas, with 62.5% (n = 336) of all respondents reporting that they spent at least half of their time undertaking such work. Comparative data from 2015 (61%) and 2010 (59%) demonstrates the continuing strong profile of CHM activities as the dominant locus of employment in the profession. This trend correlates with perceived workplace confidence across the sector based on expectations of changing employee numbers (), with 70.2% of respondents expecting the workforce to maintain current numbers or increase archaeological staff in the coming year. Data from the survey year (2019), saw 75.6% of respondents noting that workplaces had remained the same or increased. The perceived workplace confidence is improved in comparison to the figures in 2015 which saw 64.7% of respondents expecting their work to maintain current numbers or expand. In comparison to the sector as a whole, in 2020 the private sector respondents showed similar confidence with 72.7% of respondents expecting the coming year to see no change or an increase in the number of archaeological staff. This is a more positive outlook than the last survey (2015) which saw only 53.7% of private-sector respondents experiencing a static or growing workforce and only 61.2% expecting the same number or growth in the following year (2015).
Figure 8. (Top) For all respondents and those working in the private sector and (Bottom) for pre- and post-pandemic declaration (all respondents): (left) changes in workforce numbers for 2019; (right) expected to change in the workforce for the coming year (2020). Each series represents 100% of respondents by category.
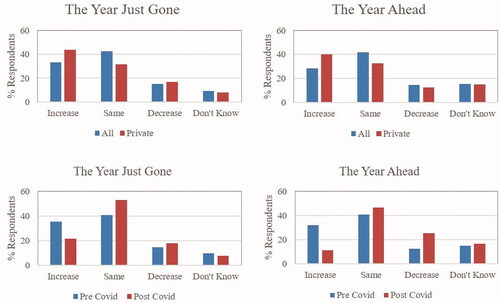
The impact of COVID-19 had a considerable impact on confidence across the profession (). Of the respondents who completed the survey before the declaration of the COVID-19 pandemic by the World Health Organisation on 11 March 2020 (n = 461), 72.7% expected stability or growth in the sector in the coming year. Of those who responded after the declaration of the pandemic (n = 90), confidence had slipped to 57.8% expecting stability or growth for 2020. While this is still positive, it does show an overall impact on sector confidence. Despite this relative optimism in the early days of the pandemic, recent work by Hoggarth et al. (Citation2021) in North America has shown longer-term employment and economic losses, with females—proportionally over-represented in casual employment in the university and CHM sectors (see below)—being disproportionally represented.
Table 8. Percentage of respondents observing/expecting workforce to stay the same or increase (n = 551).
Employment sector
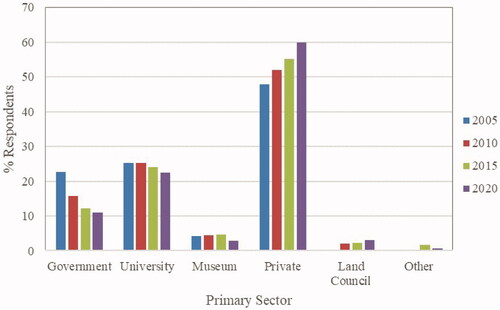
The private sector provides the main employment opportunities in archaeology in Australia. In 2020, 60% of respondents were employed in the private sector, continuing the strong upward trend seen in 2015 (55%) and 2010 (52%) from our baseline data in 2005 (47.9%) (). The next largest employers are universities (22.5%, down from 24.6% in 2015) and government (10.9%). Employment in the government sector has significantly declined from our baseline of 22.7% in 2005 when almost one-quarter of professional archaeologists were employed in the public sector. The longitudinal data demonstrate the long-term trend towards strong growth in the private sector, marked contraction in the public sector, and a slight contraction in the university and museum sectors.
Figure 9. Distribution of respondents by primary employer and sex, 2020 (n = 559).
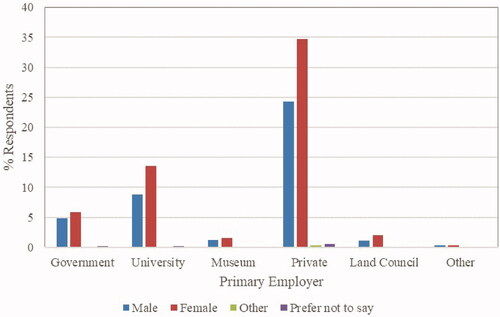
Figure 10. Longitudinal trends for the primary employer, 2005–2020.
There are discernible gender differences across employment sectors (). In universities there has been a substantial reversal from previous surveys with employment in the sector split 60.5% females and 39.5% males (compared with 45.8% females and 54.2% males in 2015, and 41.4% females and 58.6% males in 2005). This more closely aligns with the gender participation rates across the profession as a whole. In the private sector there continue to be more females (58.8%) than males (41.2%). While in 2015, females were already more prevalent in the private sector than males (52.6% females vs 47.4% males) this trend is again moving in concert with the changing proportion of females participating across the discipline; and, while in previous surveys government employment has reflected gender equity, in 2020, we observe the move to a greater number of females than males employed in government (55% females, 45% males).
Table 9. The proportion of males and females broken down by primary employer through time, 2005–2020.
Employment conditions
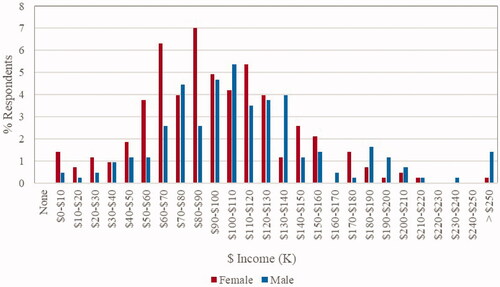
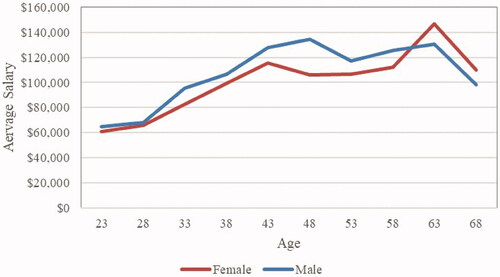
The average salary commanded in archaeology in Australia now sits at AUD102,430, with a distribution ranging from $0-$10,000 up to greater than $250,000 and a median salary range of $90–$100,000 (). This represents continued but slowing salary growth. Over the last 15 years we have seen ongoing increases, with a 31% increase from 2005 to 2010, 12% increase from 2010 to 2015, and 6.5% increase from 2015 to 2020 (Mate and Ulm Citation2016; Ulm et al. Citation2005, Citation2013). The most recent increase of 6.5% is substantially below the nationally observed salary increase which has risen c.11.4% from 2015 to 2019 (ABS Citation2020). Archaeologists still earn 15% above the national average (AUD89,486 in Nov 2019), however, this differential is also eroding (in 2015 archaeologists earned 20% above the national average salary and in 2010, almost 30% above); this is despite being recognised federally as an area of strong future growth (National Skills Commission Citation2021a). Moreover, archaeologists are paid substantially below professionals in tangentially related disciplines such as mining engineering (average AUD162,136) (National Skills Commission Citation2021b). Note that the average salaries for archaeology presented here might be slightly underestimates owing to the small percentage of respondents earning above $250,000 per year who were shaped back to an average salary of $255,000.
Figure 11. Distribution of average salary by sex for respondents in full-time work, 2020 (n = 428). Average income $102,430 (Male: $112,500; Female $94,700). Average income based on all income data, including those with no sex nominated. Average income based on salary mid-point; mid-point of top category taken as $255,000. Salaries in the bottom ranges represent part-year full-time employment.
The gender pay gap
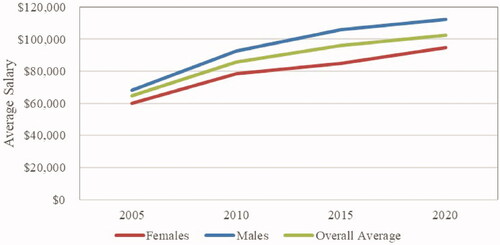
The average salary for males in the discipline of $112,500 has increased by $6,704 (6.3%) in the last 5 years (up from $105,796 in 2015). In comparison, the average salary for females ($94,700) has risen by $9,794 (11.5%) since 2015 (up from $84,906). This still equates to a gender pay gap of 18.8%, or on average males taking home $17,800 more than females (). While reduced from the high of 25% identified in 2015, this is still above the national average differential of 13.4% (ABS Citation2020), an extraordinary comparison given our survey is for a single profession, while the national wage statistics include a range of occupations, including those lower-paid occupations which females generally occupy that are attributed as part of the cause of the earning disparity.
Table 10. Average salary comparison of males and females over time, 2005–2020.
Norton et al. (Citation2018) suggest that the retention of graduate-qualified females in the research sector has improved as a result of the wider availability of paid maternity leave. This may be a factor in both the slight reduction in the pay gap between genders () and the reduction in the fall-off of older females in the discipline (). Further to this, the upwards trend in the proportion of work units with five or more archaeologists in their local workplace (60.4% in 2020; cf. 51% in 2015, 47.2% in 2010, and 45.5% in 2005) may also make maternity leave and flexible working arrangements more easily accessible to working mothers, contributing to the retention of females in the workforce.
Figure 12. Change in average salary through time by sex, 2005–2020.
Consideration of average salaries masks some of the detail related to the range of employment conditions. The proportion of survey respondents receiving high-end salaries has risen significantly to 52.3% of respondents earning $100,000 or over (well above the 2019 national average of AUD89,486). In 2005, approximately 9% of respondents earned over $100,000, in 2010 the figure was 17.5%, and in 2015 it was 27.9%. In the 2020 survey, males still dominated higher salary brackets (over $160,000) making up two-thirds of the 9.35% of respondents with earnings in this range (). Examining average salary by age and sex to remove the impact of the greater proportion of young females, the salary distribution shows that females still earn below males in most age groups ().
Figure 13. Average salary by age and sex, 2020.
The other factor that may influence the range of salaries is the sector in which respondents are based. As shows, there are differences in the average salary earned in different employment sectors across the discipline. Continuing the trends observable in previous surveys, universities command the highest average salary with government employees and those working in land councils/Indigenous representative bodies the next closest.
Table 11. Comparative average salary by primary employer, 2005–2020.
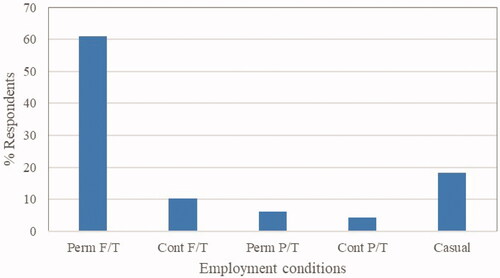
Casualisation of labour is regularly cited as an issue of concern in the contemporary employment market. In 2020, over 60% of respondents were employed in permanent full-time work, with full-time employment increasing to 71.1% when contract full-time employment is included, while just under 20% were casual employees (). This compares less favourably with the UK (for which there are longitudinal data for a population of over 7,000 archaeologists) where 80% of archaeologists are employed permanently and 84% of archaeologist are employed full-time (Aitchison and Rocks-Macqueen Citation2020). In Australia, less than one-third (28.9%) of respondents were employed on a part-time or casual basis in 2020; although some free text comments in the survey were made about employment conditions these were largely related to job security rather than about increasing casualisation.
Figure 14. Employment conditions, 2020 (n = 544).
The longitudinal trend shows an increasing degree of permanent full-time employment, and casual contracts trending generally upwards, although employment conditions appear slightly more stable in the most recent survey (). Considering employment conditions by sector, it is apparent that Government (federal, state, and local) has the highest permanent workforce, while universities and land councils/Indigenous representative bodies have the highest proportion of contract and casual employment, and, as might be expected, there is some casual labour in private companies, approximately 20% ().
Figure 15. Employment conditions through time, 2005–2020.
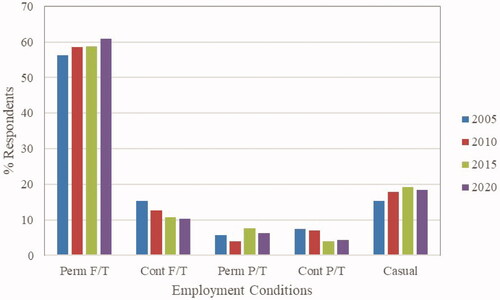
Figure 16. Employment conditions by sector, 2020 (n = 544).
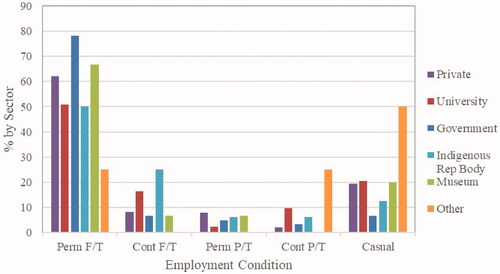
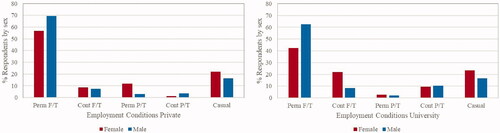
There is some gender disparity in those accessing casual and contract employment. The two major employment sectors in terms of casual and contract work are universities and the private sector, accounting for 12.1 of the 14.5% of contract labour and 16.3 of the 18.4% of casual employment. Examining the proportion of males and females in temporary employment (), females are under-represented in permanent positions in the private and university sectors but proportionally represented in casual work. In the university sector, females are over-represented in contract work suggesting less access to stable employment; overall in universities, 54.8% of females are in contract or casual work while 33.2% of males are under non-permanent employment conditions.
Figure 17. Casualisation comparison (left) private sector; (right) university, 2020.
Qualifications and experience
A four-year honours degree is now firmly entrenched as the ‘minimum industry standard’ for professional archaeologists in Australia (Beck et al. Citation2020). In the 2020 survey, 91.7% of respondents held an Honours degree qualification or higher (). In corollary, this trend towards professionalisation has been demonstrated in the falling percentage of respondents working in archaeology without formal university qualifications (2.4% in 2020, 3.5% in 2015, and 2.5% in 2010, down from the baseline of 6.2% in 2005).
Figure 18. Distribution of highest qualification, by sex, 2020 (n = 567).
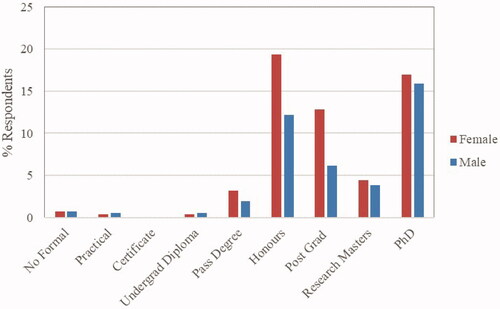
There is also an increasing number of archaeologists (60%) holding postgraduate qualifications, Masters (by coursework or research), or PhDs. In comparison, the most recently available data for the UK and Europe suggests 94% of British and European archaeologists have a degree qualification or higher and 47% of British archaeologists and 69% of European archaeologists have postgraduate qualifications (Aitchison and Rocks-Macqueen Citation2013; Aitchison et al. Citation2014:36). The gender imbalance in PhD qualifications in Australia, observed in 2015, has reversed and we now see females in the majority in the 33% of respondents holding PhDs.
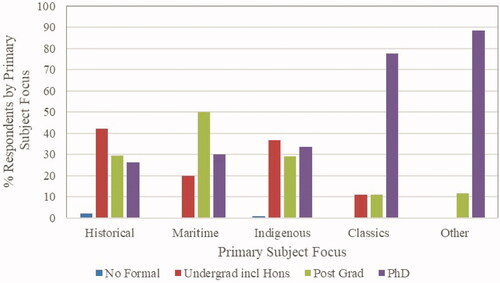
Level of qualification continues to be influenced to some degree by primary subject foci (); for example, maritime archaeology continued to emphasise a Masters qualification, while the Classics are heavily populated by PhD level qualifications, a reflection of the largest academic population of respondents with 90% of Classics respondents employed in universities or museums. In Indigenous and historical archaeology, there has been an increase in postgraduate qualifications, with both subdisciplines now having more practitioners with postgraduate qualifications than with Bachelor's degree qualifications (including Honours). In historical archaeology, for example, 7.3% have an undergraduate qualification (not including Honours), 35.8% have Honours degrees, while 54.5% have postgraduate qualifications (27.6% with Masters and 26.8% with PhDs).
Figure 19. Qualification by subject focus, full-time only, 2020 (n = 426).
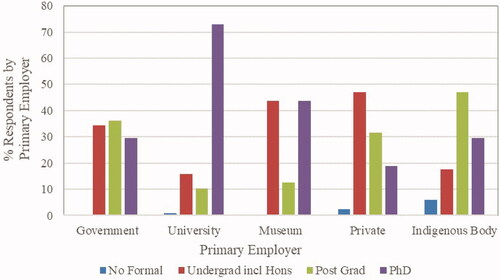
Employment sectors also have defined qualification profiles, with universities unsurprisingly being dominated by those with PhD qualifications, followed by museums. There has been growth as well in the number of postgraduate and PhD qualifications of respondents working in Government and in land councils/Indigenous representative bodies from 2015 to 2020. An Honours degree continues to be the highest qualification held by the majority of respondents working in the private sector ().
Figure 20. Qualification by the primary employer, 2020 (n = 555).
Qualifications also continue to influence remuneration, with respondents having doctoral qualifications continuing to be over-represented in the salary brackets of $100,000 and above (). Across the last 15 years, PhD qualifications have equated with an above-average salary, while there is some volatility in terms of trends around other qualification levels (). Those with no formal qualifications continue to represent the lowest salary brackets, while respondents with Bachelor's degrees including Honours are also predominantly represented in salary brackets below $100,000. This may be partially attributable to the proportion of recent graduates earning lower incomes.
Figure 21. Average salary/salary distribution by qualification, 2020 (n = 375).
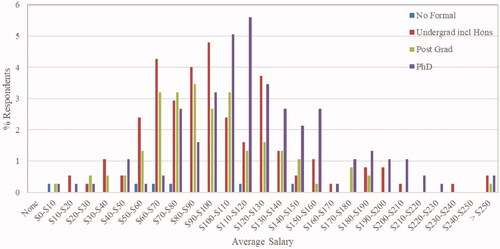
Table 12. Average salary by qualification, 2005–2020.
Volunteering
In line with previous surveys, the use of volunteers and the necessity to volunteer to gain experience continues to be highly topical (Smith et al. Citation2015; Wallis Citation2020). The ongoing need for volunteering opportunities as a means of gaining relevant experience has not changed, and in fact, volunteering experience is becoming increasingly formalised, including through the introduction of The Australian Archaeology Skills Passport (ANCATL et al. 2021). Participation rates continue to be high, with over 90% of respondents indicating they have participated in some form of volunteering in the past. The cumulative duration has been trending upwards over the last 10 years with the 2020 survey indicating that now over 50% of respondents have volunteered for more than 6 months (, ). As for previous surveys, the emphasis of volunteering remains focused on an archaeological excavation, survey and laboratory work, together with volunteering in museums, libraries and through teaching ().
Figure 22. Time spent volunteering, by survey year, 2005–2020.
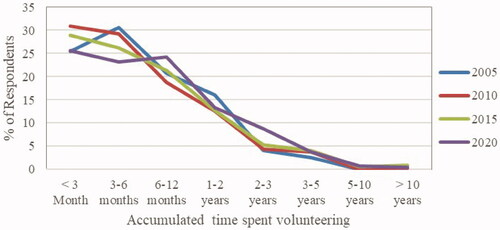
Figure 23. Predominant volunteering activities during 2019 (2020 survey).
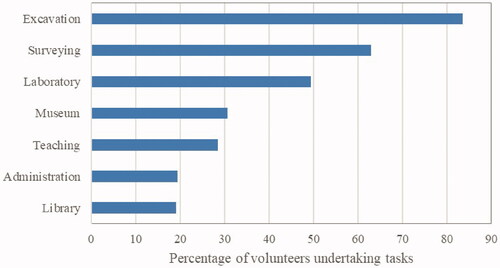
Table 13. Volunteering participation rates through time, 2005–2020.
Learning and training
In the 2020 survey, 18.5% of respondents (106 respondents) undertook formal study in the previous year. Following the trend in previous surveys, the majority of studying respondents (84.8%) were enrolled in postgraduate studies and over half (54.3%, n = 57) were undertaking PhD research. This continues the growth in the proportion of respondents studying at the doctoral level (47.1% in 2004, 48.8% in 2009, and 53.3% in 2014). Overall, 87% of respondents undertook some form of professional development in 2019.
Skill sets and skills gaps
The extended range of skills reviewed in previous surveys was again assessed in 2020 (). Most valuable skills were identified based on weighting across respondents, while skill gaps were determined by calculating an index of the gap between how valuable respondents perceived each skill to be in their workplace and their assessment of their level of experience for each skill.
Table 14. Skill areas used to define gaps in training.
The most valuable skills identified in the 2020 survey are all transferable, non-archaeology-specific skills () with interpersonal communication, report writing, and computer literacy identified as the top three skills. The most valuable skills continue to emphasise the importance of undergraduate training in transferable skills, a point that is also reflected in comments on graduate skills in the free-text responses that similarly emphasise report writing, interpersonal communication, and GIS skills. Four of the top five most valuable skills—interpersonal communication, report writing (written communication), computer literacy (digital skills), and critical thinking—also reflect the skills identified as critical for future employment in The New Work Smarts report (The Foundation for Young Australians Citation2017). Of the skills gaps identified (), three were also non-archaeological but transferable skills—statistical analysis, GIS, and advocacy/public relations. The remaining seven skill gaps were predominantly specialist archaeological skills such as ancient DNA analysis, isotope analysis, and residue and use-wear analysis.
Table 15. Top-10 most valuable skills identified in 2020 survey (all respondents), in order of perceived value.
Table 16. Top-10 skill gaps identified in 2020 survey (all respondents).
When these results are further interrogated concerning subject focus there is marked commonality in skills gaps across subject areas (). In particular GIS, floral analysis, residue and use-wear analysis, and statistical analysis are highlighted across disciplines. As previously suggested (Mate and Ulm Citation2016), these specialist skills gaps may represent particular skills that would not necessarily be held by the average archaeologist and instead indicate a business need and opportunity for specialists. Further to this, 95% of respondents felt there should be shorter (e.g. 2–5 day) professional development courses on offer for archaeologists, and again the three highest skills gaps (statistical analysis, GIS, and advocacy/public relations) suggest some priorities. One written response highlighted the need for professional development opportunities to be accessible for those living or working in rural and remote areas. With the large-scale move to virtual meetings and training necessitated by the COVID-19 pandemic, this may now be more easily addressed.
Table 17. Top-10 skill gaps by primary subject focus, 2020.
The newly added question regarding the type of professional development respondents would like to participate in yielded two forms of information. On the whole, the preferred style of professional development was conferences, with short courses and workshops the next two most desired delivery methods. In terms of preferred topic areas, these reflected some of the skill gaps identified, most particularly GIS and mapping techniques, artefact analysis (both lithics and historical archaeology artefacts), and a range of specialist skills (most particularly geomorphology and soil science, human skeletal analysis, and residue and use-wear analysis). In addition, professional development related to understanding legislation and its changes, working with Indigenous communities, and digital imaging (including photography, photogrammetry, the use of LiDAR and drones, etc) were all identified by several respondents as topics of interest.
Preparing students for working in archaeology
The first survey of the archaeology profession in Australia was catalysed by a desire to generate quality baseline data to inform decisions about archaeological teaching and learning. As Ulm et al. (Citation2005) found at the time, the engagement between educational institutions and the CHM sector, and the responsibilities of each for ensuring graduate skillsets was an important factor. The identification of the importance of experience since that time has continued in the 2020 survey, with:
97.6% of respondents agreeing that practical, field-based archaeological experience should be an important part of undergraduate training;
87.4% of respondents agreeing that there is a need for a greater emphasis on developing practical consulting skills in undergraduate degrees;
95.9% of respondents agreeing there is a need to better coordinate opportunities for students and early career graduates to gain vocational experience in the workplace; and
89.5% of practitioners being willing to place Early Career Graduates.
While 19% of respondents disagreed that there was responsibility for non-academics in training graduates, this is down from previous surveys, with a continuing trend towards shared responsibilities for undergraduate and graduate training ().
Table 18. Changing response to the responsibility of non-academics for undergraduate and graduate training, 2005–2020.
Free text responses
The most revealing in terms of measuring the temperature of the discipline is the free-text responses. A total of 122 additional comments were received from the survey responses. Several themes emerged as part of the free comments section of the survey, including bullying and discrimination. This emphasis is likely to be related to heightened discussions in the profession around these issues at the Australian Archaeological Association Annual Conference in 2019, immediately before the release of the survey (Ulm et al. Citation2019) and high-profile focus on the issues of bullying and discrimination globally (Wade Citation2019). There were also comments around the impact of bureaucracy and inconsistencies in legislation for those working (particularly commercially), and several comments about the quality of work being conducted and the need for national standards around archaeological and cultural heritage practice.
A recurring theme in responses to the Profiling the Profession survey over the last 15 years has been related to both graduate teaching and graduate skills (see also Gibbs et al. Citation2005). While there were similar sentiments expressed in the 2020 survey, both in terms of the skillset that graduates did or did not possess and views regarding the responsibility or otherwise of private sector workplaces to provide training to graduates, the relative frequency of these comments were less than those observed in previous surveys: 2020 − 16 out of 115 comments (13.9%); 2015 − 16 out of 89 (18%); 2010 − 42 out of 106 (39.6%). Comments encompassed a range of sentiments about graduates needing different skill sets, and where responsibility for that training lies, but in the 2015 and 2020 survey there were also comments from recent graduates on skills they felt were necessary to be effective in the field. Finally, there was a range of comments about employment conditions, including ongoing reliable employment opportunities, and casual pay scales.
Discussion and conclusion
The results of the 2020 Australian Archaeology in Profile survey highlight a growing and maturing profession. The continuing gender pay gap identified compares to nationwide conditions. Nevertheless, despite increasing levels of qualification and uptake in higher degree research, archaeologists in Australia continue to be comparatively underpaid in professional terms. This may be influenced by the pay gap in a discipline with a greater representation of young females. Archaeologists in Australia are predominantly home-grown and educated here, and the majority of archaeologists work and are based on the eastern seaboard. The employment landscape over the last five years has moved towards more stable conditions and this is also represented in the relatively buoyant view of the sector, even in the face of a pandemic.
The starting premise of this survey was to better understand the teaching and learning needs of undergraduates and graduates, and skill gaps and professional development needs to move towards a more professional discipline. Teaching and learning emphasis over the 15 years since the survey began has seen a shift towards more vocationally-based learning and this is reflected in deeper engagement between the private sector and learning institutions. Professional development activities are also addressing at least some of the needs of practitioners. The skillset for the sector continues to emphasise specialist skills as a gap, but more and more transferrable skills are seen as valuable for those undertaking work in the discipline. This emphasises and supports the move towards more practical and vocationally based tuition as part of the tertiary education platform.
In 2021 the Australian Government implemented new legislation in the Job-Ready Graduates Package changing the cost structure of university degrees based on unsubstantiated claims about the contribution of different disciplines to the Australian labour market or the national interest (Australian Academy of the Humanities Citation2020). From 2021 students pay 113% more than in the past to study a degree in archaeology ($14,500 per year) (Australian Government Citation2021). The rationale for elevating the fees for archaeology runs counter to the evidence for strong labour market demand for archaeologists (as identified by the Australian Government’s own National Skills Commission Citation2021a). For example, the Australian resources sector contributes around 10% of GDP (Department of Industry, Science, Energy and Resources Citation2020) and relies on archaeologists to undertake the cultural heritage surveys ahead of mine development. Sixty percent of professional archaeologists are employed in the private sector undertaking cultural heritage work and these roles have expanded over the last two decades to service the expanding resources sector. It remains to be seen what impact the Job-Ready Graduates Package has on degree enrolments and retention and in particular the anticipated deleterious impacts on participation rates of Indigenous students and females (Australian Academy of the Humanities Citation2020).
The changing employment landscape, particularly with the impact of COVID-19, will continue to be a factor in demand for professional archaeologists. Our survey, early in the pandemic, indicated diminished confidence in terms of stability and growth. Work by Hoggarth et al. (Citation2021) which showed a pronounced impact on the sector in North America felt especially by females, may yet be borne out in Australia. With females in archaeology in Australia over-represented in temporary employment (contract and casual employment) in the two largest employment sectors, the impacts of the pandemic in terms of stability in the discipline may still be evolving.
Despite the apparent impact of recent events, archaeology remains well-positioned to prepare students and professionals with both specific and generic skills for future career flexibility. Studies of future employment highlight the central role of skill sets that are difficult to automate, including critical and creative thinking (problem-solving); interpersonal and cross-cultural communication; collaboration, cooperation and teamwork; information and communication technology skills; leadership; social skills; resilience; and emotional intelligence (Hajkowicz et al. Citation2016; Lambert Citation2017; Peetz Citation2019; The Foundation for Young Australians Citation2017).
The longitudinal data provided by the 2020 Australian Archaeology in Profile survey establishes the context for engaging in current debates around employment conditions and workplace behaviour. It provides information to inform future professional development and teaching and learning strategies, and provides data to support advocacy for the role of the discipline in STEM- and HASS-based research. The continued low participation rates of professionally qualified Indigenous archaeologists, however, remains a challenge for the profession. At this moment when the spotlight is again turning to corporate citizenship and social justice, the opportunities to ‘do it better’ are clear. Hopefully, however, the engagement, vibrancy and professional base of the archaeology profession in Australia speak well for the future of the discipline.
Supplemental Material
Download PDF (482.8 KB)Acknowledgements
For comments and feedback on the survey instrument and support in rolling out the survey, we thank Caitlin D'Gluyas, Andrew Fairbairn, Anna Kreij, Catherine Frieman, Andrew Costello, Georgia Roberts, Melissa Marshall, Michael Slack, Peta Straiton, David Steinberg, Robyn Jenkins, and Sarah Slater. For assistance with gender pay gap investigations, we thank Rachel Mate. For support and assistance in distributing the survey, we thank the AIMA, ASHA, AAA, and AACAI. Funding was provided by the AAA via the ANCATL. Finally, a special thanks to the archaeologists working in and from Australia who took the time to complete the surveys. This study was approved by the JCU Human Research Ethics Committee (Ethics Approval Number H7938).
Disclosure statement
No potential conflict of interest was reported by the author(s).
Additional information
Funding
References
- Aitchison, K. 2013 Discovering the archaeologists of Europe. In J.H. Jameson and J. Eogan (eds), Training and Practice for Modern Day Archaeologists, pp.15–29. New York: Springer.
- Aitchison, K., E. Alphas, V. Ameels, M. Bentz, C. Borș, E. Cella, K. Cleary, C. Costa, P. Damian, M. Diniz, C. Duarte, J. Frolík, C. Grilo, Initiative for Heritage Conservancy, N. Kangert, R. Karl, A. Kjaerulf Andersen, V. Kobrusepp, T. Kompare, E. Krekovič, M. Lago da Silva, A. Lawler, I. Lazar, K. Liibert, A. Lima, G. MacGregor, N. McCullagh, M. Mácalová, A. Mäesalu, M. Malińska, A. Marciniak, M. Mintaurs, K. Möller, U. Odgaard, E. Parga-Dans, D. Pavlov, V. Pintarič Kocuvan, D. Rocks-Macqueen, J. Rostock, J.P. Tereso, A. Pintucci, E.S. Prokopiou, J. Raposo, K. Scharringhausen, T. Schenck, M. Schlaman, J. Skaarup, A. Šnē, D.D. Staššíková-Štukovská, I. Ulst, M. van den Dries, H. van Londen, R. Varela-Pousa, C. Viegas, A. Vijups, N. Vossen, T. Wachter and L. Wachowicz 2014 Discovering the Archaeologists of Europe 2012-14: Transnational Report. York: York Archaeological Trust.
- Aitchison, K. and R. Edwards 2003 Archaeology Labour Market Intelligence: Profiling the Profession 2002/03. Bradford: Cultural Heritage National Training Organisation and the Institute of Field Archaeologists.
- Aitchison, K. and R. Edwards 2008 Archaeology Labour Market Intelligence: Profiling the Profession 2007-08. Reading: Institute of Field Archaeologists.
- Aitchison, K. and D. Rocks‐Macqueen 2013 Archaeology Labour Market Intelligence: Profiling the Profession 2012-13. Sheffield: Landward Research Ltd.
- Aitchison, K. and D. Rocks‐Macqueen 2020 State of the Archaeological Market, 2019. London: Federation of Archaeological Managers and Employers.
- Altschul, J.H. and T.C. Patterson 2010 Trends and employment in American archaeology. In W. Ashmore, D. Lippert and B.J. Mills (eds), Voices in American Archaeology, pp. 29–101. Washington DC: Society for American Archaeology.
- ANCATL, G.L. Roberts and M. Marshall 2021 (eds) The Australian Archaeology Skills Passport. 3rd ed. Canberra: Australian Archaeological Association Inc.
- Australian Academy of the Humanities 2020 Submission to Senate Inquiry into the Higher Education Support Amendment (HESA) Bill 2020 September 2020. Retrieved 5 August 2021 from <https://www.humanities.org.au/wp-content/uploads/2020/09/AAH-Policy-2020-Senate-Inquiry-Job-Ready-Legislation.pdf>.
- Australian Bureau of Statistics (ABS) 2018 Estimates of Aboriginal and Torres Strait Islander Australians, June 2016. Retrieved 30 July 2021 from <https://www.abs.gov.au/ausstats/[email protected]/mf/3238.0.55.001>.
- Australian Bureau of Statistics (ABS) 2020 Results of the Survey of Average Weekly Earnings. Retrieved 30 July 2021 from <https://www.abs.gov.au/statistics/labour/earnings-and-work-hours/average-weekly-earnings-australia/latest-release>.
- Australian Bureau of Statistics (ABS) 2021 Changing Female Employment Over Time, February 2020. Retrieved 31 July 2021 from <https://www.abs.gov.au/articles/changing-female-employment-over-time>.
- Australian Government 2021 Student Contribution Amounts. Retrieved 5 August 2021 from <https://www.studyassist.gov.au/help-loans-commonwealth-supported-places-csps/student-contribution-amounts>.
- Beck, W., G. Roberts, A. Fairbairn, S. Ulm, J. Balme, C. Frieman, G. McGowan and K. Strickland 2020 By Degrees: Benchmarking Archaeology Degrees in Australian Universities. 2nd ed. Brisbane, QLD: Australian National Committee for Archaeology Teaching and Learning, Australian Archaeological Association.
- Costello, A. 2021 Beyond the shovel and the sieve: Achieving better outcomes for Aboriginal people in commercial archaeology. Australasian Journal of Environmental Management 28(1):45–58.
- Department of Industry, Science, Energy and Resources 2020 Resources and Energy Quarterly December. Canberra: Commonwealth of Australia. Retrieved 5 August 2021 from <https://publications.industry.gov.au/publications/resourcesandenergyquarterlydecember2020/documents/Resources-and-Energy-Quarterly-Dec-2020.pdf>.
- Fairbairn, A., A. Ross, S. Ulm, S. Nichols and P. Faulkner 2013 Keeping Country: A web-approach to Indigenous outreach in cultural heritage management. Australian Archaeology 77:127–134.
- Gaspar, M.V., C.F. Caromano, E.R. Pereira, K. Brandão, J. Belletti, A. Freitas, L.D.P. Passos, M.D.N. Lima, E.K. Tamanaha, L.M. Cascon, G.F. Bianchini, M.P. Cabral, C.A. d M. Wichers and M. Bezerra 2020 Quem somos nós? Ou perfis da comunidade profissional arqueológica no Brasil: Primeiras aproximações. Revista Habitus 18(1):146–178.
- Gibbs, M., D. Roe and D. Gojak 2005 Useless graduates? Why do we all think that something has gone wrong with Australian archaeological training? Australian Archaeology 61:24–31.
- Hajkowicz, S.A., A. Reeson, L. Rudd, A. Bratanova, L. Hodgers, C. Mason and N. Boughen 2016 Tomorrow’s Digitally Enabled Workforce: Megatrends and Scenarios for Jobs and Employment in Australia over the Coming Twenty Years. Brisbane: CSIRO.
- Hoggarth, J.A., S. Batty, V. Bondura, E. Creamer, C.E. Ebert, K. Green-Mink, C.L. Kieffer, H. Miller, C.V. Ngonadi, S.E. Pilaar Birch, C. Pritchard, K. Vacca, T.B. Watkins, E. Zavodny and A.R. Ventresca Miller 2021 Impacts of the COVID-19 pandemic on women and early career archaeologists. Heritage 4(3):1681–1702.
- Jalbert, C. 2019 Archaeology in Canada: An Analysis of Demographics and Working Conditions in the Discipline. Unpublished PhD thesis, Department of Archaeology, Faculty of Humanities and Social Sciences, Memorial University of Newfoundland.
- Koolmatrie, J. 2020 Destruction of Juukan Gorge: We need to know the history of artefacts, but it is more important to keep them in place. The Conversation 2 June 2020. Retrieved 5 August 2021 from <https://theconversation.com/destruction-of-juukan-gorge-we-need-to-know-the-history-of-artefacts-but-it-is-more-important-to-keep-them-in-place-139650>.
- Lambert, P. 2017 The future of work and skills. Professional Educator 17(2–3):15–17.
- Lazar, I., T. Kompare, H. van Londen and T. Schenk 2014 The archaeologist of the future is likely to be a woman: Age and gender patterns in European archaeology. Archaeologies 10(3):257–280.
- Mate, G. and S. Ulm 2016 Another snapshot for the album: A decade of Australian archaeology in profile survey data. Australian Archaeology 82(2):168–183.
- National Skills Commission 2021a Job Outlook: Archaeologists. Retrieved 5 August 2021 from <https://joboutlook.gov.au/occupations/archaeologists?occupationCode=272414>.
- National Skills Commission 2021b Job Outlook: Mining Engineers. Retrieved 5 August 2021 from <https://joboutlook.gov.au/occupations/mining-engineers?occupationCode=2336>.
- National Skills Commission 2021c Skills Priority List. Retrieved 5 September 2021 from <https://www.nationalskillscommission.gov.au/2021-skills-priority-list>.
- Norton, A., I. Cherastidtham and W. Mackey 2018 Mapping Australian Higher Education, 2018. Retrieved 23 March 2021 from <https://grattan.edu.au/report/mapping-australian-higher-education-2018/>.
- Peetz, D. 2019 The Realities and Futures of Work. Canberra: ANU Press.
- Queensland Resources Council 2019 Economic Impact of Minerals and Energy Sector on the Queensland Economy 2018/19. Retrieved 10 September 2021 from <https://www.qrc.org.au/wp-content/uploads/2020/10/Economic-Impact-of-Resources-Sector-on-Qld-Economy-2018-19-Final-compressed.pdf>.
- Smith, C., J. Garvey, H. Burke and I. Domingo Sanz 2015 Success strategies for a career in archaeology. Archaeologies 11(2):300–336.
- Tan, N.H. 2019 Preliminary report: Archaeology education in Southeast Asia. SPAFA Journal 3:1–27.
- The Foundation for Young Australians 2017 (FYA) The New Work Smarts Report. Retrieved 10 September 2021 from <https://www.fya.org.au/wp-content/uploads/2017/07/FYA_TheNewWorkSmarts_July2017.pdf>.
- Ulm, S., A. Ross and M. Slack (eds) 2019 Disrupting Paradise: The Archaeology of the Driest Inhabited Continent on Earth: Conference Handbook. Gold Coast, QLD: Australian Archaeological Association Inc.
- Ulm, S., G. Mate, C. Dalley and S. Nichols 2013 A working profile: The changing face of professional archaeology in Australia. Australian Archaeology 76:34–43.
- Ulm, S., S. Nichols and C. Dalley 2005 Mapping the shape of contemporary Australian archaeology: Implications for teaching and learning. Australian Archaeology 61:11–23.
- Wade, L. 2019 Archaeological society tries to stem continuing controversy over #MeToo scandal. Science Insider. Retrieved 5 August 2021 from <https://doi.org/https://doi.org/10.1126/science.aax7505>.
- Wallis, L.A. 2020 Disrupting paradise: Has Australian archaeology lost its way? Australian Archaeology 86(3):284–294.
- Wallis, L.A., A.C. Gorman and H. Burke 2013 The opportunities and challenges of graduate level teaching in cultural heritage management. Australian Archaeology 76:52–61.
- Wilson, C. 2014 Indigenous archaeologies: Australian perspective. In C. Smith (ed.), Encyclopedia of Global Archaeology, pp.3786–3793. New York: Springer.
- Workplace Gender Equality Agency 2021 (WGEA) Australia’s Gender Pay Gap Statistics. Retrieved 13 August 2021 from <https://www.wgea.gov.au/sites/default/files/documents/Gender_pay_gap_fact_sheet_Feb2020.pdf>.
- Zeder, M.A. 1997 The American Archaeologist: A Profile. Walnut Creek: Altamira Press.
- Zorzin, N. 2010 Archéologie au Québec: Portrait d’une profession. Archéologiques 23:1–15.