
 ?Mathematical formulae have been encoded as MathML and are displayed in this HTML version using MathJax in order to improve their display. Uncheck the box to turn MathJax off. This feature requires Javascript. Click on a formula to zoom.
Abstract
In this study, we propose a novel model to design dynamic hotel room pricing strategies that consider the specific requirements associated with the tourism sector. Reinforcement learning (RL) is used to formulate the problem as a Markov decision process (MDP) and Q-learning is used to solve this problem with a new reward function for hotel room pricing which considers both the profit and demand. In the proposed model, the basic features of the hotels are digitized and expressed in a way that similar hotels get close values. In this way, price predictions for the hotels that are newly included in the system can be made through similar hotels and the cold start problem is solved. In order to observe the performance of the proposed model, we used a real-world dataset provided by a tourism agency in Turkey and the results show that the proposed model achieves less mean absolute percentage error on test data. In addition, we also observe the training phase and show that the proposed RL method has smooth reward transitions between timesteps and has a reward curve more similar to the desired exponential rise compared to recently recommended RL models with different reward functions in dynamic pricing.
1. Introduction
In recent years, online shopping is increasing dramatically. It is not only because of the COVID-19 pandemic which also increased the frequency of online buying, but the digital revolution and more internet users with the ease and availability of high-speed internet make it more popular. More users prefer online shopping over offline shopping since they can buy a wide range of products and services such as fashion (clothes/shoes), electronics, home appliances, books, food, jewellery, medicines, houses, cars, hotels, vacation rentals, and airline tickets. The greatest benefit of online shopping is its convenience: it fits into your life how busy you are since it is accessible 24/7. E-commerce websites make it easy for users to examine the products in detail or compare their prices resulting in a competitive environment for both e-commerce websites and the sellers in these platforms. Especially for marketplace websites, one of the important topics is dynamic pricing.
Dynamic pricing refers to the practice of adjusting prices in real-time based on various factors such as demand, supply, competition and customer behaviour. Dynamic pricing strategies are often developed in response to volatile market conditions to obtain the most competitive price for each commodity. For the plan to be successful, commodity prices must evolve and change until they match market conditions (Taleizadeh et al. Citation2022, Citation2023). Using these strategies, companies can easily apply the right customer-price-time trio for a product. Besides, they can both improve the service quality and the profit margin.
Machine learning (ML) methods are widely preferred for dynamic pricing due to the advantages they provide regarding data preprocessing, the ability to automatically find hidden patterns in the data, taking into account many products & maximizing profits on a global scale. These algorithms can respond diversely and dynamically to market changes, using historical data, various product features, and/or unstructured data such as images and text to learn pricing rules. Additionally, new data can be easily integrated into the current model, and emerging trends and/or demands can be determined. Especially the classification algorithms, a sub-branch of ML, can easily relate a new product to similar products to determine a potential price segment.
Deciding the right price for a product has different challenges. The first is that complex structured factors make dynamic reward optimization algorithms difficult to use (Gibbs et al. Citation2018). Such problems have become manageable by using different algorithms or simplifying the structure of the factors. Another problem is the lack of data about the product and the market. Until recently, companies’ data collection capabilities were quite limited, especially for small and medium-sized companies. They also were not aware of what kind of data might be useful. Thanks to the widespread use of price optimization methods, the increase in the customizable features of Enterprise Resource Planning software, and the collection of information about competing products over the internet, companies can offer higher quality and clearer data. This study aims to implement a dynamic pricing model for an e-commerce website of a tourism company. Travel websites are selling travel and tourism services from different companies in the market. Traveling costs highly influence customers’ decisions on choosing a destination and the duration of their travel. Thus, it becomes important for these platforms to use dynamic pricing strategies to adjust prices depending on several factors such as variations in demand and competition. Dynamic pricing for travel websites is a challenging problem since it requires setting different prices for various room types and customer categories (business/tourist/group, etc.) by also considering the capacity of hotels, season, region of the hotels, booking horizon, and the behaviour of competitors. A dynamic pricing model for hotel rooms has to be able to deal with many exceptions since hotels must set new prices considering holidays, special discounts, special events in the region of the hotel, room types, weather, changing economic conditions and income levels, opening of new competing hotels in the area. Besides dynamic pricing for hotel rooms has several special use cases which influence the room prices: Booking horizon refers to how far in advance hotel rooms can be booked varies in a wide period of time. Guests may book reservations days, weeks, or even months before their arrival, and some guests might cancel their bookings. In addition to this, the room prices may change with availability, season, and the length of stay which also depend on destinations’ characteristics. Another important challenge for hotel room pricing is the cannibalization effects among hotels, i.e. if we increase the discount price of a hotel room, it can lead to a decrease in sales for rooms of other hotels competing with it. To overcome these challenges, we propose a novel dynamic pricing model for hotel rooms based on reinforcement learning (RL) which is an effective method where a multi-objective problem cannot be solved using analytical methods due to its complexity. RL is a sub-branch of ML where an agent learns to make decisions by interacting with an environment and receiving feedback in the form of rewards or penalties. In this study, the proposed dynamic pricing model uses RL to learn optimal pricing strategies for hotel rooms based on demand and profit.
The proposed model has experimented with the performance of predictions of the actual prices on a real data set obtained from a website of a tourism company in Turkey. The number of foreign tourists visiting Turkey has increased exponentially in the last two decades. In 1990, Turkey drew 4.8 million overseas tourists, generating $3.4 billion in revenue, but by 2019, before the COVID-19 pandemic, the figure had risen to $28.7 billion, with 51.7 million visitors. In addition to this insight, when assessing top destinations for international tourism based on international tourism receipts and international tourist departures, Turkey has maintained its status in recent years as the fourth most popular destination in the Mediterranean region and the sixth in Europe after tourism behemoths France, Spain, Italy, the UK and Germany. For these reasons, it has been interesting to use tourism sale data belonging to Turkey. The dataset includes the room sales records of eighty popular hotels in Turkey for a total of 162 weeks in peak seasons between January 2013 and October 2021. To the best of our knowledge, this is the first study that investigates a dynamic pricing model based on the RL technique for the hotel industry. The main contributions of this study can be summarized as follows:
Propose an Artificial Intelligence (AI) based dynamic pricing strategy for a real-world e-commerce platform of a tourism company
Use of RL to formulate the hotel room pricing as a finite Markov Decision Problem (MDP) and solve it with Q-learning
Propose a novel easy-to-use reward function for hotel room pricing which considers both the profit and ground truth demand values
By using the basic features of the hotels in a way to make hotel comparisons; To be able to make price estimations for hotels that are newly included in the system and to find solutions to the cold-start problem
Conduct detailed experiments on real-world data set to analyse different aspects of our proposed method
The rest of the paper is organized as follows. Section 2 presents related works about dynamic pricing. Section 3 gives details of our proposed RL-based dynamic pricing model and background methodology. Section 4 presents data preparation and experimental results of the study. Lastly, Section 6 concludes the paper.
2. Literature review
In recent years, AI-based approaches have gained significant attention in various fields such as face recognition and model compression in computer vision (Wang and Deng Citation2020; Jin et al. Citation2020, Citation2022; Zheng et al. Citation2020), text classification in natural language processing (Chai et al. Citation2020; Paiva et al. Citation2022), classification modulation of radio signals in communication (Zheng et al. Citation2021a, Citation2021b; Jun and Jinzhou Citation2022) and path planning in robotics (Maoudj and Hentout Citation2020; Sahu et al. Citation2022).
Despite the remarkable developments in basic tourism theory presented in recent studies, (Song et al. Citation2019; Li et al. Citation2021), statistical methods and AI-based approaches also come to the fore in successfully solving dynamic pricing in tourism. Regardless of the industry section, AI-based ML (Ye et al. Citation2018; Greenstein-Messica and Rokach Citation2020; Ban and Keskin Citation2021) and deep learning (DL) (Montazeri et al. Citation2020; He et al. Citation2022) models are commonly used for dynamic pricing applications thanks to their high accuracy predictions. Whether it is ML or DL, the dynamic pricing problem can be considered from three basic perspectives and appropriate forecasting models can be presented: Unsupervised Learning (UL) (Javed et al. Citation2019), Supervised Learning (SL) (Ye et al. Citation2018), and RL (Lu et al. Citation2018).
As reported by Ferreira et al. (Citation2016), a price optimization method covering demand forecasting for an online fashion boutique platform Rue La La was developed. The authors observed the performances of Regression Trees (RT), Multicaptive Regression, Semilogarithmic Regression, Least Squares Regression (LSR), Principal Components Regression (PCR), and Partial LSR for demand forecasting and pointed out that the best algorithm for demand prediction is RT. After creating an accurate demand prediction model, they made a static price optimization with Branch & Bound Algorithm.
Dynamic pricing and demand modelling of a franchise in Major League Baseball for single home game ticket pricing is discussed by Xu et al. (Citation2019). They compared fixed ticket pricing method performance on the first half of the season with dynamic ticket pricing performance on the second half of the season throughout 81 home games. With the flexible pricing policy without allowing more than 5% discount they found out a revenue improvement of up to 17.2% is possible.
Kim, Zhang, van der Schaar, and Lee suggested two enhancements to the Q-learning algorithm: alternative state description and virtual experience (Kim et al. Citation2015). The method was based on a dynamic pricing algorithm for microgrid systems, in which the service provider can change the energy price based on the load demand rate of clients and the cost of electricity. Then, they focused on a more adaptive microgrid system in which each client learns and predicts market price changes. They built a distributed method that can run at each of the providers and clients without a priory sharing knowledge by combining the multi-agent learning structure with the post-decision state learning method. Especially in systems with a high demand backlog rate, the results revealed that the dynamic pricing with the RL approach outperforms the myopic optimization approach. It also revealed that both customer and system costs were greatly reduced by using the learning ability of the clients.
In Montazeri et al.’s negotiation system, a deep actor-critic RL algorithm was used to shape the behaviour during bargaining in a way that maximizes the long-term financial revenue depending on the bargaining conditions (Montazeri et al. Citation2020). Liu et al. proposed a dynamic pricing method (Liu et al. Citation2018) based on deep RL modelled by the Markov Decision Process (MDP) for use in the Alibaba Inc. e-commerce website. Thanks to DRL, they were able to successfully deal with the complex market environment and market movements, design an efficient reward function and optimize long-term returns for pricing problems in both discrete and continuous environments. Online testing for this model is problematic due to the legal requirement that the same pricing is shown to all clients at the same time. Nevertheless, this method is used for four different categories of goods on Alibaba Inc. The contributions of the study to the literature: applying discrete set problem on continuous price set, applying difference of revenue conversion rates, handling cold start problem with pre-training, and evaluating historical data.
Algorithm 1
Q-Learning Algorithm
Initialize Q_table arbitrarily and
for each episode do
Initialize s
for each step of episode do
choose a from s using policy derived from Q
take action a and observe
if s is a terminal state then
break
end if
end for
end for
In the study of Maestre et al. (Citation2019), a dynamic pricing model was formed for fair pricing using Q-Learning. To represent the different customer behaviours, they created four different artificial groups with variable behavioural tendencies for their study. Group 1 welcomes products with higher value compared to Group 2. Group 3 welcomes higher prices and for Group 4 price does not matter. The main objective of the study is to determine the maximum price for each group while keeping the prices close between each group for fairness. They evaluated the fairness of the model with the help of the rotated Jain’s Index and showed that balanced revenue-fairness pricing can be possible with an RL algorithm.
In this study, we propose an off-policy RL algorithm for the dynamic room pricing problem of hotels. We prefer off-policy for tourism agency e-commerce platforms since a somewhat unsuitable price on the Internet can quickly cause a huge loss of capital. Moreover, we customize for the hospitality industry by designing a new reward function that considers both the profit and demand of a hotel room sale. As far as we know, no study in the literature formulates the dynamic pricing problem in the accommodation industry with MDP & Q-learning and offers a solution to this issue.
3. Methodology
The overview of the Methodology is organized in two steps. In the first step, Background RL algorithm is presented to make the proposed method easy to understand. Secondly, the flow of the Proposed Dynamic Pricing Model is explained in detail.
3.1. Background RL algorithm
RL is a sub-branch of ML that includes an agent learning process through reward and error experiences with a dynamic environment to optimize cumulative reward and it is different than SL and UL, the two commonly known sub-branches of ML.
In SL, the agent learns acts from labelled samples presented by a supervisor and then extends that knowledge to new contexts. Because RL is a dynamic problem, obtaining samples that cover all potential contexts is generally impossible. The experiences of the interactive agent are the only source for learning in this model. Conversely, UL is focused on uncovering structures in unlabelled datasets. Despite interactive systems that may appear to be similar to RL, its goal is to optimize a reward rather than identify uncovering structures (Ferrara Citation2018). In addition, the key feature that distinguishes RL from these two is that it seeks to find the balance between exploration and exploitation. The agent should exploit the knowledge to obtain a reward and explore to make a better choice of action in the future, all at the same time (Garcıa and Fernández Citation2015).
RL can basically be described as in : an agent performs actions in the given environment, which are interpreted as a reward and a state description and then fed back to the agent. There are three key characteristics that define RL difficulties. Firstly, they could be considered closed-loop problems because the actions of the learning system affect its future inputs. Secondly, the learner has no knowledge of what action to take and must determine which is the best by testing them out. The last one is that the acts have relevance for all future rewards, not just the current one (Ferrara Citation2018). The process of RL consists of six steps:
Figure 1. Basic components of RL: environment, state, action, agent, and reward.
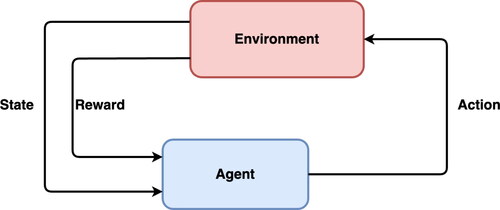
Observing the environment
Using a strategy to decide how to act
Taking proper action, getting a reward or a penalty
Re-developing the strategy by learning from experience
Iterating steps 2–4 until finding the appropriate strategy
Q-learning is a model-free and off-policy RL algorithm that enables the agents to learn how to act optimally in finite MDP domains by experiencing the effects of their actions rather than having to develop maps of the domains (Sutton and Barto Citation2018). Determining the maximum forecasted rewards for each state’s action is performed using Q-Table. In essence, this table will direct to the optimum action in each state.
Algorithm 2
Proposed Dynamic Pricing Algorithm
1: Initialize Q_table arbitrarily
2: for each episode do
3: Initialize s
4: reward_value = 0
5: for t in range 200 do
6: if random number EPSILON then
7: choose action from s using policy derived from Q_table
8: else
9: choose random action
10: end if
11: take action and observe
12: get from Q_table
13: calculate = (
–
) /
14: if
MIN_REWARD RATE then
15: reward_value = HIGH_PENALTY
16:
17: else if
MIDDLE_REWARD RATE or
MAX_REWARD RATE then
18: reward_value = REWARD
19: = reward_value
20: else
21: reward_value = LOW_PENALTY
22:
23: end if
24: change with
from Q_table
25: if reward_value == REWARD then
26: break
27: end if
28: end for
29: EPSILON *= EPSILON_DECAY
30: end for
The pseudocode of the Q-Learning algorithm is as in Algorithm 1 and the key components of the algorithm are given in . The Q-Table has to be initialized with the shape of [number of states, number of actions]. Then, each episode is collected from the environment. Based on Q-Table, an action () is determined according to the state (
). Then, the agent performs the action. The reward function (
) measures the outcome of the action and determines the reward or penalty. Then, according to Bellman Equation in the Algorithm 1, the new
value is calculated and assigned to the Q-Table. From the second stage, this process continues iteratively until learning stops.
Table 1. Key notations for the Q-Learning algorithm.
3.2. Proposed dynamic pricing model
Algorithm 2 shows our proposed method that makes customized dynamic pricing based on Q-learning for the hospitality industry. In the proposed algorithm, instead of training models for each hotel separately, we express the hotels with comparable hotel features and perform a single model training with all hotel data. In this way, the Q-Table is created with the information obtained from the data of the hotels with different characteristics and densities. Therefore, while estimating the prices for hotels with fewer data, the data of other hotels with a similar structure is transferred and utilized. Also, since the hotels had similar profit rate patterns at similar times, the benefit from this pattern is maximized with transfer learning. In addition to these, the proposed model also provides a solution to the cold start problem since the algorithm can predict the list prices for hotels that have just entered the system.
The details of the proposed Dynamic Pricing Algorithm presented in Algorithm 2 are as follows:
Lines 5–10: For each sample, the algorithm takes an action from to the Q table or randomly (depending on the epsilon value) according to state.
Lines 11–12: After estimating the initial sale price according to this action decision
Line 13: In order to evaluate the listPrice, the reward value is calculated which has the emptyRooms parameter, and
Lines 14–23: It is compared with the hyperparameter REWARD RATE values. The aim here is to decrease listPrice if the hotel has more emptyRooms, and to increase the listPrice if the hotel has less empty rooms for increasing the profit rate.
Lines 23–29: According to the comparison, if an incorrect price prediction is made, a new Q value is calculated with the hyperparameter PENALTY value and added to the table, and the price is recalculated a maximum of 200 times. If a correct price prediction is made, the Q value is renewed with the reward value and the loop is broken. Therefore, when there is a sample input with similar state values, the algorithm learns which action should not be taken.
While creating the algorithm, first of all, the features of the hotel sales data were examined in detail, and the environment parameters and variables to be used in the RL algorithm were determined.
State Space is composed of four variables:
List Price of a hotel is obtained by dividing the total list price of each sales item in the sale dataset by feature Count as in EquationEqs. (1)
(1)
Purchase Price is calculated similarly (EquationEq. (3)
Competitiveness is found by summing five main hotel features with decimal values between 0 and 1. The reason for taking the sum of these features rather than using them separately is to obtain a smaller size Q-table and in this way to reduce the computation time. These five features, the details of which are presented in and the calculation of them is given in EquationEq. (4)
Rating corresponds to the hotel’s TripAdvisor rating, which can take a decimal value between 1 and 5.
Action Space: The actions on price are limited to three: +10%, constant, −5%. So, whatever the recommended price is, it can be balanced by actions. The Q-Table, the visualization of which you can find in , was started randomly so that three actions correspond to each situation.
Figure 2. Visualization of the Q-Table.
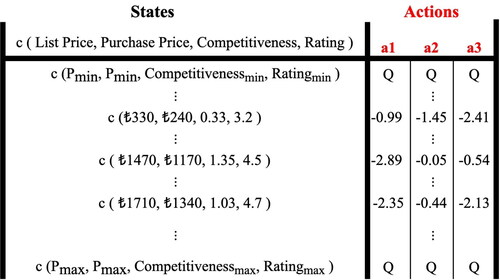
Table 2. Feature categories and the number of features in each category.
The lowest price (P_min) and the highest price (P_max) were utilized to identify the upper and lower bounds of List Price and Purchase Price features. It was assumed that the pricing system would not generate a price for out of this region. From P_min to P_max, the state space is partitioned into k discrete areas, where k defines the discrete area count ().
Reward Function for the Hospitality Industry: In e-commerce platforms, there is a relationship between the sale of a product and the demand for that product, e.g. very low demand for a product indicates low interest and a price reduction may be made. On the other hand, if the demand is quite high, the price can be kept constant or increased by targeting higher profit rates. In our study, we associate the uninterest of customers to a hotel i at a certain time t with the number of empty rooms and create a new reward function as in EquationEq. (5)
The main variables in the Proposed Algorithm were set both by examining the domain data & asking the experts and by applying a detailed hyperparameter tuning process.
LEARNING RATE (LR) = 0.1
DISCOUNT = 0.95
EPSILON = 0.4
EPSILON_DECAY = 0.998
LOW_PENALTY = −1
HIGH_PENALTY = −300
REWARD = 25
MIN_REWARD RATE = 1
MIDDLE_REWARD RATE = 10
MAX_REWARD RATE = 1000
INITIAL_PROFIT = rand(0,0.15)
4. Data preparation and experimental results
In this study, the dataset of a tourism company in Turkey, which includes daily sales and descriptive features for 1402 hotels covering the period between January 2013 and October 2021 was used. When this dataset, which has approximately nine years of sales data, was examined, it was discovered that it is quite sparse (sparsity rate = 0.95). The high sparse rate may be due to the decrease in the popularity of some hotels over time, or the decrease in the sales of the hotels through the tourism agency. In cases where the sparseness of the data is very high as in this dataset, ML algorithms cannot provide learning about different situations because they do not encounter a sufficient number of various samples. In line with the justifications, the number of target hotels and the sales time interval was narrowed, the period of the data was changed from daily to weekly average, and a sub-dataset with an acceptable sparsity rate (sparsity rate = ∼ 0.2–0.3) was formed.
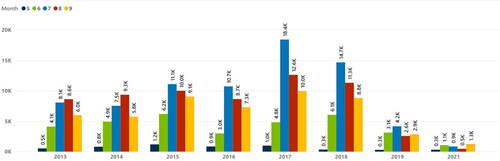
For this sub-data, which includes the sales records for 80 hotels only in the weeks [21, …, 37, 38] during the summer season when tourism is intense, the data for the summer of 2020 under the influence of the unexpected Covid-19 pandemic, which we can call an outlier season in tourism, has been removed. shows the total room-based demand for these 80 hotels, separated by years and months. As can be clearly seen from here, the effect of Covid-19 extended to 2021 as well, but this year’s data was kept in the dataset since it was effective in the total income with the increase in prices, although the demand seems low and it is seen as the beginning of the new normal after the worldwide pandemic.
Figure 3. Total room based demand of the all hotels by year & month.
After the data for 2020 was removed, we realized that 3 hotels that were recently added to the agency’s customer pool, which had almost no sufficient number of samples for several years, were eliminated and the dataset containing a total of 11088 samples for 77 hotels and eight years was obtained. After this stage, some data such as samples with more than 100% profit rate, which were seen as incorrect within the opinion of the expert in the tourism company, were also eliminated and the pre-processing stage was completed.
While deciding on main variable/hyperparameter values in the proposed algorithm, the dataset is examined, and hyperparameter tuning is applied. To be more detailed, the values that the reward rate variable (EquationEq. (5)(5)
(5) ) may take in the dataset were examined and the MIN_REWARD RATE, MIDDLE_REWARD RATE, and MAX_REWARD RATE values were decided based on the reward rate distribution in . The dataset was similarly examined for the value of the INITIAL_PROFIT variable and the distribution of it is given in . However, extra hyperparameter tuning studies were also carried out for this variable and its value was finally decided. For this INITIAL_PROFIT variable and the remaining variables, different model trainings are provided with the values in the hyperparameter space given in .
Figure 4. Reward rate distribution.
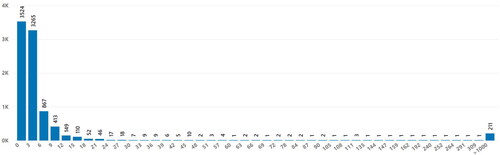
Figure 5. Profit rate distribution.
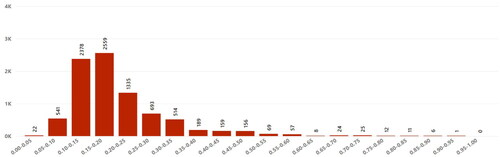
Table 3. Hyperparameter space for the proposed pricing model and their candidate values.
The proposed model was chosen from the candidate models by examining the reward-time step graphs belonging to the training phase while comparing with the similar studies in the literature and by comparing the Mean Absolute Percentage Error (MAPE) (EquationEq. (6)(6)
(6) ) scores of the test sets. In EquationEq. (6)
(6)
(6) ,
represents the actual value of the target variable, while
corresponds to the values found as a result of the prediction model.
(6)
(6)
In the following sub-sections, we present the experiments performed in this study and their results.
4.1. Comparison of methods
In order to observe the effect of the reward function we propose in EquationEq. (5)(5)
(5) , learning process of the model is compared with two different reward functions: the profit rate in EquationEq. (7)
(7)
(7) and the revenue conversion rate (rct) difference in EquationEq. (8)
(8)
(8) . The profit rate is frequently used in the literature (Kim et al. Citation2015; Vázquez-Canteli and Nagy Citation2019), and rct difference has recently been offered (Liu et al. Citation2018) as an alternative to profit rate for e-commerce platforms. We trained the models by using them separately in our dataset and observed the reward-time step graphics.
(7)
(7)
(8)
(8)
In EquationEq. (7)(7)
(7) , the profit rate of a hotel i at a given sales time t is calculated. On the other hand, in EquationEq. (8)
(8)
(8) that is based on time difference and user interests,
and
represent the total revenue of product i and the number of unique visitors viewed the product i between time step t and
respectively (Liu et al. Citation2018). For two cases with the same revenue but different
the case with less view value in the denominator is more desirable and rewarding as it can reach the same revenue with fewer views. Our data does not include web-log records of customers. For this reason, empty rooms were used to correspond to this parameter. Similarly, if the number of empty rooms in a hotel is high, it means that the interest in that hotel is low. In this part of the experiments, the test set was created with the last week’s sales data for each hotel in the dataset, and the rest of the data formed the training.
To observe also the effect of Q-Table size on the algorithm, sample state spaces of different sizes (18, 36, 60) were created. With these state spaces, model training was carried out for the three reward functions. The reward graphics based on time steps in training phase are presented for proposed reward function in and for reward function
in , c, e), for reward function
in , d, f). The results draw attention to the fact that the algorithm calculated fewer penalty cases as the number of samples in the discrete state space increased. In other words, better results are obtained as the discrete state space gets closer to the continuous space.
Figure 6. Offline evaluation for proposed reward function with different state space size.
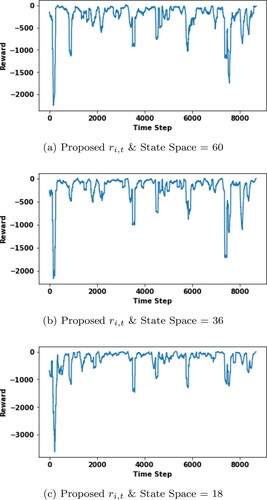
Figure 7. (a, c, e) Offline evaluation for reward function with different state space size. (b, d, f) Offline evaluation for reward function
with different state space size.
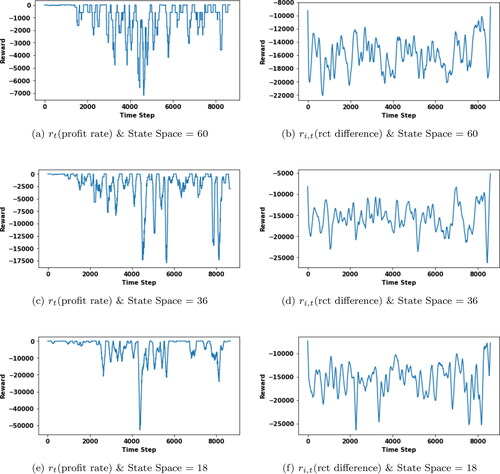
Additionally, we observe that our recommended reward function has very smooth reward transitions between timesteps and is more similar to desired exponential rise for all state space sizes compared to profit rate & rct difference reward functions. In dynamic pricing models for hotels, it is necessary to take into account that the price changes with the demand. Since the ‘‘profit rate’ reward function does not take into account the demand, it performs quite poorly compared to the new reward function we recommend. ‘‘rct difference’, on the other hand, is recommended for products in the e-commerce retail sector where aggressive changes in prices are not observed, and it is designed considering the profit rates between two consecutive time periods for many products such as shoes are similar. We think that the reason why the ‘‘rct difference’ did not perform well in our study is that hotel prices can increase aggressively during peak times such as July and August and decrease at the beginning and end of summer, that is, in May/September. Therefore, sudden price changes are observed between the price in May and the price in July/August, or between the price in July/August and September, and a reward function based on time difference is not suitable for hotel pricing. These results, which support our theory, once again revealed the need for a special reward function for the accommodation industry.
4.2. The impact of the period of the test data
For our proposed model, where we present the reward graph by time in , the test set was created with a total of 77 samples by taking the last week’s sales record of each hotel in the dataset. In this test set, although we expect to see test samples only for the last week of September 2021, there were also samples that coincided with the end of July or August. The reason for this is that some of the data that was eliminated during the preprocessing stage due to the incorrect registration may coincide with the last period of September 2021.
Considering the periodicity of tourism datasets and analysing the data we are working on, we created alternative test sets. The monthly distribution of the demand given in shows that the demand for tourism is intense, especially in July/August. Our test set, on the other hand, mainly includes samples from September, when tourism was stagnant. For this reason, it was deemed essential to test the model for July and August representing the peak season. In order to make a more controlled comparison, a test set was also created to include only the data for September, and the results are presented in in terms of MAPE score.
Table 4. MAPE Results of test sets representing different time periods.
The results show that the proposed model makes the best estimations with the lowest error values in the peak season of tourism, July and August, when the data is denser. On the other hand, the highest error value was observed in September when the data was more sparse.
In general, when compared to our initial test set ‘‘Last Record’, which mostly contains samples from September, the error value increased when sparsity increased and decreased when it decreased. These findings also emphasize once again the necessity of our studies on the data sparsity problem during the data preparation phase.
4.3. Necessity of information transfer between hotels
As we presented in Section 4.1, in the model we propose, the data of all hotels are trained together and the performance of the model is evaluated on the test set consisting of the last weekly sales data of each hotel. As a result of the experiments in Section 4.2, the fact that the forecasting model performed well, especially when the data was dense, brought to mind the thought of repeating the experiments only with hotels with high sales.
Since the model training for 77 hotels separately produces high error values due to the small number of hotel-based samples (162 per hotel), we performed an alternative model training on the data of 10 hotels belonging to the Side/Antalya/Turkey region with the highest sales in the dataset, to be fair in the comparison. The results are presented in in terms of MAPE score. Here, ‘Only ‘‘Side’ refers to the training process only with the hotels in that region and the test on 10 samples belonging to the last week of the hotels in Side. ‘Side’ in All’ refers to training with the dataset containing all hotels and testing for the same 10 samples. Lastly, ‘‘All Hotels’ refers to training with the dataset containing all hotels and testing for the 77 samples.
Table 5. Results comparison with the most dense region: ‘‘Side/antalya/Turkey’.
As can be seen in , the error value of the test results including ‘‘All Hotels’ is higher than the results of ‘Side’ in All’. Our model works better on data with low sparsity. The results also show that although it is aimed to reduce the sparsity rate for better prediction performances, the limit of this should be to obtain data with sufficient sample size and variety. Training with only Side region data shows ∼ 10% worse performance in terms of MAPE score compared to training with data including hotels also outside the region. Based on these findings, it is seen that expressing the hotels with competitiveness features in the model we propose not only solves the cold-start problem by allowing a new hotel to join the system easily but also improves the learning performance by transferring information from the samples of other hotels in cases where a hotel or region does not have enough variety and/or size of data for model training.
5. Managerial insight
Tourism agencies, hotels, customers, revenue managers, and local economies may benefit from this study by optimizing hotel room prices, maximizing occupancy rates, enhancing revenue, and improving the overall customer experience. Empty hotel rooms, unconsumed food on time, unsold transportation tickets, and many such tourism-related products pose a potential threat to financial sustainability as they cannot be stocked for future use (Law et al. Citation2019).
The dynamic pricing model takes care of the first of the two pillars of revenue management, price and demand. An accurate pricing model can support accurate demand forecasts. Hotel managers can use the predictions of the dynamic hotel room pricing model to anticipate demand fluctuations and adjust room rates accordingly to maximize occupancy rates while remaining competitive in the market.
Accurate and dynamic prediction of hotel room prices directly affects market demand and is crucial for the sustainability and growth of the tourism industry, as well as for governments in terms of policy formulation and organizational planning to develop reliable and competitive strategies in tourism (Ghalehkhondabi et al. Citation2019; Song et al. Citation2019). With a better forecasting methodology, policymakers and regulators can organize tourism facilities more effectively. Therefore, the primary goal of the dynamic hotel room pricing model is to assist destinations and tourism companies in providing constant supplies of tourism goods and services to meet the changing demand for travel experiences.
Hotels and tourism agencies can automate hotel room pricing decisions with the proposed model, reducing manual effort and operational workforce requirements, and thereby increasing efficiency. The proposed model can analyse factors such as booking trends and occupancy levels in real-time to dynamically optimize hotel room prices. This flexibility ensures that prices are aligned with current market conditions and helps maximize revenue.
Practitioners may encounter some difficulties when implementing an ML-based pricing model in the hotel industry. In order to keep the proposed model up to date, it is necessary to repeat the training of the model with new data added to the system at certain periods (e.g. six months, one year, …). With this repeated training, the model becomes more adaptable to the changing world conditions, and its success is directly related to keeping the data presented as input to the model up-to-date. For this reason, keeping hotel room sales data and hotel information in the system comprehensively, accurately and systematically, and eliminating problems such as data inconsistencies and missing values are essential for those who want to use the dynamic hotel room pricing model.
Integrating a new pricing model with existing systems and infrastructure can present technical complexities, compatibility issues, and data synchronization challenges. To overcome this, system managers need to engage information technology teams from the outset to ensure seamless integration. While integrating the model into the existing systems, first priority should be given to data security and privacy, complying with relevant regulations and industry best practices.
The proposed dynamic pricing model in this study uses only hotel sales data and hotel information. In any way, customer information data is not included in the system. Therefore, there is no form of discrimination or bias based on protected characteristics such as race, gender, religion, or nationality. Where the customer dataset is included in the model, research needs to be conducted to ensure compliance with GDPR (General Data Protection Regulation).Footnote1
Moving from traditional pricing strategies to a ML approach may encounter resistance. Practitioners should be informed to build understanding and confidence in the new pricing model. The benefits of the model can be communicated, success stories can be demonstrated, and examples of how human expertise can complement machine learning capabilities can be shared.
It is important to involve stakeholders, revenue managers and decision makers from the early stages of implementation. The model proposed in this study is one of the outputs of our one-year research project that we were working on. The studies carried out during the project were carried out jointly by holding regular meetings with a team formed by the tourism agency. While creating the team, care was taken to bring together people from different departments, from the data manager to the operation staff who will use it.
6. Conclusion and future works
In this study, we propose a new dynamic room pricing model for the hospitality industry by formulating the problem as RL. The proposed model makes use of the Q-learning algorithm and gets ahead of the existing RL models with the reward function, which is defined specifically for the hospitality industry and takes both demand and profit into account.
In our solution, the general features of the hotels are digitized and used in a way to allow the comparison of the hotels. Thus, the cold-start problem that arises when a new hotel is added to the system is avoided by making use of similar hotel sales examples. Model training using this representation and sales data of all hotels in the system enables more accurate price estimation by providing information transfer from similar hotels for hotels with less variety in the dataset.
For future studies, we would like to observe the effect of different features on dynamic hotel room pricing using new data such as customer information, weather conditions, financial data, demographic data etc. In addition, it is aimed to observe the performance of the prediction model in real practice with online A / B tests and to develop the model according to the feedback obtained from the tests.
Acknowledgements
We’re thankful to the members of Setur Information Technologies and Research & Development Center for providing the hotel and sales data used in this study.
Disclosure statement
No potential conflict of interest was reported by the authors.
Correction Statement
This article has been corrected with minor changes. These changes do not impact the academic content of the article.
Notes
References
- Ban GY, Keskin NB. 2021. Personalized dynamic pricing with machine learning: high-dimensional features and heterogeneous elasticity. Manage Sci. 67(9):5549–5568. doi:10.1287/mnsc.2020.3680.
- Chai D, Wu W, Han Q, Wu F, Li J. 2020. Description based text classification with reinforcement learning. In International Conference on Machine Learning, PMLR, p. 1371–1382.
- Ferrara M. 2018. [A reinforcement learning approach to dynamic pricing]. [dissertation]. Politecnico di Torino.
- Ferreira KJ, Lee BHA, Simchi-Levi D. 2016. Analytics for an online retailer: demand forecasting and price optimization. M&SOM. 18(1):69–88. doi:10.1287/msom.2015.0561.
- Garcıa J, Fernández F. 2015. A comprehensive survey on safe reinforcement learning. J Mach Learn Res. 16(1):1437–1480.
- Ghalehkhondabi I, Ardjmand E, Young WA, Weckman GR. 2019. A review of demand forecasting models and methodological developments within tourism and passenger transportation industry. JTF. 5(1):75–93. doi:10.1108/JTF-10-2018-0061.
- Gibbs C, Guttentag D, Gretzel U, Yao L, Morton J. 2018. Use of dynamic pricing strategies by airbnb hosts. IJCHM. 30(1):2–20. doi:10.1108/IJCHM-09-2016-0540.
- Greenstein-Messica A, Rokach L. 2020. Machine learning and operation research based method for promotion optimization of products with no price elasticity history. Electron Commerc Res Appl. 40:100914. doi:10.1016/j.elerap.2019.100914.
- He QQ, Wu C, Si YW. 2022. Lstm with particle swam optimization for sales forecasting. Electron Commerc Res Appl. 51:101118. doi:10.1016/j.elerap.2022.101118.
- Javed HT, Beg MO, Mujtaba H, Majeed H, Asim M. 2019. Fairness in real-time energy pricing for smart grid using unsupervised learning. Comput J. 62(3):414–429. doi:10.1093/comjnl/bxy071.
- Jiaqi Xu J, Fader PS, Veeraraghavan S. 2019. Designing and evaluating dynamic pricing policies for major league baseball tickets. M&SOM. 21(1):121–138. doi:10.1287/msom.2018.0760.
- Jin B, Cruz L, Gonçalves N. 2020. Deep facial diagnosis: deep transfer learning from face recognition to facial diagnosis. IEEE Access. 8:123649–123661. doi:10.1109/ACCESS.2020.3005687.
- Jin B, Cruz L, Gonçalves N. 2022. Pseudo rgb-d face recognition. IEEE Sensors J. 22(22):21780–21794. doi:10.1109/JSEN.2022.3197235.
- Jun W, Jinzhou Z. 2022. Q-learning based radio resources allocation in cognitive satellite communication. In 2022 International Symposium on Networks, Computers and Communications (ISNCC), IEEE, p. 1–5.
- Kim BG, Zhang Y, Van Der Schaar M, Lee JW. 2015. Dynamic pricing and energy consumption scheduling with reinforcement learning. IEEE Trans Smart Grid. 7(5):2187–2198. doi:10.1109/TSG.2015.2495145.
- Law R, Li G, Fong DKC, Han X. 2019. Tourism demand forecasting: a deep learning approach. Ann Tourism Res. 75:410–423. doi:10.1016/j.annals.2019.01.014.
- Li X, Law R, Xie G, Wang S. 2021. Review of tourism forecasting research with internet data. Tour Manage. 83:104245. doi:10.1016/j.tourman.2020.104245.
- Liu J, Zhang Y, Wang X, Deng Y, Wu X, Xie M. 2018. Dynamic pricing on e-commerce platform with deep reinforcement learning. arXiv preprint arXiv:191202572.
- Lu R, Hong SH, Zhang X. 2018. A dynamic pricing demand response algorithm for smart grid: reinforcement learning approach. Appl Energy. 220:220–230. doi:10.1016/j.apenergy.2018.03.072.
- Maestre R, Duque J, Rubio A, Arévalo J. 2019. Reinforcement learning for fair dynamic pricing. In Intelligent Systems and Applications: Proceedings of the 2018 Intelligent Systems Conference (IntelliSys) Volume 1 (pp. 120–135). Springer International Publishing.
- Maoudj A, Hentout A. 2020. Optimal path planning approach based on q-learning algorithm for mobile robots. Appl Soft Comput. 97:106796. doi:10.1016/j.asoc.2020.106796.
- Montazeri M, Kebriaei H, Araabi BN. 2020. Learning pareto optimal solution of a multi-attribute bilateral negotiation using deep reinforcement. Electron Commerc Res Appl. 43:100987. doi:10.1016/j.elerap.2020.100987.
- Paiva BB, Nascimento ER, Gonçalves MA, Belém F. 2022. A reinforcement learning approach for single redundant view co-training text classification. Inf Sci. 615:24–38. doi:10.1016/j.ins.2022.09.065.
- Sahu B, Das PK, Ranjan Kabat M. 2022. Multi-robot cooperation and path planning for stick transporting using improved q-learning and democratic robotics pso. J Comput Sci. 60:101637. doi:10.1016/j.jocs.2022.101637.
- Song H, Qiu RT, Park J. 2019. A review of research on tourism demand forecasting: launching the annals of tourism research curated collection on tourism demand forecasting. Ann Tour Res. 75:338–362. doi:10.1016/j.annals.2018.12.001.
- Sutton RS, Barto AG. 2018. Reinforcement learning: an introduction. MIT Press.
- Taleizadeh AA, Safaei AZ, Bhattacharya A, Amjadian A. 2022. Online peer-to-peer lending platform and supply chain finance decisions and strategies. Ann Oper Res. 315(1):397–427. doi:10.1007/s10479-022-04648-w.
- Taleizadeh AA, Varzi AM, Amjadian A, Noori-Daryan M, Konstantaras I. 2023. How cash-back strategy affect sale rate under refund and customers’ credit. Oper Res Int J. 23(1):19. doi:10.1007/s12351-023-00752-2.
- Vázquez-Canteli JR, Nagy Z. 2019. Reinforcement learning for demand response: a review of algorithms and modelling techniques. Appl Energy. 235:1072–1089. doi:10.1016/j.apenergy.2018.11.002.
- Wang M, Deng W. 2020. Mitigating bias in face recognition using skewness-aware reinforcement learning. In: 2020 IEEE/CVF Conference on Computer Vision and Pattern Recognition (CVPR), IEEE. p. 9319–9328. doi:10.1109/CVPR42600.2020.00934.
- Ye P, Qian J, Chen J, Wu C, Zhou Y, De Mars S, Yang F, Zhang L. 2018. Customized regression model for airbnb dynamic pricing. In: Proceedings of the 24th ACM SIGKDD International Conference on Knowledge Discovery & Data Mining, p. 932–940. doi:10.1145/3219819.3219830.
- Zheng Q, Tian X, Yang M, Wu Y, Su H. 2020. Pac-bayesian framework based drop-path method for 2d discriminative convolutional network pruning. Multidim Syst Sign Process. 31(3):793–827. doi:10.1007/s11045-019-00686-z.
- Zheng Q, Zhao P, Li Y, Wang H, Yang Y. 2021a. Spectrum interference-based two-level data augmentation method in deep learning for automatic modulation classification. Neural Comput Appl. 33(13):7723–7745. doi:10.1007/s00521-020-05514-1.
- Zheng Q, Zhao P, Zhang D, Wang H. 2021b. Mr-dcae: manifold regularization-based deep convolutional autoencoder for unauthorized broadcasting identification. Int J Intell Sys. 36(12):7204–7238. doi:10.1002/int.22586.