
ABSTRACT
Home-school transport is an expensive component within many education systems, and is particularly costly in countries where school choice is encouraged. Within divided societies like Northern Ireland, a combination of school choice, academic selection and a divided society results in educational divisions which pose an even larger problem for the provision of home-school travel. This paper uses a Geographical Information System to analyse and quantify the additional costs of home-school transport in Northern Ireland. The additional travel undertaken in a complex educational structure is calculated and the pressing economic and environmental costs are estimated, alongside the less easily quantified social impact. The impact is considerable on all of these measures, strengthening the case for a radical review of educational provision in Northern Ireland. Removing duplication and reducing unnecessary choice would produce a more efficient and less costly system of education, while also contributing to increased social cohesion.
Introduction
Home-school transport is an essential but expensive component of many education systems. Costs can be particularly high in countries where there is greater school choice. Where neighbourhood schools are not commonplace in the educational landscape, further distances are travelled (De Boer Citation2005). Perceived inequities in funding of public schooling (Sinclair and Brooks Citation2022), the source of that funding (Ponzini Citation2022) and insufficient funding for schools (Fewell, Hess, and Lowery Citation2019) have been the cause of considerable debate; in some instances, there is evidence of school leaders having to develop their entrepreneurial skills to supplement their schools’ income (Mamabolo Citation2020). As home-school travel is a significant proportion of the education budget in many countries, it is important to minimise that expenditure and to ensure that unnecessary travel is reduced or eliminated.
Within divided societies like Northern Ireland (NI), the combination of school choice, academic selection and a divided society results in educational divisions which pose an even larger problem for the provision of home-school travel, a feature identified by Smyth and Kelleher (Citation2011), and explored further by Thornthwaite (Citation2014, Citation2016) and Kelleher, Smyth, and McEldowney (Citation2016). Since that original research, the educational landscape has continued to change in NI with the slow shrinkage of the school estate. Overall school numbers in NI declined from 1159 in 2016/2017 to 1134 in 2020/2021 (DENI Citation2021a). Additionally, opportunities to map journeys to school, or the proxies of those journeys, are now possible with previously unused data about school transfer at age 11. This allows more recent calculations of the economic and environmental costs of additional travel in a complex educational structure to be made, alongside the less measurable but very important social costs. This paper builds on the original research using a Geographical Information System (GIS) to map, analyse and quantify the additional costs of home-school transport, particularly economic and environmental, within a divided society. In NI, education spending per pupil fell from around £6,100 in 2011–2012 to £5,450 in 2018–2019 (2019–2020 prices), the lowest in the UK regions (Institute of Fiscal Studies Citation2019). Schools in NI are increasingly running into problems with their allocated budgets, with more than a third of them in deficit, double the proportion of five years before. The Auditor General has said that schools in NI are close to a financial tipping point (Meredith Citation2018).
This paper will present the context of the divided society in NI, and the potential impact of that on travel costs. There will then follow a description of the GIS methodology used in this study with the results displayed graphically. The findings and their potential impact on NI in terms of financial and environmental costs are then discussed and a less complex model of school provision is recommended.
In England and Wales in 1944, the Butler Act extended compulsory, free education to children up to fifteen years old and established a tripartite system of secondary modern, grammar and technical schools. That system also instigated free home-schoolFootnote1 transport for those learners geographically distant from their schools. Since the principle of state-provided school travel for those who qualify was first established, the educational landscape has transformed. Additionally, the transport infrastructure and the number of vehicles on the roads has changed considerably.
Home-school transport was introduced slightly later in NI, following its 1947 Education Act. While largely mirroring the 1944 legislation, NI retained long-established community/ethnosectarian divisions between schools, some of which are largely Catholic and others which are State, but de facto largely Protestant (Gardner Citation2016). The 1947 reform resulted in the provision of selective and non-selective schools for each tradition in NI, and academic selection is still the norm there, despite having been largely abandoned in England and Wales (Roulston and Milliken Citation2021). Current home-school transport policy in NI has remained generally unchanged for over 20 years although state provision of home-school transport to eligible learners is currently under review. Pupil numbers are forecast to grow slowly in NI (DENI Citation2021b) and, if the existing policy on school transport were continued, it has been estimated that the numbers of those eligible for state-provided transport would increase by around 8% each year, adding an additional £7 million to central education costs annually (DENI Citation2019a). State-funded home-school transport already costs the state at least £81 million each year (DENI Citation2019b). The costs to parents for unfunded home-school transport, while unavailable, are likely to be high also.
We will examine the case for funding transport to school for some learners, and how this is addressed internationally. We will then focus on NI and estimate how much additional travel, with its associated costs, is likely as a result of the divided nature of NI schooling.
Challenges of school transport
A policy of increased school choice has been implemented in many countries across the globe as part of a drive towards neoliberal reform of public services, including schools (see Hill and Kumar Citation2012). Underpinned by the ideas of economic theorists such as Friedman (Citation1962), proponents of these reforms argue that choice creates competition which, in turn, increases quality. Operating in a competitive market for students, those schools which attract the most students receive greater funding. This opened access to a wide range of schools for learners. It was believed that applying market principles, including competition, to public services such as education, would make quality improvements inevitable. However, these neoliberal assumptions have long been challenged (Braithwaite Citation2017; Klees Citation2008; Ross and Gibson Citation2007), and any supposed benefits from increasing school choice are hotly contested (Bunar Citation2010). For instance, the imposition of market forces in education has been blamed for increased social segregation (Saporito Citation2003) and educational inequalities (Rowe and Lubienski Citation2017).
Nonetheless, these neoliberal policies are having a considerable impact on marketising education and normalising school choice (Angus Citation2015). One incidental impact of offering school choice is on the cost of centrally funded school transport as increasing competition leads to a shift away from neighbourhood schools, with a consequent increase in the distances that children and young people travel to school (McDonald Citation2007). There are reports that ‘state-funded home-school transport is under considerable strain in England as it is in other countries with market-oriented schooling systems’ (Gristy and Johnson Citation2018, 184) and challenges are also cited for the USA, Sweden and Australia. While some suggest that additional school choice is illusory for many parents and children, accessible only to an already privileged portion of the potential school enrolment (Henderson Citation2020; Roulston and Cook Citation2021), regardless, providing ‘choice’ adds to costs of state-provided home-school transport. For example, school transport in the USA accounts for 4.2% of all educational spending (cited in McDonald et al. Citation2016).
While home-school travel may be provided by the state, there are other options for attending school. The use of active modes of travel to schools (ATS), such as walking or cycling, has decreased across the developed world, dropping from almost half of all home-school journeys to less than 13% over 40 years (Mandic et al. Citation2017). This has contributed to a loss of physical activity for many children and young people, increasing health concerns particularly in relation to obesity (Andersson, Malmberg, and Östh Citation2012). It has also been argued that participation in physical activity is associated with increased academic performance, and thus reliance on cars or school buses and a reduction in ATS may have a negative impact on learners’ academic development (Van Dijk et al. Citation2014). Innovative solutions have been suggested including changing urban structures to encourage more ATS (Han, Xu, and Sabel Citation2020), developing a more active community culture and improving school-community links (Smith et al. Citation2020) and improvements to streetscapes (Oliver et al. Citation2015).
Home-school trips may also involve transport other than that provided officially and, alongside the decrease in ATS, home-school transport using personal vehicles has increased. In their literature review, Rothman et al. (Citation2018) were able to chart the decline of ATS in the USA while others highlight the scale of private transport use for home-school travel:
Americans drove 30.0 billion miles and made 6.6 billion vehicle trips taking students to school and picking them up from school in 2009. This accounted for 1% of annual VMT [vehicle miles travelled] in the country (McDonald et al. Citation2011, 147).
Indeed, McDonald et al. suggest that up to 14% of travel in the USA during the morning peak can be attributed to home-school travel. They estimate the cost to be at least $2 billion, with an additional time cost of $3 billion (McDonald et al. Citation2011). The resultant increased traffic volumes have a knock-on impact on levels of pollution which, again to use the USA as an example, has generated a cost estimated at $120 million each year for trips specifically to ferry children to and from school (McDonald et al. Citation2016). Falling ATS and growing private vehicle use for home-school travel is not unique to the USA, having been documented in many high-income countries such as in England (Easton and Ferrari Citation2015), Finland (Broberg and Sarjala Citation2015) and New Zealand (Smith et al. Citation2020). There is also growing evidence of a similar transition happening in some low- or medium-income countries. Sarmiento et al. (Citation2015) cite studies of declining ATS in Brazil, China, Mozambique and Vietnam, and some studies are emerging suggesting that COVID-19 has precipitated a further drop in ATS (Nguyen et al. Citation2021).
Travel to school in Northern Ireland
In this case study, we will look at NI and the patterns of home-school travel there. While politically part of the United Kingdom, NI has a history of deep-rooted ethnosectarian social divisions. Often reduced to the labels ‘Catholic’ and ‘Protestant’, these are reflected in segregated housing and a divided education system (Roulston et al. Citation2017; Shirlow Citation2016). All schools in NI teach the same curriculum and prepare pupils for the same examinations. Teacher qualifications in all schools are very similar and pay scales and professional school structures are identical. Nonetheless, most schools are either ‘state’, but de facto Protestant, or Catholic (Gardner Citation2016) and children are, for the most part, separated into schools according to community background from three years of age (Roulston and Cook Citation2020). Additionally, attendance at most secondary schools is decided by academic selection, with children being separated at age 11 into grammar and non-grammar schools. Many consider this to be a social class division as much as reflecting academic merit (Brown et al. Citation2021, 99). Another category of school, Integrated, caters for 7% of NI’s school children, explicitly setting out to educate children from both communities together. There are other school types also (see ) and, as Gallagher (Citation2021) notes, ‘Northern Ireland has the smallest school population in the United Kingdom, yet its structural design is amongst the most complex’ (2021, 147).
Table 1. NI school types and community enrolment, 2019/2020.
Despite these educational divisions, NI experiences pressures on home-school transport similar to elsewhere and, as with so many places across the world, car dependency is increasing. In fact, as the average person makes 81.5% of all journeys by car in NI, the dependency on private vehicles is higher there than in the UK as a whole, in which the equivalent figure is 63%. In the Republic of Ireland just over 50% of all journeys are undertaken by car (cited in McKibben Citation2011). Home-school travel in NI mirrors increased car dependency in the wider population and car journeys for home-school travel by primary school pupils increased from 59% in 2013/14 to 68% in 2019/2020, while walking to school declined from 31% to 19% over the same period. In secondary schools, the changes have been less dramatic, but car use still increased by 3% to 33%, while walking declined by 5% to 17% during the same period (Department for Infrastructure Citation2020). It has been estimated that 20% of cars on NI’s roads during the morning peak traffic are involved in home-school travel, and school start and finish times are also the peak times for road accident rates for children according to the National Travel Survey (House of Commons Citation2004). One reason, specific to NI, which may further reduce active travel to school is sectarianism (Kilkelly et al. Citation2004, 132), reported to be a particular problem for primary school-aged pupils (Kamruzzaman and Hine Citation2013, 84). Schoolchildren in NI wear school uniforms which, in an education system largely divided along ethnosectarian lines, are a fairly reliably identifier of the community to which a young person belongs (Roulston et al. Citation2017). To protect them, there appears to be a greater propensity for parents to accompany children even on quite short trips, which would account for a high proportion of home-school escort journeys. In NI, 15% of all journeys were for this purpose, an increase from 12% in 2005–2007 (Department for Infrastructure Citation2017, 23).
At present state-provided school travel is offered to the nearest suitable school (as defined by management type and governance) to a child’s home, where the distance by foot is greater than three miles for children over eleven years of age and two miles for children of eleven and under. However, whether these distances are still appropriate continues to be disputed and a review of school transport in NI is currently underway. There is a concern that some low-income families who live just within the two- or three-mile limits, and thus do not qualify for state-provided transport, cannot afford bus fares (Kilkelly et al. Citation2004, 14).
The complex series of school types in NI, often with overlapping catchments, has an impact on home-school travel. Hine (Citation2009) expresses it succinctly
… in Northern Ireland the picture [of home-school transport] is more complicated due to the larger number of school management arrangements and the sectarian divide which have placed additional demands on the system in terms of meeting the requirement of ‘nearest suitable school’. (Hine Citation2009, 32)
The current eligibility criteria for home-school transport allows parents of secondary-aged children, living more than three miles away from school provision for which the result of academic selection has suggested they might be accepted, and/or which matches their preferred community background, to choose state-provided school transport to any school of that type, no matter how far away (Smyth and Kelleher Citation2011, 3), thus permitting even greater home-school travel distances. For example, if deemed eligible for free home-school transport to attend a Controlled Grammar school, that eligibility applies to attend not just the nearest Controlled Grammar school, but any school of that kind.
The complexity and divisions within the education system in NI might help to account for the proportion of learners receiving home-school travel funding: 29% of pupils are eligible. While some make alternative arrangements, ‘11% of primary and nearly half (46%) of all secondary pupils receive transport assistance’ (Thornthwaite Citation2014, 42). In 2004, when comparable figures were last available, only around 20% of Scottish and 18% of Republic of Ireland pupils qualified for government funding for home-school transport, while the figure for NI pupils was 30%, falling only a little to 29% in 2013 (Kelleher, Smyth, and McEldowney Citation2016, 203).
Over the years, various estimates have been made of the cost of home-school travel in NI. Reportedly £65 million in 2007/2008 (up from £57 million in 2002/2003), it was 5% of NI’s Education Budget that year (Hine Citation2009). In 2014, it had been ‘conservatively’ estimated that the recurrent cost of home-school transport in NI was £100 million, having risen at twice the rate of inflation over the previous two decades and requiring 4% of the Education Budget each year (Thornthwaite Citation2014, 4). The NI Department of Education website suggest that they ‘ … currently fund daily transport assistance to around 84,000 pupils at an annual cost of approximately £81 million per year’ (DENI Citationn.d.), but it is not clear whether this is solely running costs or includes capital investment.
One contributor to the apparently high cost of home-school transport is the divided nature of the education system. The additional cost of home-school travel resulting from academic selection and segregation by religious affiliation was estimated to be £16 million each year (Smyth and Kelleher Citation2011, 3). When examining just secondary schools, they reported that the removal of religious segregation would result in a ‘huge decrease in the numbers receiving fully subsidised home to school transport, generating substantial savings for the school transport budget’ (Smyth and Kelleher Citation2011, 12), as children would be able to attend a school closer to them that currently caters for the ‘other’ community. Kelleher, Smyth, and McEldowney (Citation2016) performed a proximity analysis with ten Belfast schools and, while they acknowledge that the results may be representative only of the more urbanised east of NI, their modelling of the potential removal of segregation by gender, academic ability or religion indicated a considerable impact on the amount of home school travel. For example, the proportion of pupils in Maintained schools who would be eligible for state-provided home-school travel would fall by 38% to just 1.8%. Similarly, if academic selection were to be ended but schools remained segregated by religion, the proportion of pupils eligible for state-provided home-school transport would fall by up to 49%. If the education system in NI were to move away from both segregation by religion and academic selection, only 4.3% of pupils would require state-provided home-school transport support (Smyth and Kelleher Citation2011, 11). Combining academic selection and community segregation alongside an apparent increased choice for parents ‘ … generates complex patterns of home to school journeys, an outcome which government has to accommodate in terms of providing school transport and funding for so called “eligible” pupils’ (Kelleher, Smyth, and McEldowney Citation2016, 203). They calculated that selection and segregation add an additional $28million (£20million) to home-school transport costs. Thornthwaite (Citation2014) reported the current average distance travelled to school by NI pupils as 5.11 miles. Were selection not a feature of the system, the average distance travelled to school would reduce to 3.03 miles while, in a fully inclusive, all-ability system with pupils attending the nearest secondary school to their home, the average mileage travelled would reduce to 2.34 miles (Thornthwaite Citation2014).
While providing home-school transport for learners in NI incurs a system cost, ultimately funded by taxpayers, there are also private costs for the families of those learners who travel to school without using the subsidised bus and other travel options provided by the Department of Education, or who are ineligible because they live within two or three miles of their schools. Many of these pupils travel to school by private vehicle, and this necessarily incurs costs related to running and maintaining a vehicle, but also the less easily costed but impactful effects on society related to increased congestion, pollution and wasted time.
This paper aims to identify and quantify patterns of travel to secondary schools and to isolate the additional travel required by a system which is influenced by segregation, academic selection and school choice. A network analysis using a Geographic Information System (GIS) will be undertaken to develop the work of Thornthwaite (Citation2014) and that of Kelleher, Smyth, and McEldowney (Citation2016). While both these sources refer to GIS, they seem not to have relied on detailed mapping of pupil movement, or proxies of that movement. While the focus is NI, and its particularly complex educational structures, similar issues are faced in other countries where there is choice in educational provision. The wider the choice, or the greater the complexity of provision, the more impact this may have.
Methodology
Data showing households in NI which have young people of school age are not publicly available, nor are the schools which they attend, and the NI Education Authority (EA) could not provide pupil residence data for this research for child protection reasons. However, while not in the public domain, data on the feeder primary schools for each secondary school together with the number of pupils who transferred between the schools in 2019 were provided. While the home location of each of these transferring pupils was not available for this research, it seems reasonable to assume that each primary school would draw their pupils from the surrounding area and thus would be located fairly centrally within its catchment. Making that assumption, the location of the primary school has been used as a proxy for the pupils’ homes. While it should be emphasised that the journeys being analysed here are not actual pupil journeys, their lengths should be comparable in terms of overall distances travelled. Data for just under 8% of the pupils were excluded from the analysis due to data quality issues, including excessive travel distances suggesting the relocation of households around the time of transfer from primary to secondary, pupils moving to NI from elsewhere, and home schooling at primary level.
ArcGIS Pro ‘closest facility’ network analysis was used to model the shortest road distance between each primary school and its nearest secondary school (using Ordnance Survey Northern Ireland’s large-scale road network), and to produce an origin-destination (OD) matrix of distances between all primary and all secondary schools. Education Authority data on pupil numbers transferring from each primary to the destination secondary schools was joined to the OD matrix, and the total distance travelled daily by the cohort of Year 8 pupils was modelled as the sum of distances from feeder primary to destination secondary school, multiplied by the number of pupils transferring from feeder primaries to each secondary, multiplied by two (to represent a return journey). Theoretical minimum total travel distances were modelled using the same EA data on pupil numbers, based on them transferring to their closest secondary school, as well as the total travel distances were pupils to travel to the closest secondary school of comparable management type (i.e. pupils from Maintained primaries travelling to the nearest Maintained non-grammar or Voluntary grammar with a Catholic ethos, and those from Controlled primaries travelling to the closest Controlled non-grammar or grammar with a non-Catholic ethos).
Results and discussion
shows the average distances between primary schools and different categories of secondary school, illustrating the potential impact of an education system separated both by community division and academic selection. The average distance from primary schools to the nearest secondary school is only 2.78 miles, but this increases to 3.62 miles if only distances from primaries to the nearest secondary school of the same type are included (i.e. between Maintained primaries and Maintained secondaries, and similarly with Controlled, reflecting community division). This would be the most common scenario as most learners transfer to secondary schools which accord with their community background. When the impact of academic selection is modelled, the average distance from a primary school to a grammar is over 5 miles. Applying the same analysis to the data on transfers from feeder primary schools, the average distance between primary and secondary schools to which pupils actually transfer is 6.61 miles. Some of this increased distance may be a feature of choice being exercised by parents and pupils, but much of it is a consequence of academic selection and the much larger distances travelled to attend grammar schools, compounded with the additional travel to a school which fits the community orientation of the parent and pupil, as Smyth and Kelleher (Citation2011) noted.
Table 2. Average distances between feeder primary and secondary schools (miles).
The average distances between primary and secondary schools shown in are likely to be a little higher than the average distances actually travelled by pupils, as rural primary schools will tend to have smaller classes but greater distances to the nearest secondary. However, the data on pupil transfers provided by the Education Authority can be used to address this potential bias, since the count of pupils transferring from feeder primary schools to each secondary school can be combined with data on distances from each primary to the closest secondary to estimate the cumulative impact of the additional travel for this year group. Using the distance to each secondary school from its feeder primaries as a proxy for home-school travel, the total return travel distance is almost 192,000 miles each day for these pupils (). This compares with a theoretical minimum of just under 86,000 miles, were the pupils to attend their closest secondary school instead. Each pupil in this year group is estimated to have travelled, on average, 4.85 miles more each day than if they attended their nearest secondary school.
Table 3. Total distances between feeder primary and secondary schools based on 92.3% of Year 8 transfers 2019–2020 (miles).
Based on this daily estimated ‘excess’ travel, each pupil will, on average, travel nearly 900 miles more each year than if they attended their closest secondary school (assuming an attendance of 185 days out of a school year of 190 days). Aggregating this for all secondary pupils (145,085 in 2019/2020), we estimate over 130 million miles excess travel each year to accommodate school choice, academically selective schooling and community segregation at the secondary level. It is worth emphasising that this distance represents travel which would not take place were pupils to attend the nearest secondary school to their primary school.
Calculating any impact of this additional mileage is speculative, as there are many factors involved. This is particularly so when the costs of fuel are so volatile. Additionally, while we can be reasonably sure of the scale of the additional mileage, for short journeys some pupils may choose to walk or cycle. Even if a vehicle is used, a proportion of home-school trips may be undertaken by multiple learners in combined family or friendship groups. In other cases, some trips might involve private vehicles while others may use school transport and so on. However, we know that 33% of journeys to school were by car in 2019/2020 (Department for Infrastructure Citation2020, 10). While car journeys may be over-represented in longer trips, it seems reasonable to estimate the costs of the additional travel by car. An insurance organisation, NimbleFins (Citation2022), report that an average car has a running cost of £0.47 per mile, assuming a cost of £1.60 for a litre of petrol. If 33% of the additional 130 million miles of travel were individual journeys by car, this would equate to a cost of £20.4 million to those car owners per year, which may be an underestimate given that cars may predominate on longer journeys.
The additional carbon produced by the excess mileage can also be estimated. This is complicated by the fact that emissions continue to be reduced in newer cars. The average car in the UK is 8.4 years old (RAC Citation2021) and the Vehicle Certification Agency in the UK estimates that a 1.6 L Ford Focus car, a medium sized vehicle, registered in March 2013 emits 132 grammes of CO2 per kilometre (212 g/mile) travelled (Vehicle Certification Agency Citation2022). If 33% of these additional miles were using private cars with only one pupil being carried, they would generate over 9,000 tonnes of carbon dioxide each year.
For secondary-aged pupils in NI, the proportion travelling to school by bus in 2019/2020 was 48%. Thus, it is possible to estimate the carbon emissions produced by that excess travel. In 2014, UK buses emitted 0.0891 kg of CO2 per passenger-kilometre, the equivalent of 0.1434 kg per passenger-mile (National Atmospheric Emissions Inventory Citation2014). If we assume that bus travellers travelled the average distance (likely to be an underestimate) this corresponds to 68 million passenger miles, emitting almost 10,000 additional tonnes of carbon each year.
Mapping home-school travel
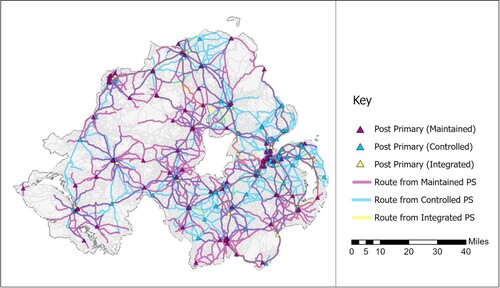
Mapping travel from feeder primaries to secondary schools illustrates the potential routes that pupils may travel as they navigate complex and overlapping catchments, often passing several secondary schools to attend one which matches their community preference, to reach an academically selective school, or merely exercising school choice. Map 1 shows the shortest distances by road between primary schools and the secondary schools to which these pupils transferred in 2019. The three colours represent three main school types: Maintained, Controlled and Integrated.
Map 1. Linkages between primary schools and those secondary schools to which pupils transferred in 2019.
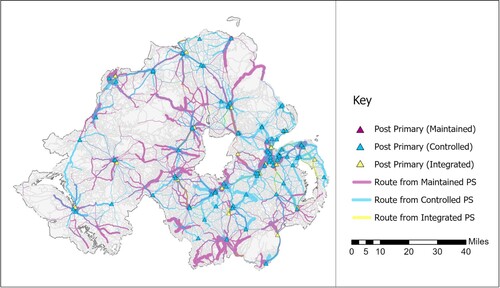
Map 2 shows the same information but with the lines plotted proportionally to the number of pupils transferring along each of the routes mapped. This indicates that there are some long journeys made by relatively large numbers of these eleven-year-old children. These journeys will be replicated by older pupils as well as they travel from their homes located around their former primary schools to their secondary schools. The largest single transfer to one secondary school from a single primary school was 84 pupils: it may be no coincidence that this was to one of NI’s rare non-selective, all-ability secondary schools. Illustrative of the diversity and duplication within the system, rather than the bulk of primary school pupils transferring to their neighbourhood secondary school, the options are so great that commonly a primary school may be a feeder school for over 10 secondary schools; in one Belfast primary its 78 pupils transferred to 22 different schools across the city.
Map 2. Linkages between primary schools and those secondary schools to which pupils transferred in 2019, shown proportional to the numbers involved.
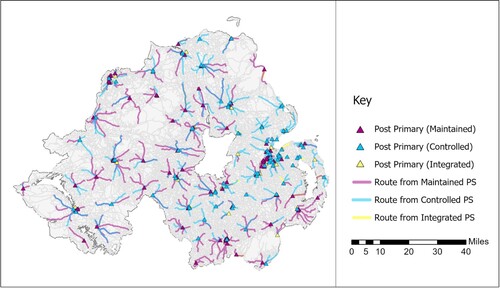
Map 3, on the other hand, shows the patterns which would occur if pupils were to transfer at age eleven to their nearest secondary school, regardless of community affiliation or academic selection. In this scenario, the patterns of movement from primary schools to these secondary schools are much simplified and distances travelled much reduced, for individuals and as a whole. It results in a more logical set of catchments servicing what would be all-ability, neighbourhood schools. It is notable in this scenario that only a minority of schools have feeder primaries which would just be from one community – the vast majority would have feeder primaries representing both communities, thus having the benefit of contributing to the development of inclusive mixed community schools in most cases.
Map 3. Linkages between primary schools and the nearest secondary school.
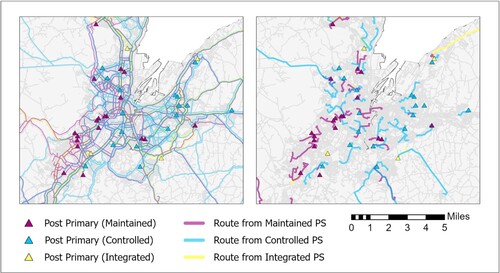
Maps 4 and 5 focus on the metropolitan region of Belfast. Map 4 shows connections between feeder primaries and the secondary schools to which their pupils moved in 2019 and it indicates a similar complexity in home-school travel to that seen across NI – the routes have been slightly offset to ensure that overlapping pathways are not obscured in this close-up view and to assist visualisation. While the movements shown demonstrate the impact of selective schooling, it also suggests that many pupils cross Belfast to access schools which match community affiliation, reflecting Belfast’s complex ethnic geographies (Shirlow Citation2016) and the patterns of movement within the city (Huck et al. Citation2019). Map 5 illustrates the primary to secondary school routes in a scenario where pupils attend their nearest secondary school. The differences in these maps again sharply illuminates the differences in the amount of travel required to support a doubly divided system of secondary education, alongside the marketisation of schools which increases choice for parents and pupils.
Map 4 and 5. Linkages between primary schools and those secondary schools to which pupils transferred in 2019 (Map 4) and potential journeys to the nearest secondary (Map 5) in the Belfast metropolitan area.
The main political parties in NI appear to agree that the current divided education system is not sustainable. The New Decade, New Approach document, unanimously signed up to by all of NI’s local politicians in January 2020, affirmed that, ‘to help to build a shared and integrated society, [the NI government] will support educating children and young people of different backgrounds together in the classroom’ (UK and Irish Governments Citation2020, 7) and there is a recognition that, while ‘the education system has a diversity of school types, each with its own distinctive ethos and values … it is not sustainable’ (UK and Irish Governments Citation2020, 43). This document committed the NI government to an external, Independent Review of Education to examine these issues, which was established in 2021.
Conclusion
It is clear that division in school provision, through academic selection, and community segregation, will increase the amount of home-school travel for secondary schools, despite all schools delivering potentially an identical academic curriculum and preparing young people for the same public examinations. The costs associated with that unnecessary travel further compound the already high cost of duplication and division in education, which has been estimated at £57 million per year (Cavanagh Citation2021). While substantial in financial terms both for the taxpayer and for parents, it also has considerable impact on the environment (McDonald et al. Citation2016). Separation as a result of academic selection and through community segregation in schools also has a significant social cost, which may help to sustain wider social and ethnosectarian divisions (Roulston and Milliken Citation2021).
At least some of these problems would be reduced or avoided in a simpler school system where most learners move together from local primary schools to a centrally located secondary school. The provision of local schools has been a feature of educational flagship countries like Sweden up until recently, although the politically-driven need to provide school ‘choice’ now seems to be having an impact on their educational provision as well (Bunar Citation2010).
This would not be a panacea. Some choice would still be required for parents to suit their work or their afterschool childcare arrangements. Additionally, the subsidiary aim of increasing mixing and, ultimately, enhancing social cohesion might not be so widely achievable in secondary schools in culturally or socially homogenous areas (Shirlow Citation2016). A proportion of any savings would need to be invested to ensure that every local school was equally well resourced, staffed and led in order to ensure high quality education for all abilities and to cater for the needs of all communities. This would help to deliver the current policy commitment in NI that every school is a good school (DENI Citation2009). Whatever the challenges, as a move towards a fairer and more cohesive society, any progress in this direction might yield considerable benefits in the longer term.
One shortcoming of this research is that it does not use the actual locations of pupil residences in the analysis. Were these available, the estimates of excess travel would be more accurate. Nonetheless, the figures obtained are in line with those from other research (Kelleher, Smyth, and McEldowney Citation2016; Smyth and Kelleher Citation2011; Thornthwaite Citation2016). Ideally using actual pupil data which provide authentic home-school travel patterns would be preferable. Alternatively, conducting primary data collection would provide a more accurate insight into those movements.
Home-school transport support for families who otherwise would face logistical and financial pressures in school attendance has to be welcomed. However, providing this support with schools in an open market, competing for pupils, will always be costly. This could be addressed by increasing the distance thresholds for free school travel, by introducing some form of means testing or by limiting choice. This is a global issue, as we have seen, and is likely to be a significant and increasing cost to often stretched educational budgets in many countries. In NI, the issue is compounded by the complexity of a divided school system. There are strong social, economic and environmental reasons for a radical review of this divided system of education, such as the Independent Review of Education is currently undertaking, and hard decisions will be required from courageous and visionary policymakers.
Disclosure statement
No potential conflict of interest was reported by the author(s).
Data availability statement
The data that support the findings of this study are available from the corresponding author, Stephen Roulston, upon reasonable request.
Additional information
Notes on contributors
Stephen Roulston
Stephen Roulston is a Research Fellow in the School of Education at Ulster University. After 20 years teaching, largely Geography and Geology, in a range of schools in Northern Ireland, he was an Educational Consultant in eLearning, joining Ulster University as a Lecturer in 2009. His research interests include the challenges of education in a divided society emerging from conflict. He is currently project lead for the Transforming Education programme in the UNESCO Centre of Ulster University.
Sally Cook
Sally Cook has been a Lecturer and Reader in GIS in the School of Geography and Environmental Sciences at Ulster University for over 20 years, following four years as a postdoctoral researcher in the same School. Her teaching and research interests focus on the science, technology and application of GIS and geographic methodologies, with an emphasis on the use of GIS for spatial and statistical analysis of social, environmental and health impacts. She is one of the researchers in the Transforming Education project in the UNESCO Centre, Ulster University.
Notes
1 We will use here the term ‘home-school transport’, to distinguish this movement from other transport associated with education, such as school trips.
References
- Andersson, E., B. Malmberg, and J. Östh. 2012. “Travel-to-school Distances in Sweden 2000–2006: Changing School Geography with Equality Implications.” Journal of Transport Geography 23: 35–43. doi:10.1016/j.jtrangeo.2012.03.022
- Angus, L. 2015. “School Choice: Neoliberal Education Policy and Imagined Futures.” British Journal of Sociology of Education 36 (3): 395–413. doi:10.1080/01425692.2013.823835
- Braithwaite, J. 2017. “Neoliberal Education Reform and the Perpetuation of Inequality.” Critical Sociology 43 (3): 429–448. doi:10.1177/0896920516649418
- Broberg, A., and S. Sarjala. 2015. “School Travel Mode Choice and the Characteristics of the Urban Built Environment: The Case of Helsinki, Finland.” Transport Policy 37: 1–10. doi:10.1016/j.tranpol.2014.10.011
- Brown, M., C. Donnelly, P. Shevlin, C. Skerritt, G. McNamara, and J. O'Hara. 2021. “The Rise and Fall and Rise of Academic Selection: The Case of Northern Ireland.” Irish Studies in International Affairs 32 (2): 477–498. doi:10.3318/isia.2021.32b.38
- Bunar, N. 2010. “Choosing for Quality or Inequality: Current Perspectives on the Implementation of School Choice Policy in Sweden.” Journal of Educational Policy 25 (1): 1–18. doi:10.1080/02680930903377415
- Cavanagh, C. 2021. A United Schools System Fingerpost – Community Relations Council Issue 2.
- De Boer, E. 2005. “The Dynamics of School Location and School Transportation: Illustrated with the Dutch Town of Zwijndrecht.” TR News, 237.
- Department for Infrastructure. 2017. “Travel Survey for Northern Ireland In-depth Report 2014-2016.” https://www.infrastructure-ni.gov.uk/publications/travel-survey-northern-ireland-depth-report-2014-2016.
- Department for Infrastructure. 2020. “Travel to and from School by Pupils in Northern Ireland 2019/2020.” https://www.infrastructure-ni.gov.uk/publications/travel-tofrom-school-by-pupils-ni-201920.
- Department of Education Northern Ireland (DENI). 2009. “Every School a Good School – A policy for School Improvement.” https://www.education-ni.gov.uk/publications/every-school-good-school-policy-school-improvement.
- Department of Education Northern Ireland (DENI). 2019a. Initial Engagement Report – Home to School Transport Review. https://www.education-ni.gov.uk/publications/initial-engagement-report-home-school-transport-review.
- Department of Education Northern Ireland (DENI). 2019b. “Review of Home to School Transport.” https://www.education-ni.gov.uk/articles/review-home-school-transport.
- Department of Education Northern Ireland (DENI). 2020. “Annual Enrolment at Schools and in Funded Pre-school Education in Northern Ireland 2019-2020.” http://www.education-ni.gov.uk/publications/school-enrolments-201920-statistical-bulletins.
- Department of Education Northern Ireland (DENI). 2021a. “Number of Schools and Pre-school Education Centres by Management Type.” https://www.education-ni.gov.uk/sites/default/files/publications/education/table-1-number-of-schools-and-preschool-education-centres-by-management-type-201617–202021.csv.
- Department of Education Northern Ireland (DENI). 2021b. “School Enrolments 2021-22 Provisional Statistical Bulletins Datafiles.” https://www.education-ni.gov.uk/sites/default/files/publications/education/figure-1-enrolments-in-primary-and-postprimary-schools-in-northern-ireland-201112–202122.csv.
- Department of Education Northern Ireland (DENI). n.d. “Review of Home to School Transport Policy.” https://www.education-ni.gov.uk/articles/review-home-school-transport-policy-0.
- Easton, S., and E. Ferrari. 2015. “Children's Travel to School—the Interaction of Individual, Neighbourhood and School Factors.” Transport Policy 44: 9–18. doi:10.1016/j.tranpol.2015.05.023
- Fewell, C. J., M. E. Hess, and C. L. Lowery. 2019. “Twenty Years in the Trenches: A Fight for Equitable and Adequate School Funding in Ohio.” Journal of Research Initiatives 4 (2): 1–10.https://digitalcommons.uncfsu.edu/jri/vol4/iss2/7
- Friedman, M. 1962. Capitalism and Freedom. Chicago: University of Chicago Press.
- Gallagher, T. 2021. “Governance and Leadership in Education Policy Making and School Development in a Divided Society.” School Leadership & Management 41 (1-2): 132–151. doi:10.1080/13632434.2021.1887116
- Gardner, J. 2016. “Education in Northern Ireland Since the Good Friday Agreement: Kabuki Theatre Meets Danse Macabre.” Oxford Review of Education 42 (3): 346–361. doi:10.1080/03054985.2016.1184869
- Gristy, C., and R. Johnson. 2018. “Home-to-school Transport in Contemporary Schooling Contexts: An Irony in Motion.” British Journal of Educational Studies 66 (2): 183–201. doi:10.1080/00071005.2017.1346229
- Han, L., Z. Xu, and C. Sabel. 2020. “Exploring the Potential of Urban (re) Form: Modifying Gated Communities to Shorten School Travel Distance in Nanjing, China.” Environment and Planning B: Urban Analytics and City Science, 1–18. doi:10.1177/2399808320982303
- Henderson, L. 2020. “Children’s Education Rights at the Transition to Secondary Education: School Choice in Northern Ireland.” British Education Research Journal 46 (5): 1131–1151. doi:10.1002/berj.3620
- Hill, D., and R. Kumar, eds. 2012. Global Neoliberalism and Education and its Consequences. Routledge, London.
- Hine, J. 2009. “The Provision of Home to School Transport in Northern Ireland.” Research in Transportation Economics 25 (1): 29–38. doi:10.1016/j.retrec.2009.08.003
- House of Commons. 2004. School Transport. Eighth Report of Session 2003–04. London: Transport Committee. HC318, cited in Hine, J., (2009).
- Huck, J. J., J. D. Whyatt, J. Dixon, B. Sturgeon, B. Hocking, G. Davies, N. Jarman, and D. Bryan. 2019. “Exploring Segregation and Sharing in Belfast: A PGIS Approach.” Annals of the American Association of Geographers 109 (1): 223–241. doi:10.1080/24694452.2018.1480930
- Institute of Fiscal Studies. 2019. “School Spending.” https://election2019.ifs.org.uk/article/school-spending.
- Kamruzzaman, M., and J. Hine. 2013. “Self-proxy Agreement and Weekly School Travel Behaviour in a Sectarian Divided Society.” Journal of Transport Geography 29: 74–85. doi:10.1016/j.jtrangeo.2013.01.002
- Kelleher, L., A. Smyth, and M. McEldowney. 2016. “Cultural Attitudes, Parental Aspirations, and Socioeconomic Influence on Post-Primary School Selection in Northern Ireland.” Journal of School Choice 10 (2): 200–226. doi:10.1080/15582159.2016.1153378
- Kilkelly, U., R. Kilpatrick, L. Lundy, L. Moore, P. Scraton, C. Davey, C. Dwyer, and S. McAlister. 2004. “Children’s Rights in Northern Ireland.” NICCY.
- Klees, S. J. 2008. “A Quarter Century of Neoliberal Thinking in Education: Misleading Analyses and Failed Policies.” Globalisation, Societies and Education 6 (4): 311–348. doi:10.1080/14767720802506672
- Mamabolo, A. 2020. “The Influence of School Principals as Potential Entrepreneurial Leaders on the Emergence of Entrepreneurial Activities for School Funding.” South African Journal of Education 40 (4): 1–15. doi:10.15700/saje.v40n4a2040
- Mandic, S., S. Sandretto, E. G. Bengoechea, D. Hopkins, A. Moore, J. Rodda, and G. Wilson. 2017. “Enrolling in the Closest School or Not? Implications of School Choice Decisions for Active Transport to School.” Journal of Transport and Health 6: 347–357. doi:10.1016/j.jth.2017.05.006
- McDonald, N. C. 2007. “Active Transportation to School: Trends among U.S. Schoolchildren, 1969–2001.” American Journal of Preventative Medicine 32 (6): 509–516. doi:10.1016/j.amepre.2007.02.022
- McDonald, N. C., A. L. Brown, L. M. Marchetti, and M. S. Pedroso. 2011. “U.S. School Travel 2009: An Assessment of Trends.” American Journal of Preventative Medicine 41: 146–151. doi:10.1016/j.amepre.2011.04.006
- McDonald, N. C., R. L. Steiner, W. M. Palmer, A. N. Bullock, V. P. Sisiopiku, and B. F. Lytle. 2016. “Costs of School Transportation: Quantifying the Fiscal Impacts of Encouraging Walking and Bicycling for School Travel.” Transportation 43: 159–175. doi:10.1007/s11116-014-9569-7
- McKibben, D. 2011. Transport Governance and the Management of Car Dependency in Belfast. Research and Information Service Briefing Paper.
- Meredith, R. 2018. “School Budgets Reduced by about 10%, Report Finds.” BBC. https://www.bbc.co.uk/news/uk-northern-ireland-45864099.
- National Atmospheric Emissions Inventory. 2014. “UK National Atmospheric Emissions Inventory.” https://naei.beis.gov.uk/index.
- Nguyen, M. H., D. Pojani, T. C. Nguyen, and T. T. Ha. 2021. “The Impact of Covid-19 on Children's Active Travel to School in Vietnam.” Journal of Transport Geography 96: 103191. doi:10.1016/j.jtrangeo.2021.103191
- NimbleFins. 2022. “Average Cost to Rn a Car UK 2022.” https://www.nimblefins.co.uk/cheap-car-insurance/average-cost-run-car-uk.
- Oliver, M., S. Mavoa, H. Badland, K. Parker, P. Donovan, R. A. Kearns, E. Y. Lin, and K. Witten. 2015. “Associations Between the Neighbourhood Built Environment and out of School Physical Activity and Active Travel: An Examination from the Kids in the City Study.” Health & Place 36: 57–64. doi:10.1016/j.healthplace.2015.09.005
- Ponzini, R. 2022. “Public School Funding in the United States and Its Systemic Inequities.” Economia Aziendale Online 13 (1): 143–147. doi:10.13132/2038-5498/13.1.143-147
- RAC. 2021. “The Average Age of a Car Driven in the UK Is Now the Oldest it’s Ever Been.” https://www.rac.co.uk/drive/news/motoring-news/record-breaking-age-of-uk-cars/.
- Ross, E. W., and R. J. Gibson. 2007. Neoliberalism and Education Reform. Cresskill, NJ: Hampton Press.
- Rothman, L., A. K. Macpherson, T. Ross, and R. N. Buliung. 2018. “The Decline in Active School Transportation (AST): A Systematic Review of the Factors Related to AST and Changes in School Transport Over Time in North America.” Preventive Medicine 111: 314–322. doi:10.1016/j.ypmed.2017.11.018
- Roulston, S., and S. Cook. 2020. “Pre-school Education in Northern Ireland.” Transforming Education Briefing Paper. https://www.ulster.ac.uk/research/topic/education/unesco-centre/research/transforming-education.
- Roulston, S., and S. Cook. 2021. “Parental Choice of Primary and Post-primary Schools: Myth or Reality?.” Transforming Education Briefing Paper #8. https://www.ulster.ac.uk/__data/assets/pdf_file/0009/809019/TEUU-Report-08-Parental-Choice.pdf.
- Roulston, S., U. Hansson, S. Cook, and P. McKenzie. 2017. “If you are not one of Them you Feel out of Place: Understanding Divisions in a Northern Irish Town.” Children's Geographies 15 (4): 452–465. doi:10.1080/14733285.2016.1271943
- Roulston, S., and M. Milliken. 2021. “Academic Selection and the Transfer Test.” Transforming Education Briefing Paper #10. https://www.ulster.ac.uk/__data/assets/pdf_file/0010/828901/TEUU-Report-10-Academic-Selection.pdf.
- Rowe, E. E., and C. Lubienski. 2017. “Shopping for Schools or Shopping for Peers: Public Schools and Catchment Area Segregation.” Journal of Education Policy 32 (3): 340–356. doi:10.1080/02680939.2016.1263363
- Saporito, S. 2003. “Private Choices, Public Consequences: Magnet School Choice and Segregation by Race and Poverty.” Social Problems 50 (2): 181–203. doi:10.1525/sp.2003.50.2.181
- Sarmiento, O. L., P. Lemoine, S. A. Gonzalez, S. T. Broyles, K. D. Denstel, R. Larouche, V. Onywera, et al. 2015. “Relationships Between Active School Transport and Adiposity Indicators in School-age Children from low-, Middle-and High-Income Countries.” International Journal of Obesity Supplements 5 (2): S107–S114. doi:10.1038/ijosup.2015.27
- Shirlow, P. 2016. “Belfast: A Segregated City.” In Coulter, C and Murray, M. (eds) Northern Ireland After the Troubles, 73–87. Manchester University Press.
- Sinclair, M. P., and J. S. Brooks. 2022. “School Funding in Australia: A Critical Policy Analysis of School Sector Influence in the Processes of Policy Production.” Education Policy Analysis Archives 30: 16–16. doi:10.14507/epaa.30.6999
- Smith, M., E. Ikeda, G. Hawley, S. Mavoa, J. Hosking, V. Egli, J. Zhao, et al. 2020. “An Integrated Conceptual Model of Environmental Needs for New Zealand Children's Active Travel to School: Environmental Needs for Active School Travel.” Journal of Transport and Health 16: 1–11. doi:10.1016/j.jth.2019.100814
- Smyth, A., and L. Kelleher. 2011. School Choice, Education Reform and Fiscal Austerity: A UK Perspective on their Implications for School Transport, 12, 4143.
- Thornthwaite, S. E. 2014. “The Report of The Independent Review of Home to School Transport.” https://www.education-ni.gov.uk/publications/independent-review-home-school-transport-reports.
- Thornthwaite, S. 2016. “A Report on School Transport Provision Across the UK 2010-2016.” School Transport Matters STC Ltd. https://bettertransport.org.uk/sites/default/files/research-files/16.05.25.school-transport-matters.pdf.
- UK and Irish Governments. 2020. “New Decade, New Approach.” https://assets.publishing.service.gov.uk/government/uploads/system/uploads/attachment_data/file/856998/2020-01-08_a_new_decade__a_new_approach.pdf.
- Van Dijk, M. L., R. H. De Groot, H. H. Savelberg, F. Van Acker, and P. A. Kirschner. 2014. “The Association Between Objectively Measured Physical Activity and Academic Achievement in Dutch Adolescents: Findings from the GOALS Study.” Journal of Sport and Exercise Psychology 36 (5): 460–473. doi:10.1123/jsep.2014-0014
- Vehicle Certification Agency. 2022. “Car Fuel Data, CO2 and Vehicle Tax Tools.” https://carfueldata.vehicle-certification-agency.gov.uk/