
ABSTRACT
The debate on the demographic development in Sweden in the Early Modern Period has a long history. A significant topic concerns how many people in fact lived in the country during the 16th and 17th centuries. This article focuses on the 17th century but leaves aside the question of absolute population numbers or growth rates. Instead, I will try to estimate the availability of grain, a dominant factor determining and limiting population developments in the period. There is a general view among historians that domestic grain production in Sweden stagnated during the 17th century. In this article, I add my voice to those who hold this view . In itself, this could also indicate a stagnant population. However I will show, that domestic production was not the same thing as grain availability. Swedish scholars are unanimous that in c. 1700 the country had c. 1,300,000 inhabitants. Using new source material, I will show that Sweden’s foreign grain trade in that period could feed at least 300,000 more people than in c. 1630. Finally, I will try to set Sweden’s growing grain trade in context with other developments in Sweden during the period.
Introduction
The scholarly debate on the demographic development in Sweden in the Early Modern Period has a long history. A significant topic concerns how many people in fact lived in the country during the 16th and 17th centuries. In this article, I will leave aside this question of actual total population sizes or growth rates. Those interested can find more about this in my recent article (in English) in Bebyggelsehistorisk Tidskrift (2021, No 81), where I suggest, from a European perspective, there was relatively rapid population growth in Sweden.
There is a common view among scholars that the size of historical populations was strongly connected to grain availability. For England, one study found a correlation between agricultural output and population between 1270–1870 of + 0.94 (which, for that period, does not exclude strong deviations from the trend).Footnote1 This also holds for Sweden.Footnote2
There is a general view among historians that Swedish domestic grain production stagnated during the 17th century. Several scholars have researched the matter for the periods circa 1570–1810. One line of research used tithe records to establish trends. Agriculture historian Lotta Leijonhufvud studied annual and regional tithe developments between 1539 and 1680 for Sweden, within its borders of before 1645. The results show tithes growing somewhat during the 16th century but, judging from her diagrams, almost stagnating during the 17th century. Leijonhufvud came to the conclusion that ‘Grain production, as reflected in the tithes was practically constant during the period’.Footnote3 My own estimations for 1630 and 1690 are very similar, also indicating a very slow or stagnating development.Footnote4 Tithe records from after 1680, reconstructed in a recent research project, point in the same direction.Footnote5 Thus, Swedish grain production seems to have stagnated during the 17th century. At the end of the century, domestic production was far from sufficient for the human consumption needs. So, where should a population, that has been suggested to be growing relatively fast, get all that missing grain?
I will, however, make a case for the position that grain availability still rose decisively in Sweden during the 17th century. This was a consequence of a long decrease in grain exports and increase in imports. In the following, I will try to estimate how many people these imports could sustain in different periods of the century. Postulating a stagnant domestic grain production, the country’s foreign grain trade thus indicates population growth. As I will show, the net development in no way excludes the possibility of a relatively fast population growth in the country; rather, may suggest the contrary, although the numbers indicated are probably far from exact.
The volumes of foreign grain trade have been only known in a fragmentary manner from the period before annual and reliable trade statistics were introduced in 1738. Most of what is hitherto published from before that time can be found in Svensk handelsstatistik 1637–1737: samtida bearbetningar by historian Bertil Boëthius and economic historian Eli F. Heckscher (1938). To amend for this, I have searched for new sources and estimation methods, much of them published here for the first time. The reconstruction demands a somewhat detailed source scrutiny.
Grain imports and exports
You might think that fundamental sustenance in the Early Modern Period could not have depended on imports, since international trade was still in its infancy, ships were small, and the many wars of the period made trade a risky business. But it is an established view among historians that Sweden, in the middle of the 17th century, was transformed from being a grain net exporter to becoming a net importer. This view has however been based on fairly meagre empirical data, and concrete volumes are seldom discussed. The importance of foreign grain trade relative to domestic production and consumption is seen as marginal.Footnote6
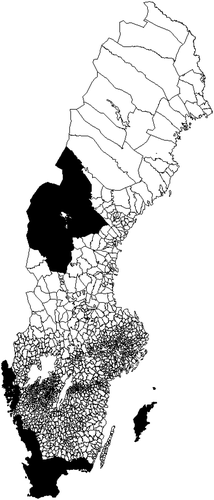
1645–1658 Sweden annexed several provinces from Denmark and Norway (black). In the following text, Sweden before the annexations (white) will be referred to as ‘Sweden proper’. (Finland was a part of the Swedish kingdom from the 13th century until 1810, but in this article excluded from the term Sweden).
Can we get a better grasp on that trade by quantifying Sweden’s (within today’s border, cf. borders in ) imports and exports for more years than has previously been the case? There are three sources that might help us with this for the period before annual official trade statistics were introduced.
Figure 1. Sweden within recent borders and ‘Sweden proper’.
The customs accounts
The ideal source on the national level is maritime customs accounts – Stora sjötullen – which date from the 16th century. According to the customs regulations, all commodities passing through the customs stations had to be registered; even commodities that were exempted from the customs duties.Footnote7 Unfortunately, very little of the resulting voluminous accounts have survived; they were later often given to the Swedish military forces to use for cartridges. Hence, we only have sporadic central accounts of the commodities passing through Sweden’s ports. Surviving documentation, starting in the 16th century, continues until the beginning of the 1620s, when customs was farmed out to private merchants for a lump sum. At that point, the government lost interest in customs accounts, which disappear from the archives. When the lease lapsed in 1634, the Crown took back the management of the customs (farming it out again for periods in the 18th century). The maritime customs on foreign trade in Sweden, including the former Danish-Norwegian ports annexed in 1645 and 1658, was levied at 23 ports allowed foreign trade, and enjoying so-called ‘staple rights’.
The controls connected with the Swedish customs system can be exemplified by Stockholm. The city got its grain from the surrounding regions or by sea from the eastern or southern sides of the Baltic Sea. On the city’s land side, it was surrounded by customs fences and several customs stations belonging to the Lilla tullen, introduced in 1622, which controlled the domestic trade. Seaborne foreign trade was controlled by the maritime customs, the Stora sjötullen, at all landing sites within the city.
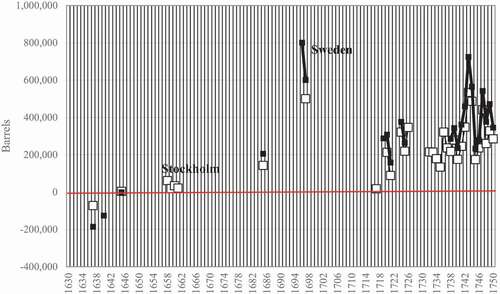
In , I have included the remaining customs data on Sweden’s (within today’s borders) grain trade from published sources.Footnote8 From the crisis-ridden 1690s, there are three figures often quoted. They are taken from a report to the royal council in 1704 by Fabian Wrede, the chief of Sweden’s central financial departments. It is reasonable to assume that these figures also stemmed from customs accounts and relate to ‘Sweden proper’. The figures are 11,000 barrels for 1695, 800,000 for 1696 and 600,000 for 1697.Footnote9 The 1695 figure is evidently wrong, as only Stockholm imported more than 20 times as much in that year (cf. below).Footnote10 I have discarded this data point in below. The figures for 1697 and 1698 have, however, been included, as they seem to be fairly compatible with the estimates of Stockholm’s imports shown further below.Footnote11
Figure 2. Sweden’s and Stockholm’s foreign net grain trade 1630–1750 from customs accounts.
A study of the grain trade of Sweden within its present borders necessitates additions for the former Danish and Norwegian provinces for the years before their annexation. Although there is much source material in the Danish and Norwegian national archives, here I have had to confine myself to published data and that only for Scania, the most important grain producer among those provinces. For 1637 and 1640, where there are figures for Sweden proper, figures have also been published for Malmö, the main hub in Scania for grain commerce.Footnote12 For 1645, it is hard to imagine any grain exports at all from Scania, given that the whole province, excepting the fortress of Malmö, was occupied by the Swedish military. For an estimate of the province’s grain exports before 1658, I have assumed that Malmö represented about 50% of the total, as was the case in 1655.Footnote13 These estimates have been added to the figures for Sweden proper. This approach results in a certain ambiguity, as some grain also occasionally passed through the annexed small ports of Halland, Bohuslän, Gotland, and Blekinge provinces. It should also be noted that exports these years are seen from a Danish perspective, though exports to Sweden proper are separated and can be deducted. After the Swedish annexation of these provinces, much of their grain surpluses, where such existed, were redirected to Sweden instead of being exported to other countries such as Germany and Norway. Thereafter, these goods were part of Sweden’s domestic trade, resulting in their disappearance from the Swedish maritime customs rolls.
also includes customs data for Stockholm, data that will play an important role for national trade estimates further on in the article.
One problem with the customs accounts of Stockholm is that they also included trade for Gävle, a port 250 km to the north of Stockholm. This port had been given the right to engage in foreign trade but had to clear customs in Stockholm. This problem disappeared for the Stockholm customs when Gävle got full staple rights and a customs station of its own in 1673. Gävle’s grain trade was probably not very substantial in the period (in 1685 its total trade was less than 2% of Stockholm’s).
The graph in shows deplorable lacunae. Before 1685, there are only three years with direct quantitative data for Sweden as a whole. For Stockholm, the situation is not much better. To get a more detailed view of Sweden’s total grain trade, one could also contemplate making estimates from occasional local customs accounts, for shorter or longer periods occasionally preserved in the archives. But for the biggest ports, including the main imports/exports port of Stockholm, remaining customs data only cover a few years. The Stockholm customs data, also included in , give much the same general impression as numbers for the country as a whole.Footnote14 Other remaining 17th century customs data are mostly from small ports, thus difficult to use for any national trade estimates.
However, it is not only the scarcity of data that is problematic. There is another flaw in the customs’ evidence – both the Stockholm and the national Swedish customs figures do not include internal grain trade between Finland and Sweden, as this trade was considered as domestic trade and exempted from the marine customs. Often, Finland has been seen as a very small if not non-existent grain exporter, but in periods of the 17th century, the country was in fact a relatively important grain supplier to the Swedish part of the kingdom. In a report in the royal council in 1704, senator Fabian Wrede said: ‘It’s so with Sweden, that it cannot be sustained with grain by itself, Finland, Livonia, Estonia and Ingria are our larders’.Footnote15 In 1713, Finland was called Sweden’s ‘bästa Magazin och Proviantz huus’.Footnote16 According to the (Swedish) Västerbotten county governor Gotthard Strijk in 1689, (Finnish) Österbotten and Livonia were Västerbotten’s granary, ‘ … that they (i.e. the Västerbottnians) yearly have to get with great sea hazard’.Footnote17 For 36 years during the period 1651–1698, Finland, including the port of Viborg, delivered on average 14,621 barrels annually to Stockholm. Between 1727 and 1730, the average was 21,748 barrels from Finland, with Viborg, in 1721ceded to Russia, not included.Footnote18 In the period circa 1709–1721, no or very few deliveries can be assumed due to much of Finland being occupied by Russia in the Great Northern War.Footnote19
What picture do these scarce and problematic customs data in give of Sweden’s net grain trade for the Early Modern Period? Both Sweden and Stockholm seem to share long-term positive trends and, for all 17th century years, Stockholm takes the lion’s share of the overall national trade. But does the graph really corroborate an overall positive trend, demonstrating that Sweden during the middle of the 17th century changed from a net exporter to a net importer of grain, a common view among historians? Not necessarily, as the lack of data for most of the years still makes developments unclear.
There are, however, better sources that might help us to make grain trade estimates for more years for Stockholm, and, given the city’s importance in its overall grain trade, even for Sweden as a whole.
The tolag accounts
The tolag, from a German word for ‘addition’, was another commodity-based duty on foreign trade that, contrary to the common Crown’s customs, (initially) accrued to the staple ports themselves. Staple ports were the ports allowed trade with ports outside the Swedish realm (Sweden and Finland). The tolag accounts of the 17th century were assembled separately from the Crown customs. Tolag was collected by staple cities between 1635 and 1680 and, generally, after 1714. In other years, the Crown integrated tolag into its customs accounts, meaning that both pieces of evidence are mostly lost. After 1714 and into the 19th century, the tolag continued as a communal income for ports.Footnote20 To some extent, the accounting of the tolag was coordinated with that of customs.Footnote21 For example, in Stockholm, the tolag office got commodity lists from its customs counterpart. For Sweden, the tolag accounts are for long periods to be found in the city archives but are sometimes also preserved in the county accounts (länsräkenskaper) when these include city data.Footnote22 The länsräkenskaper are to be found in the Swedish National Archives in Stockholm or in its regional and local divisions.
This apparent duplication of trade data has provided researchers with a way of supplementing missing customs records.Footnote23 Ivan Lind was a pioneer when he used the well preserved tolag records for Gothenburg to calculate import statistics for the years of 1649–1920.Footnote24 His statistics have since been mostly accepted as commensurate to later official trade statistics.Footnote25 Åke Sandström studied the tolag records for Stockholm, extant in the Stockholm city archives in series starting in 1636, to research the city’s commerce for years before 1651.Footnote26
Making comparisons, Sandström found that, at least for his period, the correspondence between customs and tolag registration was not perfect. The latter accounts gave much lower numbers than the former. He found several possible explanations. For the Stockholm tolag, the Gävle problem mentioned above, dissapeared early, its trade was exempted from the Stockholm tolag in 1638 onwards.Footnote27
Sandström also found that, for some years during his period, cargos that for one reason or another were exempted from tolag, for example commodities traded by the nobility, were accounted for in separate books. For other years, such books might have been lost if they ever existed. My studies of the accounts, however, mainly for the period after Sandström’s, frequently found duty free loads, in the ordinary accounts, although not debited. For other years, such books might have been lost if they ever existed.
According to Sandström, smuggling might have resulted in underestimating both customs and tolag numbers. Smuggling must have been more common for luxury commodities than for bulky everyday commodities like grain. ‘Doing a runner’ from the tolag was probably easier than from the customs. The price for skipping the tolag duty was the risk of the tolag administration with its rolls waiting for you when you came back. When in 1636, Dalarö customs station was established outside of Stockholm, this must have made smuggling harder.
The trade with Russia is another statistical problem named by Sandström, as this trade was partly handled outside the Stockholm tolag system.Footnote28 When it comes to Russian grain, I only found some few and very small quantities in the tolag accounts, and I see them, as Sandström did for his period, as very marginal. The Russian trade seems to have consisted of mostly handicrafts and metals. From c. 1675, grain exports from Russia to Sweden were forbidden.Footnote29
For years in which we have both customs and tolag data, it is clear that the former recorded more barrels imported than the latter. According to customs regulation, all commodities, liable or not for the duty, should be registered. Here, we have another explanation for the difference – the Baltic ‘Crown grain’. This grain was also registered by customs, although no fee had to be paid.Footnote30 This included grain imported by the Crown from Sweden’s Baltic possessions (Finland excluded), taken from Crown granaries and Crown estates in these provinces. This grain originated from natura taxes or was bought and, when needed, ordered to be sent to Sweden, Finland, or Sweden’s German possessions, as food for military garrisons as well as for civilian use.Footnote31 My studies of many pages of Stockholm tolag accounts leave a strong impression that Crown grain evades us in this source (cf. note 44 regarding tunnepengar, which is much in parallel to the tolag).
How much of the grain imports we miss when we only have tolag accounts to consult cannot be ascertained without comprehensive archival studies, but some pieces of information have been published and can be quoted: 1685 was generally a normal agricultural year in Sweden but, in the previous year, bad harvests hit the southern parts of the country.Footnote32 In 1684–1685, therefore, 250,000 barrels of Crown grain were ordered from Riga and Tallinn to several ports in Sweden. However, the order was not realized in full. Belatedly, in the first half of 1685, only a total of 104,842 barrels were sent.Footnote33 In the 1690s, large quantities of Crown grain were transferred to the kingdom’s fortresses.Footnote34 1695–1699, it seems that all grain exports from Sweden’s possessions in Estland, Ingria, and Livonia – Reval (Tallin), Pärnu, Narva, and Nyen (now St. Petersburg) – went to Sweden or Finland. Starting in 1697, Sweden also received supplies from Riga.Footnote35 In the catastrophic hunger year of 1697, 69,000 barrels were demanded from Riga, Reval, and Ösel, to be transported to Sweden and Finland and, in 1698, c.50,000 barrels were ordered to Sweden, Finland, and Ingria. In 1699, 45,000 barrels were ordered to Sweden and to Swedish Pomerania but only 32,000 arrived. 25,000 of these barrels went to Sweden.Footnote36 More quantitative information on the Crown grain is likely to be found in the archives.Footnote37
So far, with due care, the tolag accounts seem to be a promising source for estimations of international grain trade, at least for Stockholm. There are, however, some drawbacks. One problem is that the tolag, with few exceptions, was nationalized between 1680–1714 and practically no records remain for that period; another issue is the volume of extant accounts. Finding numbers for particular commodities is very time consuming for big ports like Stockholm. In contrast to some customs accounts, tolags provide no summaries, and the researcher must sum up such information from the records, proceeding boat by boat, charterer by charterer, commodity by commodity. The number of commodities listed is immense. For 1643–1680, for example, the total tolag accounts for Stockholm comprise approximately 26,000 folio pages that need to be scrutinized. An average year comprises over 1,100 such pages. This may also explain why researchers have typically not used the tolag accounts. A full analysis of this archival source would demand resources that have not been available for this article. Only a few years have been possible to examine here, in order to compare with the other sources.
When focusing on grain, there is a much more convenient source than the tolag, a source that also enables the study of the archivally-dark period of 1681-1714 – the tunnepengar. Once again, Stockholm is taken as example.
The tunnepengar
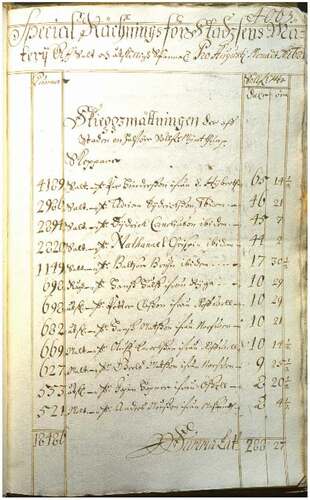
In 1636, Stockholm was, by privilege, granted the right to receive tunnepengar or ‘barrel money’ from its maritime, domestic and foreign, grain and salt trade. The barrels were counted and measured by appointed city officers.Footnote38 The tunnepengar, as the tolag, became an important part of city income. The fee has been seen by some researchers as a possible general indicator of domestically-produced or imported grain commerce in the city.Footnote39 However, most researchers seem to have ignored these numbers in connection with foreign trade. For Stockholm, these registers have survived in long series from the 1640s forwards. An example from the accounts is given in .
Figure 3. Example from Stockholm tunnepengar accounts.
Before 1650 the Stockholm tunnepengar duty hit both incoming and outgoing barrels, but as of 1650 only incoming. The rules for its measurement were clarified by successive printed city mandates. The earliest that I know of, from 1671, states:
Shall no one venture to buy or sell any grain, that from the country comes, otherwise than in the common markets or at the decreed docksides, where the measurement houses are erected: Who does otherwise and breaks against this, will be befallen a fine of twelve mark for every barrel.Footnote40
When the ships lay at the quayside and barrels were discharged (or sometimes loaded) the city’s measurers and their assistants (sometimes called ‘boys’) arrived and started their measurements. Directly when they were done with their job, the tunnepengar were to be paid. From 1694 or 1695 on, an instruction was cited monthly in the tunnepengar accounts saying that the fee had to be paid before the evening of the day of the measurement. The accounts should be summarized and the fees delivered to the Crown’s bank at the end of the month.
The measurements were accounted for in the city’s books under different headers: barrels coming by land were mostly registered under the header Mätarpengar, and divided into Landmätningen, measurements made in the market-place, and Bodmätningen, made in the merchants’ bothies. Measurements on barrels discharged from the ships were recorded under the header Skeppsmätningen”, mostly also called Tunnepengarna.
For Stockholm the series of tunnepengar used here starts in 1646.Footnote41 The accounts show varying practices over time. An overview is given in .
Table 2. Information in the Stockholm tunnepengar accounts.
For a reconstruction of the Stockholm grain trade, only the tunnepengar export information for 1646–1649 is appropriate, as it can be interpreted as grain barrels, for Stockholm was not a salt exporter of any significance. The import figures are less useful as ports of origin and barrel contents are not given. The accounts from 1650–1661 occasionally expressly record salt but seemingly, and of more consequence, undefined barrels discharged from the Salt Company’s ships, which certainly only would have contained salt. Barrels coming from France, Spain, Portugal, and Holland were also likely to contain salt, as shown from later accounts. Taking heed of this, and given the trade with Finland can be estimated, the 1650–1661 records can be used. For the years between 1662 and 1665, accounts are missing. After that, all relevant data are given.
One could expect the tunnepengar and the tolag to overlap when it comes to records of grain (and salt). But a difference arises from the fact that the tunnepengar measurements, in contrast to the tolag, also recorded domestic maritime grain trade. However, going through the material boat by boat, this domestic trade can be separated (and studied if you are interested in Sweden’s internal maritime trade). It should be noted that the tunnepengar figures, contrary to those from tolag, include ‘domestic’ grain trade between Finland and Stockholm. The domestic trade with Finland can be added to other foreign trade as it’s the current territory of Sweden that interests us. Thus, eliminating the domestic deliveries registered in the tunnepengar accounts should give the same number of barrels as the tolag books.
To check this, I compared barrel estimates from the tunnepengar and the tolag for a few years. Numbers were not identical, but the differences were, in general, small. These differences probably have several causes. One issue is possible misidentification of port names when I tried to eliminate the domestic trade. Another is differing payment times for the tolag and for the tunnepengar. The former was paid at the ship’s arrival or departure, the latter at discharge (or for a period after loading). Long lay times were common – there could be a lapse of one or two months between a ship’s arrival (and tolag registration) and the tunnepengar procedure (long lay times, marked by drinking and violence, were a source of social discontent in the city).Footnote42
The tolag and tunnepengar can, with caution and due adjustments, be used interchangeably for approximating Stockholm’s foreign grain trade.Footnote43 The tunnepengar main accounts, as well as those of the tolag, did not register Crown grain. This grain was registered in separate books.Footnote44 The big merit of using the tunnepengar accounts is their more modest volume in comparison with those of the tolag. For 1680, for example, the tolag accounts comprise 2,600 pages, while the tunnepengar totals only 46. A still bigger advantage with the tunnepengar is that their accounts also cover the period 1681–1714, when the tolag was, in general, nationalized and accounts have generally not survived.
The following shows the total numbers of the Stockholm tunnepengar grain barrels for the 17th and 18th centuries and for some years, for comparison, the tolag barrels.
Figure 4. Stockholm’s foreign grain trade according to tolag and tunnepengar accounts 1630–1750.
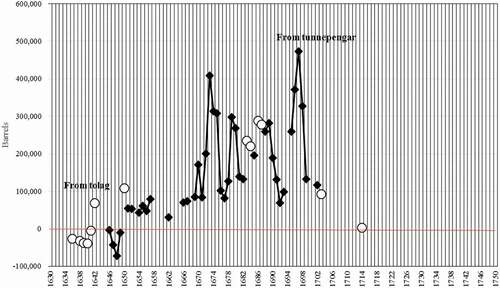
The series in gives much more detailed information on Stockholm’s trade compared to that given by the customs accounts in . The tolag figures somewhat underestimate Stockholm’s trade with areas outside the borders of today’s Sweden. By and large, however, the two sources still seem to indicate a common pattern. Finland’s grain trade with Stockholm can, as has been mentioned, be estimated and added from the tunnepengar accounts. The problems with the trade between Finland and Sweden will be addressed further on in the present article.
*
As has been shown above, there remains very little customs data on the total grain trade for Sweden during the 17th century. This pattern also holds for Stockholm, the country’s biggest port for international trade, including that for grain. Grain commerce is documented in other sources, which have more frequently been preserved – the tolag and tunnepengar accounts. These sources have been studied for Stockholm. This article demonstrates that both sources can be used for estimating the city’s grain trade. In the tolag records, the grain barrels appear amidst a myriad of other commodities. The tunnepengar accounts, however, are much more practical, provided you can deduct grain emanating domestically from the accounts. These accounts also make estimates feasible for the three decades after 1680 when the Stockholm tolag was mainly nationalized.
Let us try to see what the above findings mean for a reconstruction of Stockholm’s grain trade and the city’s role in Sweden’s trade on the national level.
Stockholm’s grain trade and Sweden’s
Stockholm was, without a doubt, Sweden’s biggest port for international trade. Eli F. Heckscher estimated that the total trade value of Stockholm from at least 1644–1720 amounted to two-thirds or three-quarters of Sweden’s total foreign trade. Very high proportions also hold for grain – in the 17th century, Stockholm was the country’s main grain trade harbour.Footnote45 Most of the grain came from the other side of the Baltic Sea. In 1697, more than 500,000 barrels are said to have been imported to Stockholm from the Baltic countries alone.Footnote46 The average for the few remaining customs figures from the 17th century is 58% but varied heavily. For example, in 1685 (a year likely to have been an agriculturally average year), occasionally extant customs national records show that the town imported 68% of all Sweden’s grain imports. As a comparison, for 16 years with data between 1721 and 1750, the average proportion was 76%, varying between 68–86%.
The graph in shows the net grain trade for Stockholm 1630–1750; for most of the years, the estimated numbers are published here for the first time. Sources are the ones mentioned above: customs, tolag, and tunnepengar accounts. To homogenize the series as much as possible, I have prioritized tolag and tunnepengar barrels. When these sources have not been available, some customs numbers have been included, although they exclude trade with Finland and at times may include Gävle’s trade and Crown grain (see above). From the tunnepengar numbers, maritime grain deliveries to Stockholm from Sweden proper and its former Danish-Norwegian ports have been eliminated. To the customs and tolag figures used, estimated grain imports from Finland have been added from the tunnepengar.
Figure 5. Estimate of Stockholm’s net foreign grain trade 1630–1750.
The graph fills many of the gaps in , but still gives a similar general impression of a long-term rising linear trend, with net exports before c. 1650 and very high import volumes in the 1690s and the 1740s. One can also note that the well-known 1690 grain import highs were not the only ones. High import figures can also be seen for the 1670s and the 1680s. For the 18th century, the tunnepengar and tolag barrels have not been possible to study more closely for this article.
Stockholm was not the sole intended consumer of grain imported through its port. This can be seen from asking what number of people the Stockholm grain imports could nourish. According to an often-used 18th- and early-19th-century standard, some two to three barrels of cereals was the normal annual consumption of grain for an adult person working in manual labour. Not all people were adult workers, and there were different needs for different age groups. A 1770 statistical report by the ‘measurements inspector’, Edvard Fredric Runeberg, to the Swedish Academy of Sciences, estimated 2.5 barrels for grown-ups and 0.91 barrels for children under 15 years.Footnote47 Certainly, he meant barrels of the main crops of rye or barley. With the age distribution at that time, these children made up 34% of the total population.Footnote48 This gives an average consumption per capita of 1.96 barrels. The proportion of grain in daily bread was only 85%, as the poorer people in the countryside had to add chaff and bark. According to the report, an ideal consumption should be three barrels per person above 15 years of age. Without a doubt, the 1770 report’s norm was also, to a great extent, valid for the countryside for the preceding century.Footnote49
Did Stockholm’s consumption pattern deviate from Sweden’s in general? Probably not much. The city, without doubt, had many rich people but also housed many workers and poor. Richer people certainly ate more grain than the poor but, at a certain level of income, the rich increased their intake of items like meat, butter, and expensive seafood rather than porridge, as income rose. In Sweden, the rich – nobility, clergy, and city burghers –, were a tiny minority of the population, about five per cent, or some 88,000 persons.
Using Runeberg’s norm, an average annual import to Stockholm of more than 184,000 barrels for the years 1658–1700 should be enough to feed some 92,000 people. The city had, during the 17th and first half of the 18th, a far smaller population. For the 1650s, the city is estimated to have had about 35,000 inhabitants. In 1676, the city had probably between 42,000 and 43,000 inhabitants, a number that increased to 57,000 in the 1730s.Footnote50 For years when Stockholm imported 400,000–500,000 or more barrels, it is even more obvious that the imports were not only for local consumption.
From Stockholm, much of the grain was redistributed to, primarily, the mining and ironworks districts of Bergslagen (Dalecarlia and Närke provinces) and northern Sweden. This can be seen from the tunnepengar accounts, which register numerous re-loadings of imported grain to smaller boats for further transport to Västerås in the Lake Mälaren region, and Swedish and Finnish ports along the Bothnian Sea coasts.
The interconnection between Stockholm’s grain imports and harvests in surrounding areas during 1665–1750 also points to Stockholm’s role in a broader trade network. The coefficients of correlation are shown in :
Table 3. Correlations between Stockholm net grain imports and harvests 1665 – circa 1750.
The table shows that bad harvests in central Sweden west of Stockholm, and in provinces to the north, were clearly negatively correlated with strong imports to Stockholm. Bad harvests in the northernmost province of Västerbotten, for example, tended to occur in the same years as high grain imports were recorded in Stockholm. In contrast, counties closer to Stockholm show weaker correlations. (It might surprise that i.e. Baltic exporters could adapt that fast to Swedish import needs, but the need of one year was already indicated in the autumn of the preceding year. The harvest situations were important information for merchants, spread among them by a burgeoning press and personal contacts.)
A more indirect testament to Stockholm’s importance for the nourishment and health of the Swedish population is given by the correlation between the city’s grain trade and the mortality on the national level. On several occasions – around 1650, during the 1670s, the 1690s, and the critical 1740s – high Stockholm imports corresponded to spikes in national mortality. Although death by direct hunger was not very common, an undernourished population was susceptible to mortal infectious diseases, including typhoid, dysentery, and even smallpox, which thrived in times of food shortages.Footnote51 The correlation circa 1630–1750 between deaths in Sweden (within today’s borders) and Stockholm’s grain imports, Rxy = + 0.49, very probably indicates malnutrition during years with bad harvests.
Of course, Stockholm’s trade was not exclusively steered by the need for food. For some periods, there was no evident correlation between mortality and grain imports or possible grain shortages. During the Great Northern War, with several serious crop-failures between 1708 and 1718, grain imports almost ground to a halt because much of Sweden’s Baltic imports were blocked. A spike in mortality between 1710 and 1711 was not caused by malnutrition but by a severe plague epidemic.
From Stockholm’s grain imports to a national estimate for Sweden
As we have seen from , Stockholm represented a big share of Sweden’s (within present borders) total foreign grain trade. National and Stockholm developments over time were highly positively correlated. For the 17th century and the period 1700–1750, the correlation coefficients Rxy were + 95 and + 98 respectively.Footnote52 The strong positive statistical correlation between grain trade for the country and Stockholm underscores the city’s dominant role. This makes it tempting to try to estimate national trade from that of Stockholm.
As Stockholm’s share of the national trade for periods varied over time, estimates have to take this into account. In the following estimates, different algorithms have been used for different periods. They are presented in the notes to . It should be remembered that the graph is based on estimates and necessarily approximate, as is evident from the source discussions above.
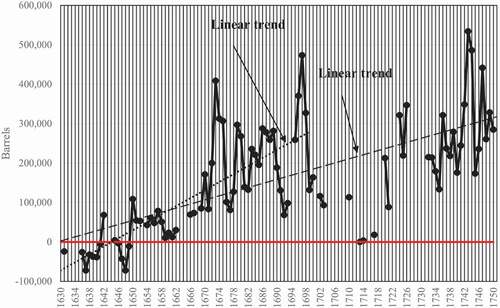
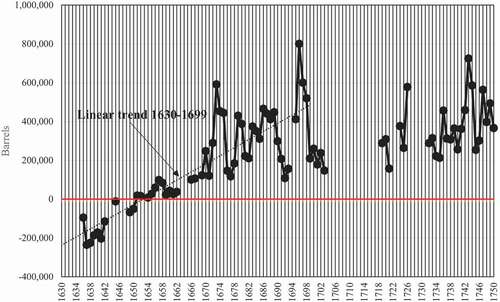
Figure 6. Sweden’s estimated net foreign grain trade 1630–1750.
Sweden’s grain trade and contemporary historical context
In view of known Swedish economic and social developments during the period – does the curve in seem reasonable? To answer this question, the period covered in the figure may be divided in three phases. The first stretches from the 1630s to c. 1700 and follows a strongly steep upward trend, with trade shifting from net exports to evidently heavy net imports around the middle of the century. In absolute numbers, the variations around this trend grow stronger and stronger over time. Extreme import peaks can be seen in the 1670s and 1690s. The latter peak is better known in Swedish historiography compared to the former. The 1670s peak is somewhat surprising, as it happened during Sweden’s, not least maritime, war between 1675–1679 with Brandenburg and Denmark-Norway. The imports in 1696–1697 were connected to the ‘three years of hunger’ 1695, 1696, and 1697, with severe crop failures due to cold and wet weather. This phase corresponds with a, by all indications, stagnant domestic grain production.
Early generations of historians, like Eli F. Heckscher, saw 17th century Sweden as backward and stagnant. But recent research has questioned this view.Footnote53 As agrarian historian Janken Myrdal put earlier historians’ view: ‘Sixteenth-century expansion, seventeenth-century stagnation’.Footnote54 In fact the 17th century phase coincides with a turbulent time for historical Sweden proper. Mining and metal exports expanded. For a brief period, Sweden nearly monopolized copper, iron, and tar production within Europe. Wars were frequent. A big war machine was created, and an arms industry developed. In several areas, a textile and metal proto industry started to develop. Great reforms were made in administration and land ownership, and the church was knit more tightly to the state, making the bureaucracy more effective. During the 17th century, urbanization resulted in 23 new cities being added to the 39 that already existed in 1600. Among the new were Gothenburg, soon to become Sweden’s second biggest city. In large areas, cattle breeding and forestry dominated. The Danish and Norwegian provinces annexed in 1645–1658 included the important grain-producing Scania.
The second phase, not well covered in the graph, coincides with the Great Northern War of 1700–1721 (Sweden against Russia, Denmark-Norway, and Saxony-Poland-Lithuania). Without a doubt, this was a period with troubled, declining foreign trade. During the war, Sweden successively lost its grain-rich possessions on the other side of the Baltic Sea. From around 1705, supplies from these areas were dwindling and finally cut off. Sweden now finally had to rely on its own food production and what could be imported via English or other neutral ships.
The third phase started with the peace of Nystad in 1721. Imports once again rose but at a somewhat slower pace than in the 17th century. Peaks still occurred, with one in 1726 following a crop-failure in the previous year and one in connection with the new Swedish-Russian war of 1741–1743. The phase is paralleled by clear signs of a growing domestic grain production. The following table shows harvest estimates for the two periods of 1698–1703 and 1745–1750 for provinces or counties where tithes were still directly related to harvests. The harvest developments in index form are shown in .
Table 4. Harvest indexes for parts of Sweden in period 1698–1750.
From the table, you can see that in important agricultural regions, like Närke, Västmanland and Uppsala county, harvests grew by 34–53%. In Västerbotten and Västernorrland in the north of Sweden, once frequent recipients of Stockholm imports, harvests grew by 38–45% . Notably, the mining county of Kopparberg seems to have remained dependent on deliveries from other areas or from imports as their local industries grew.
All in all, the table shows that grain production grew, on average, by 25% during the first half of the 18th century. Regrettably, the table excludes the important agricultural areas of Västergötland, Småland, and Scania provinces. In these areas, tithes had been fixed and did not mirror harvests any longer. For Scania, however, some local data point to a rise in harvests of almost 50% between the periods 1702–1707 and 1745–1750.Footnote55 Mortality crises became less intense with this phase.Footnote56
To a great extent, the graph in seems compatible with Swedish general economic, social, and political developments already known. An emerging manufacturing and industrial sector in the 17th century seems to have been partially fed by imported rather than domestically produced grain. What might be new is the fluctuations that bring to light the scale of change in the Swedish grain procurement system between the first and the third phase.
Demographic importance of Sweden’s foreign grain trade
To return to the initial subject of this article, grain as the main factor behind demographic changes, let us see what our imports mean in population trends. How many people could be nourished by the trade? Despite the variations, the 17th century linear trend can be seen as well established. Using this trend as a proxy and applying the Runeberg norm mentioned above – two barrels of grain per capita – gives the following theoretical number of people that could be nourished by the net foreign grain trade. Circa 1700, the estimated grain imports of 420,000 barrels, approximately corresponds to food for 210,000 people. The 1630s exports of 190,000 barrels logically indicates an overproduction of grain, enough to feed c. 95,000 people. Accepting the view held by most Swedish scholars of stagnant domestic grain production during the 17th century, this means that the Swedish population might have increased by some 300,000 people between the two benchmark periods.
At the beginning of this article, I promised to avoid any direct actual population estimates that might be disputed. There is, however, one generally supported estimate – for c. 1700 – c. 1,363,146 persons.Footnote57 Accepting this, the calculus points to the population c. 1630 having been at least some 300,000 smaller; a more precise figure must be estimated from other sources. The figure might be an underestimate, as much of possible imports from Finland and probably growing Crown grain imports are not included.
International context
It is a common view among modern historians that the 17th century was a period of rising productivity and social and economic sophistication. Cottage industry was more and more replaced by crafts, putting-out-system, and, successively, centralized industry. Originally, the production of cloth dominated, but the economy turned more diversified, and iron, arms, shipbuilding, and trade itself came to the fore. During the period, the dynamics of the north-western parts of Europe came to play a leading role in the continent’s economic development. International trade and markets grew and thus made various areas economically more integrated. Southern and eastern Europe were relatively stagnant.
Grain availability was a sine qua non for this development. For the Netherlands, grain imports from the Baltics grew more and more important from the late 16th century onwards.Footnote58 Already in the 16th century, an agricultural revolution developed in the Netherlands, where yield ratios for grain and milk became two or three times higher than those in other countries.Footnote59 In England, agricultural productivity and acreage expanded heavily.Footnote60 Between 1600 and 1700, the annual growth of the English agricultural output has been estimated at 0.21–0.30%.Footnote61 England was a net grain exporter in the 17th and 18th centuries. The Netherlands combined its domestic agricultural advances with grain imports.Footnote62
Does Sweden fit into the English and Dutch models? Regrettably, a comparison between the agrarian sectors’ contribution to the GDP for Sweden, England, and the Netherlands is problematic due to seemingly unrealistic grain production estimates used in the Swedish GDP reconstructions.Footnote63 There are, as already mentioned, many signs of early industrial developments in Sweden – mining, ironworks, weapons factories, urbanization etc. – picking up momentum in the 17th century. And all this had international connections. The country soon became one of the leading exporters of metal, supporting, for example, the beginnings of the English Industrial Revolution in the early 18th century by providing 82.5% of England’s iron imports and 40% of its iron needs. This development occurred after Sweden had had a monopoly in the European copper market for a century.Footnote64 So far, Sweden’s economic and social development followed a path similar to that of England’s and the Netherlands’. Sweden seems to have been a dynamic part of a vibrant region around the North Sea, a view shared by modern handbooks on world economic history.Footnote65
But one essential component in the English and Dutch growth process was missing in Sweden – their agricultural revolution. The agricultural productivity advances in the Netherlands and England had no equivalent in Sweden, where grain production stagnated in the 17th century. This should however, not be seen as a sign of backwardness or general stagnation. In fact, grain availability in the country grew considerably. The reason for this was decreasing grain exports and rising imports.
It would appear from the Swedish trade figures that it was a better option to let a part of the population be occupied in the newer industrial sectors and to import their food from abroad, rather than letting them stay in the agricultural sector to produce their own food.
Summary
Let us finally return to the initial question: Was there enough grain in Sweden in the 17th century to sustain a fast growing population? In that period, grain availability was not only a function of domestic production. An international grain trade grew; various countries were no longer totally dependent on domestic production. It is a well-known fact that Sweden took a lively part in this trade, but the volumes involved have until now been available for only a few years and not been put in relation to domestic production. This was due to the lack of easily accessible sources.
To fill the lacunae I focused on Stockholm, where there are well-preserved city archives from the 17th century. In particular, accounts for a fee called tunnepengar (‘barrel money’) turned out to be useful for reconstructing the grain imports. Trade volumes could be established for many more years than have hitherto been published. It can be shown that Stockholm was the country’s main port for grain imports at the end of the 17th century. The city functioned in fact as a conveyor of grain to the ironworks and mining districts in central Sweden, and forested areas with meagre grain cultivation in the north of the country.
The dominant role of Stockholm in the 17th century national grain trade – on average some 60% of the total – makes it relevant to use the town’s imports as a base for national estimates. (Regrettably, extant accounts for other ports are scarce.) The results of the careful reconstruction for all of Sweden are presented in . It shows that in the 1630s and 1640s Sweden was a net grain exporter. After that, things changed. Strong net imports emerge from c. 1650, a trend (temporarily) broken with the Great Northern War of 1700–1721. Sweden’s shift from a net grain exporter to a net importer was a very radical change. Total imports compared to domestic production reached between 13 and 18% during the second half of the 17th century.
The correlation between population and available grain was surely not perfect. With a stagnant domestic production, consumption per capita has, due to many factors, varied over time. We do not know much about possible changes in other food resources; for example, root vegetables, cabbages, fishing etc. Despite this uncertainty, the correlation between grain availability and population growth is likely to have been strong.
The results above indicate a long run average growth of Sweden’s population c.1630 – c. 1700 of at least 300,000 people. My conclusion is that the estimate in no way excludes the possibility of a relatively fast population growth in Sweden. On the contrary. However, Sweden’s actual demographic development in the 17th century must rather be established from direct sources (for example, poll tax lists and parish registers) than from inevitably imprecise grain estimates. Fortunately, the Swedish archives are very rich in this respect, compared with those of many other countries. Much work is yet to be done in this field of research.
Archival sources
The national archives, Stockholm (Riksarkivet)
On line at: https://www.riksarkivet.se or at: https://www.arkivdigital.se
Boskaps- m.fl. längder
Från norska Riksarkivet år 1900 överlämnade räkenskaper och handlingar
Landskapshandlingar
Lokala tullräkenskaper
Länsräkenskaper
Kammarkollegiet, Tull- o. licentkontoret, DII:4, Tullinkomster och persedelextrakt 1639-1716.
Kommerskollollegium, Kammarkontoret, Årsberättelser om utrikeshandeln, serie 2
Landshövdingarnas brev till Kungl. Majt.
Sammansatta Kollegier, volym 208a
City archives (mostly in the Swedish National Archive’s regional archives, the landsarkiven)
The national archives, Vadstena (Riksarkivet)
Norrköping, tolagsjournaler, mätarpengar.
Stockholm city archives (Stockholms stadsarkiv)
Stadskamreraren, Verifikationer.
Handelskollegiet, Diverse verifikationer.
Norrköping city archives (Norrköpings stadsarkiv)
Norrköpings stads arkiv, tolagsjournaler.
Disclosure statement
No potential conflict of interest was reported by the author.
Notes
1. Broadberry et al. Clarc’s Malthus, 640. (Rxy).
2. See for example Edvinsson, Harvests, Prices, 7–9; Recalculating Swedish, 168, 182.
3. Leijonhufvud Grain Tithes, 262: cf. Figures 76, 77.
4. Palm, Sverige 1690; Sverige 1630.
5. Hallberg et al. Skördar i Sverige.
6. Edvinsson, Recalculating Swedish, 181. Cf. Palm, Sweden’s 17th, 29.
7. von Stiernman, Samling utaf, 74–79.
8. Boéthius & Heckscher, Svensk handelsstatistik, and Historisk statistik för Sverige. Del 3. Utrikeshandel 1732–1970.
9. Axerlson, Bidrag till, 6.
10. Maybe the clerk confused the units of measurement, if they were läster, ‘lasts’ instead of barrels, the figure seems more realistic (~ 264,000 barrels).
11. Historian Marten Seppel (Feeding the Motherland), 221, seems to doubt all Wrede’s figures as he notes that the two largest towns in Estonia and Livonia combined, only exported 200,000 barrels between 1696–1697. 11–15% should be added for exports from the smaller ports in the two regions. In the second half of the 17th century, however, grain also came to Sweden from Baltic ports in Denmark, Holstein, Mecklenburg, Pomerania, Brandenburg-Prussia, and the Polish–Lithuanian Commonwealth.
12. Tomner, Stadens historia, 23.
13. Nils Wimarson (Ystad mot slutet, 76, 80) has published export figures for 1655 for the only grain trading Scanian ports of any significance at that time: Malmö 35,000 barrels, Ystad c. 20,700 and Landskrona about 8,500.
14. In 1636, the maritime customs of Stockholm was reformed, the duty could be paid at two places: at arrival to the city’s harbour or at a new inloppsstation, an entrance customs station, at the main inlet to the Stockholm archipelago, Dalarö. In 1661, for example, c. 4,880 barrels were cleared in Stockholm and 1,498 barrels via Dalarö. This division of the Stockholm’s customs was unpractical, and c. 1669 all customs duties had to be paid in the city harbour (Berggren, Linjetjänsten, 15, 21–22, 80). Boéthius & Heckscher, Svensk handelsstatistik, 664 f. and 701 f. That the 1661 ‘Stockholm’ figure (p. 664 f.) evidently excludes clearances at Dalarö, may indicate that this may have also been the case for the foregoing years 1658–1660 in the same series, thus somewhat underestimating Stockholm’s total trade (imports).
15. Quoted by Axelson, Bidrag till, 6.
16. Quoted by Seppel, Feeding the Motherland, 218.
17. Bergman, Strödda bidrag, 130.
18. This according to tunnepengar accounts (see following pages in the main text).
19. Probably Finnish deliveries to Gävle and the Swedish ports further north can be found in the remaining accounts for the Lilla tullen, the ‘little customs’ fee. Lilla tullen had to be paid for all domestic trade at the entrances of towns and marketplaces, be it by land or by sea.
20. According to Nordisk familjebok under ‘tolag’.
21. The nationalization of the tolag in 1680 probably decreased some of the differences between customs and tolag as the latter was included in a special column in the customs accounts. See, for example, the customs accounts for the ports of Visby 1696–1700, Västervik 1710, Nyköping 1710 (Swedish National Archives). In some ports the customs collected the tolag on the boats and delivered it to the port administration. Also cf. Lind, Göteborgs handel, 8.
22. In Malmö, a tolag and various port dues were combined in joint journals early on. Bjurling (Skånes utrikessjöfart) presents other Scania sources that provide information similar to that given by the tolag.
23. Boëthius & Heckscher, Svensk handelsstatistik, VIII–IX.
24. Lind, Göteborgs handel.
25. Bjurling, Skånes utrikessjöfart, 178 observed that Lind had missed some cargo from smaller boats.
26. Sandström, Mellan Torneå.
27. Sandström, Mellan Torneå, 86.
28. Sandström, Mellan Torneå, 87–88.
29. Seppel, Feeding the Motherland, 222.
30. Soom, Der baltische, notes p. 275–76, and pp. 302–4. When it comes to the Stockholm customs, no registers remain that let us scrutinize what cargoes were in reality recorded. Further studies of the accounting practice here have not been possible.
31. Cavallie, Från fred till krig, 26–27. I have a feeling that the Baltic Crown grain in the first half of the 17th century was directed more to the Swedish armies on the continent than to Sweden, in contrast to during peaceful periods later in the century.
32. For Scania Bjurling, Skånes utrikessjöfart, 160, 163, for other regions see Hallberg et al. 2016, pp. 29, 40, 71 and 152.
33. Soom, Der baltische, 56–58.
34. Cavallie, Från fred till krig, 26–27.
35. See note 29 above, 220.
36. Cavallie, Från fred till krig, 28.
37. Here the Swedish state’s budgets can be helpful. Their ‘grain dispositions’ reported what in-kind commodities could be transferred from the Baltic possessions to Sweden-Finland. Originally the Kammarkollegiet handled these budgets, but as of 1680 the disposition side was taken over by a new authority, the Statskontoret. Cavallie, Från fred till krig, 30–32.
38. Nordisk familjebok under ‘Stadsmätare’. In 1638 the Swedish diet decreed that all the country’s cities should employ sworn measurers and the cities were given the right to take mätarpengar or ‘measurer’s money’ for all measurable incoming goods.
39. For example, Bertil Boëthius and Eli F.Heckscher in Svensk handelsstatistik.
40. Ordning/Huruledes medh måhlandet på Spannemåhl … uti Staden och på Malmarne … skal förhållit blifwa, Stockholm 16 mars 1671; new versions 1699 Febr. 22 and 3 March 1712 and June 141,728. In the tunnepengar accounts for 1697 (p. 1440) you can see that small quantities in some boats were not really measured, but the skippers still had to pay the fee per declared barrel.
41. Stadskamreraren, Verifikationer, Stockholm City Archives. There might be accounts for some earlier years among other sources, not studied here. For some other ports, the accounts give a more sloppy impression, sometimes not specifying wether the barrels were imported or exported and if they contained salt or grain.
42. Sandström, From Torneå, 60–62.
43. An example of tolag and tunnepengar being combined in the same accounts can be found in the Norrköping tolagsjournal of 1692. Norrköping City Archives, National Archives, Vadstena.
44. You occasionally find Crown Grain mentioned in the tunnepengar accounts when corrections are made in the accounts. See, for example, Stadskamreraren, Verifikationer, 1695, p. 1643, Stockholm City Archives: ‘ … 50, 40 and 30 barrels with barley … . erroneously recorded by the newly employed measurer …, which should, as it is Crown grain, be registered in the Crown book, and not here’. A few other times Crown grain measurements have been registered, for example in 1697 (p. 5324) when 7,429 ¾ barrels were measured for ‘K.M:t och kronan’, that is, the government. This was an exceptional measurement, and contrary to other posts in the registers from the time an export one of Crown grain to be sent from Stockholm to Turku, Vasa, Viborg and Gamla Karleby ports in Finland. The tunnepengar at the time normally only measured incoming cargoes.
45. Hecksher, Svenskt arbete, 129.
46. Axelson, Bidrag till, 15–16; Soom, Der baltische, 65, note 130.
47. Runeberg, Fortsättning af, 138–40. What size Runeberg’s barrels were is not clear, as he used the same undefined barrels for production, consumption, and seed corn, and used the norm of one barrel per tunnland, literally in Swedish ‘barrelland’, the normal field area unit. But there is also a lower estimate of the per capita consumption for 1690 by David Hannerberg, who found that 1.76 barrels of grain were consumed per capita in the province Närke, a figure he thought could also apply to other areas (Hannerberg, Svenskt agrarsamhälle, 94–95).
48. Historisk statistik för Sverige, D. 1, Table A 5 and A 16.
49. Runeberg, Fortsättning af, 139–40.
50. Lilja, Städernas folkmängd, 119. 1676 according to Hecksher, Svenskt arbete, 129.
51. Larsson, Den dolda, 93–95.
52. Combining the Stockholm numbers with those of Gothenburg was tried, but gave a worse estimate of the national figure than that from Stockholm alone.
53. See for example Palm, Livet, kärleken, 112–13 and Sweden’s 17th; Schön & Krantz, New Swedish and The Swedish Economy.
54. Myrdal, Farming and Feudalism, 102.
55. Database from Olsson & Svensson 2017, based on private priest accounts for the priest’s part of the tithe, one third in Scania, a part that was not always fixed in Scania.
56. Larsson, Den dolda, chapter 4.
57. Widén, A Retrojection.
58. van Tielhof, The Mother; Curtis & Dijkman, The Escape. Different aspects of the 17th century Baltic grain trade has been studied by i.a. Soom, Der baltishe and Seppel, Feeding the Motherland.
59. DuPlessis, Transitions, 73.
60. For literature see Seppel, Feeding the Motherland, 217, note 21.
61. Broadberry et al., Clark’s Malthus, Table 1.
62. de Vries, The Economy, 81.
63. For example Edvinsson, Swedish Harvests and Swedish GDP. His estimate of 660,000 tons seems far too high. For 1751–1760, respected historian Karl Åmark (Spannmålshandel) estimated harvests in the country to be around 483,700 tons. This contradicts a unanimous view held among scholars that the 18th century after 1721 was a period of generally expanding agriculture in Sweden. Also for 1750, Edvinsson doubled down – proposing some 850,000 tons, a volume almost on par with actual comprehensive and meticulous estimates from over 4,000 land survey maps from circa 1810 (909,000 tons). I thank historian Erik Hallberg for this information from the ongoing project Databasen Sveriges åker 1810 och 1870.
64. Heckscher, Svenskt arbete, 101–3, 110–11.
65. E.g. Malanima, Pre-modern.
References
- Åmark, Karl. Spannmålshandel och spannmålspolitik i Sverige 1719-1830. Stockholm: Diss. Stockholms Högskola, 1915.
- Axelson, Gustaf Edvard. Bidrag till kännedomen om Sveriges tillstånd på Karl XII:s tid. Uppsala: Diss. Uppsala universitet, 1888.
- Berggren, Jan. “Linjetjänsten.” In Tullverket 1636–1986. En jubileumsbok, 78–109. Stockholm: Generaltullstyrelsen, 1986.
- Bergman, E.W. “Strödda bidrag till Västerbottens äldre kulturhistoria.” Historisk Tidskrift 10 (1890): 107–136.
- Bjurling, Oscar. Skånes utrikessjöfart 1660-1720: En studie i Skånes handelssjöfart. Lund: Diss. Lunds universitet, 1945.
- Boëthius, Bertil, and Eli F. Heckscher. Svensk handelsstatistik 1637-1737: Samtida bearbetningar [ Swedish statistics of foreign trade 1637-1737: contemporary accounts/med understöd av statsmedel … utg. av Stockholms stadsarkiv genom Bertil Boëthius och Eli F. Heckscher]. Stockholm: Thule, 1938.
- Broadberry, Stephen, Bruce M. S. Campbell, Alexander Klein, Mark Overton, and Bas van Leeuwen. “Clark’s Malthus Delusion: Response to ‘Farming in England 1200–1800.” Economic History Review 71, no. 2 (2018): 639–664. doi:10.1111/ehr.12694.
- Cavallie, James. Från fred till krig: De finansiella problemen kring krigsutbrottet år 1700. Uppsala: Diss. Uppsala universitet, 1975.
- Daniel, R. Curtis, and Jessica Dijkman. “The Escape from Famine in the Northern Netherlands: A Reconsideration Using the 1690s Harvest Failures and a Broader Northwest European Perspective.” The Seventeenth Century 34, no. 2 (2019): 229–258. doi:10.1080/0268117X.2017.1410494.
- de Vries, J. The Economy of Europe in an Age of Crisis. Enskede: TPB, 1976.
- DuPlessis, R.S. Transitions to Capitalism in Early Modern Europe. Cambridge: Cambridge University Press, 1997.
- Edvinsson, Rodney. “Harvests, Prices and Population in Early Modern Sweden.” Stockholm Papers in Economic History 1, no. 1 (2008): 1–72.
- Edvinsson, Rodney. “Swedish Harvests, 1665-1820: Early Modern Growth in the Periphery of European Economy.” Scandinavian Economic History Review 57, no. 1 (2009): 2–25. doi:10.1080/03585520802631592.
- Edvinsson, Rodney Benjamin. “Swedish GDP 1620–1800: Stagnation or Growth?” Cliometrica 7, no. 1 (2013): 37–60. doi:10.1007/s11698-012-0082-y.
- Edvinsson, Rodney. “Recalculating Swedish Pre-census Demographic Data: Was There Acceleration in Early Modern Population Growth?” Cliometrica, Journal of Historical Economics and Econometric History, Association Française de Cliométrie (AFC) 9, no. 2 (2015): 167–191.
- Hallberg, Erik, Lotta Leijonhufvud, Martin Linde, and Lennart Andersson Palm. Skördar i Sverige före agrarrevolutionen: Statistisk undersökning av det rörliga tiondet fr.o.m 1665: Introduktion till databaser. Göteborg: Institutionen för historiska studier, Göteborgs universitet, 2016.
- Hannerberg, David. Närkes landsbygd 1600-1820: Folkmängd och befolkningsrörelse, åkerbruk och spannmålsproduktion. Göteborg: Diss. Göteborgs Högskola, 1941.
- Hannerberg, David. Svenskt agrarsamhälle under 1200 år: Gård och åker, skörd och boskap. Stockholm: Läromedelsförlaget, 1971.
- Heckscher, Eli F. Svenskt arbete och liv: Från medeltiden till nutiden. 6 ed. Stockholm: Aldus/Bonnier, 1969.
- Historisk statistik för Sverige D. 3 Utrikeshandel 1732-1970, Foreign trade 1732-1970. Örebro: Statistics Sweden, 1972.
- Larsson, Daniel. Den dolda transitionen. Om ett demografiskt brytningsskede i det tidiga 1700-talets Sverige. Göteborg: Diss. Göteborgs universitet, 2006.
- Leijonhufvud, Lotta. Grain Tithes and Manorial Yields in Early Modern Sweden: Trends and Patterns of Production and Productivity c.1540-1680. Uppsala: Diss. Sveriges lantbruksuniversitet, 2001.
- Lilja, Sven, and Nilsson Lars, ed. Historisk tätortsstatistik D 2 Städernas folkmängd och tillväxt: Sverige (med Finland) ca 1570-tal till 1810-tal. Stockholm: Stads- och kommunhistoriska institutet, 1996.
- Lind, Ivan. Göteborgs handel och sjöfart 1637-1920: Historisk-statistisk översikt. Göteborg, 1923.
- Malanima, Paolo. Pre-modern European Economy: One Thousand Years (10th-19th Centuries). Leiden: Brill, 2009.
- Myrdal, Janken. “Farming and Feudalism, 1000-1700.” In The Agrarian History of Sweden 4000 BC to AD 2000, eds. Janken Myrdal and Mats Morell, 72–117. Malmö: Nordic Academic Press, 2011.
- Nordisk familjebok – Konversationslexikon och realencyklopedi. Stockholm: Nordisk Familjeboks Förlag, 1919.
- Olsson, Mats, and Patrick Svensson. “Estimating Agricultural Production in Scania, 1702-1881: User Guide for the Historical Database of Scanian Agriculture, and Overall Results”. Lund Papers in Economic History 151 (2017).
- Oxenstierna, Axel. Axel Oxenstiernas skrifter och brefvexling, Rikskansleren Axel Oxenstiernas skrifter och brefvexling Afd. 1. Bd 5 Bref 1630. Stockholm: Norstedt, 1915.
- Palm, Lennart Andersson. Livet, kärleken och döden: Fyra uppsatser om svensk befolkningsutveckling 1300-1850. Göteborg: Göteborgs universitet, 2001.
- Palm, Lennart Andersson. Sverige 1690. Åkerbruk, boskapsskötsel, skog, befolkning [ Andra upplagan)]. Göteborg: Göteborgs universitet, Institutionen för historiska studier, 2016a.
- Palm, Lennart Andersson. Sverige 1630 - Åkerbruk, boskapsskötsel, befolkning [ Andra upplagan)]. Göteborg: Göteborgs universitet, Institutionen för historiska studier, 2016b.
- Palm, Lennart Andersson. Sweden’s 17th Century – A Period of Expansion or Stagnation? Göteborg: Göteborgs universitet, Institutionen för historiska studier, 2016c.
- Palm, Lennart Andersson. “Estimating Sweden’s Population in the Early Modern Period – Methods and Numbers.” Bebyggelsehistorisk Tidskrift 81 (2021): 67–98.
- Runeberg, Edvard Fredric. Fortsättning af Kongl. Tabell-commissionens economiska anmärkningar, och särdeles om landtbruket, samt om den dervid arbetande folkhopen. Stockholm: Kungl. Svenska Vetenskapsakademiens Handlingar, 1770.
- Sandström, Åke. Mellan Torneå och Amsterdam: En undersökning av Stockholms roll som förmedlare av varor i regional- och utrikeshandel 1600-1650. Stockholm: Diss. Stockholms universitet, 1990.
- Schön, Lennart, and Olle Krantz. “The Swedish Economy in the Early Modern Period: Constructing Historical National Accounts.” European Review of Economic History 16, no. 4 (2012): 529–549. doi:10.1093/ereh/hes015.
- Schön, Lennart, and Olle Krantz ”New Swedish Historical Accounts since the 16th Century in Constant and Current Prices.” Lund Papers in Economic History 140 (2015).
- Seppel, Marten. “Feeding the Motherland: Grain Exports from the Swedish Baltic Provinces during the Great Famine of 1696–1697.” Scandinavian Economic History Review 63, no. 3 (2015): 215–234. doi:10.1080/03585522.2015.1081855.
- Soom, Arnold. Der baltische Getreidehandel im 17. Jahrhundert. Stockholm: Almqvist & Wiksell, 1961.
- Tomner, Lennart. “Stadens historia 1500–1658.” In Malmö stads historia D. 2, edited by Oscar Bjurling. Malmö: Malmö stad, 1977.
- van Tielhof, Milja. The ‘Mother of All Trades’: The Baltic Grain Trade in Amsterdam from the Late 16th to the Early 19th Century. Leiden: Brill, 2002.
- von Stiernman, Anton. Samling utaf kongl. bref, stadgar och förordningar & c. angående Sweriges rikes commerce, politie och oeconomie uti gemen, ifrån åhr 1523. in til närwarande tid. Del 2. Stockholm: Kongl. tryckeriet, 1750.
- Widén, Lars. ”A retrojection back to 1700.” Urval 8 (1976): 169–186.
- Wimarson, Nils. Ystad mot slutet av danska tiden: Några anteckningar rörande Ystads administrativa, ekonomiska och merkantila förhållanden under förra hälvten av 1600-talet. Ystad, 1918.