
 ?Mathematical formulae have been encoded as MathML and are displayed in this HTML version using MathJax in order to improve their display. Uncheck the box to turn MathJax off. This feature requires Javascript. Click on a formula to zoom.
Abstract
This paper presents annual Swedish time series data on the top marginal tax wedge and marginal tax wedges on labour income for a low-, average- and high-income earner for the period 1862–2010. These data are unique in their consistency, thoroughness and timespan covered. We identify four distinct periods separated by major tax reforms. The tax system can be depicted as proportional, with low tax wedges until the Second World War. Next follows a period featuring increasing tax wedges. During the third period, starting with the 1971 tax reform and continuing throughout the 1980s, the efforts to redistribute income culminated and tax wedges peaked. The high-income earner started to pay the top marginal tax wedge which could be as high as almost 90%. The main explanations for this development are temporary crises leading to permanent tax increases, expansion of the public sector, distributional ambitions, increased local taxes, bracket-creep and the introduction of social security contributions paid by employers. The 1990–1991 tax reform represents the beginning of a new and still continuing period with decreasing marginal tax wedges.
1. Introduction
Taxation has profound effects on many economic decisions, such as labour supply, savings and investments. The taxation of factors of production – especially labour and capital – has attracted particular interest since taxation is a major determinant of their quantity, quality and usage over time. This paper studies labour income taxes in Sweden (we will treat capital taxation in a separate article).Footnote1 We will analyse how the tax levels on labour income have developed over time, if any turning points can be detected and if certain time periods with distinct characteristics can be distinguished in Swedish tax history.
Much research on labour taxation concerns the effects of marginal taxation as it influences, among other things, labour supply in hours, effort at work, efficiency at work, educational efforts and timing of consumption.Footnote2 Therefore, we also expect changes in marginal tax rates to influence the growth rate of taxable income, real gross domestic product (GDP) and other macroeconomic aggregates.
Even though the effects of the tax system have been studied extensively, the results are often complex and ambiguous. Empirically, problems repeatedly arise because the effects of taxation should be assessed over long time spans; however, data are in general only available for relatively short periods. Hence, there is a need for research to produce long homogenous time series on taxation, which can further our understanding of the structure of the tax system and its role in industrialisation and creation of wealth.
Rather than examining the effect from one narrow form of taxation, like the marginal income tax on labour, a wider measure – such as the marginal tax wedge on labour – is often preferable.Footnote3 The marginal tax wedge on labour incorporates marginal income taxes, marginal social security contributions and marginal payroll taxes. Consumption taxes can be included as well, and social security contributions can be adjusted to include only the fiscal part. This measure better captures the effect on individual decision-making and it is also the main determinant of the excess burden of taxation, i.e., the distortionary costs in the economy that taxes create.Footnote4
The purpose of this paper is to calculate the long-term evolution of the marginal tax wedges on labour income for Sweden. We believe that Sweden is of interest as a policy experiment. To finance the rise of the welfare state, the Swedish tax-to-GDP ratio increased from one of the lowest in the Western countries at the beginning of the twentieth century to the highest in the world in the mid-1960s.Footnote5 Sweden has kept the highest tax-to-GDP ratio until recently, having been surpassed by Denmark.Footnote6 Considered as the ‘archetype’ of the welfare state, Sweden has attracted particular notice from researchers and policy-makers and sparked an unsettled debate about the possibility of combining high taxes and economic growth.Footnote7 As a neutral country during both World Wars, Sweden also avoided massive destruction, making long run analysis appropriate, as the long-term outcome pattern for many other European countries may be severely affected by these events. Sweden also has excellent tax records making an analysis possible to accomplish.
As the marginal tax wedges often change with income, it is not possible to derive one measure of the marginal tax wedge valid for all incomes. In this paper, we will therefore compute the top marginal tax wedge as well as the marginal tax wedge for a high-, average- and low-income earner. Parallel to these measures, we compute the income level where the top marginal tax wedge starts to apply.
The analysis begins in 1862 when Sweden implemented a major new state (central government) tax system. The decades around the 1850s are historically important, as the Swedish economy was extensively deregulated, industrialisation began and growth levels took off.Footnote8 Hence, we will exploit official statistics and tax laws to describe almost 150 years of tax rates.
Marginal tax rates on labour income, especially top marginal tax rates, for several countries (including Sweden) have been examined in a number of studies.Footnote9 Country-specific analyses covering marginal tax rates have been done for the USA,Footnote10 the UKFootnote11 and Germany,Footnote12 for example. Yet, none of these studies go as far back as 1862 and they have not calculated the marginal tax wedge on labour. Neither has the income at which the top marginal tax wedge starts to apply been calculated. Hence, no one has generated this kind of data-set for Sweden before, and we are unaware of any international studies covering such a long time span. We hope that our work will stimulate international long-term research on marginal tax wedges. Together with tax data from other economies, our data can be used to conduct long-term comparative analyses between countries.
This paper is organised as follows. In the next section, the marginal tax wedge on labour is defined. Section 3 discusses income taxes and Section 4 describes social security contributions paid by employees. In Section 5, the development of marginal taxes is illustrated, whereas Section 6 depicts social security contributions paid by employers. Section 7 portrays the evolution of marginal tax wedges on labour. Section 8 concludes. The appendix presents the sources underlying the calculations.Footnote13
2. The marginal tax wedge on labour income
2.1. Definition
Taxes on labour income drive a wedge between the price of labour paid by firms and the net return on labour received by employees. This difference is formally called the tax wedge on labour income (or tax wedge for short). The tax wedge may influence the incentive to supply and demand labour, the magnitude of taxable income as well as the wage formation process. There is no consensus on how to define the tax wedge. To further cross-country and longitudinal comparisons, we follow OECD (Citation2011) and calculate the marginal tax wedge, tw, as:(1)
(1)
where t1 is the marginal income tax, t2 is the marginal social security contributions (SSCs) paid by employees and t3 is the marginal SSCs, including the payroll taxes, which are added to the wage and paid by employers.Footnote14 The marginal tax wedge measures the difference between the total labour costs paid by the employers and the net wage received by the employees, as a result of a marginal increase in the labour income. The wedge is expressed as a percentage of the change in labour compensation, including the SSCs.
Alternative definitions of the tax wedge add consumption taxes or adjust for the estimated benefit part of the SSCs.Footnote15 In particular, some of the SSCs may correspond to a benefit and should then be viewed as insurance fees. One may argue that this insurance part should not be included in the tax wedge. It may be important to adjust the SSC for the benefit part as a description and analysis of the tax system without these adjustments will be skewed.Footnote16 Comparison over time within a country could hence include an adjustment for the benefit part.
Others argue, however, that all SSCs should be treated as taxes as they are compulsory and unrequited payments to governments.Footnote17 Although there might be some link between contribution and benefit, country comparison should treat SSCs as a tax as the country choice between general taxes and earmarked compulsory contribution should not alter the comparison. The perceived relationship between incremental contributions and incremental benefits may, further, likely be weak if the contributions are compulsory.Footnote18 Most researchers, as well as the OECD, also ignore the benefit parts and treat SSCs as a pure tax. In line with the OECD, we treat the SSCs as a pure tax. We have, however, also made calculations where we exclude the estimated benefit part of the SSCs from the tax wedge. Our general conclusions do not change and the long-term evolution for the three income groups remains basically the same if we use alternative definitions of the tax wedge.Footnote19 Private insurances are regarded to correspond fully to a benefit by OECD and are not included in the tax wedge.
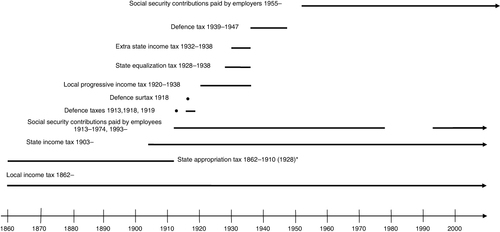
In Sweden, income taxes have been paid both to municipalities (local government) and to the state (central government) throughout the period under review. Temporary taxes have been introduced in times of distress, for instance for rearming the military during the World Wars. Social security contributions were introduced in the twentieth century. summarises the taxes that affect the marginal tax wedge on labour.
*The state appropriation tax was transformed to a local tax in the 1911 tax reform, and the appropriation system worked as a parallel local tax system between 1911 and 1928.
2.2. Taxpayer characteristics
OECD started to report wage data on an average production worker (APW) in 1972, defined as the average gross wage earning of adult, full-time, manual workers in industry sector D in the International Standard Industrial Classification of all Economic Activities, Revision 3 (ISIC Rev. 3). The series on wage data were complemented in 1979 with calculations on average tax rates and average tax wedges for two family types (single person and one-earner married couple) earning 100% of the APW. The analysis was expanded in 1997 to incorporate 12 tax measures (including marginal tax measures) for eight different types of taxpayers, characterised by different family status (single/married, 0–2 children), economic status (one-/two-earner household), and wage levels (67%, 100% and 167% of the APW). The OECD excludes non-wage incomes, like capital income or business income, and only considers standard tax reliefs (such as basic allowances; grundavdrag). Non-wage incomes are generally small for employees and the OECD wants to focus on tax treatment of wages. Taxpayer's wealth is not considered either since wealth does not impact taxation on labour income in any OECD country for the time period the OECD covers.Footnote20
In 2005, the OECD switched to using an average worker (AW) as a base for the wage, defined as the average gross wage earning of adult, full time manual and non-manual workers covering industry sectors C–K in ISIC Rev. 3, or its equivalent.Footnote21
In accordance with the OECD, we base our analysis on wage levels reported by the OECD and define a high-, average- and low-income earner as a taxpayer earning 167%, 100% and 67% of the APW, respectively. As OECD changed their definition in 2005, we will use wage data on the average production worker from the Confederation of Swedish Enterprise (Svenskt Näringsliv) between 2005 and 2010.Footnote22 This data conform to the wage data on the APW provided by the OECD. We have calculated the tax wedge given the new definition of OECD as well (not presented in this paper) and our results remain. To estimate the income level for the average-income earner before 1972, we used the average wage for a worker within the manufacturing and handicrafts sector in the data-set on labour income compiled by Edvinsson.Footnote23 Edvinsson's wage data do not deviate significantly from the wage data provided by the OECD and the linking of the two series does not impact our results.
As will be discussed below, the general evolution of the tax wedges is not much affected by taxpayers’ characteristics. First, because many of them only affect taxation on labour income for limited periods of the time span covered by our analysis. Second, because different deductions and allowances are too small in general to impact the marginal tax wedge. Third, because the general structure of the tax system makes tax wedges rather insensitive to different characteristics. For presentational purposes, we will show the tax wedges for single persons with no children and no wealth. In line with the OECD, we exclude non-wage income and only consider standard tax relief, such as basic allowances.
2.3. Wage level
There are full time employees falling outside the interval 0.67–1.67 times the APW. Nevertheless, practically all of them are covered by our computations. As the low-income earner (earning 0.67 times the APW) will almost always be in the lowest tax bracket until the Second World War, taxpayers earning less than 0.67 times the APW will face the same marginal tax wedge as the low-income earner. When it differs, the difference is negligible. Hence, the evolution of the tax wedge for taxpayers earning less than 0.67 times the APW is basically the same as for the low-income earner for this period. After the Second World War, the Swedish wage structure became compressedFootnote24 and few full-time workers earned less than 0.67 APW.
At the other end of the income distribution are wage earners that report wages above the upper limit of the interval. There has been a concern that they are of strategic importance for economic development.Footnote25 How does the tax wedge evolve for individuals earning two, three, five or 10 times the average production worker? As described below, the tax system was, in practice, proportional until the Second World War and unless the income was substantially higher, the tax wedge will be about the same as for our examined income groups. Even if the wage was 15 times the APW, for example, the marginal tax wedge in 1938 would still only be less than 5 percentage points higher.
The tax system became progressive in practice in connection with the Second World War, and the tax wedge for most employees earning more than the high-income earner started to lie between that of the high-income earner and the top marginal tax wedge. The gap between the top tax wedge and the tax wedge on the high-income earner narrows nearer the end of the 1980s, when it closes. To illustrate this, consider, for example, that it required 400 times the income of the APW to pay the top marginal tax wedge in 1938, 36 times in 1950, 13 times in 1960, 7 times in 1970 and 2.5 times in 1980. From the end of the 1980s until the end of the 1990s, the marginal tax wedge for employees earning more than the high-income earner and the marginal tax wedge on the high-income earner coincided with the top marginal tax wedge. The top marginal tax wedge exceeds the wedge of the high-income earner with about 4 percentage points during the 2000s. This means that all, or close to all, full time wage earners had a marginal tax wedge lying within the interval, represented by the low and high-income earner throughout the examined period.
2.4. Family and economic status
In Sweden, joint taxation of families was used until 1971. Married couples had more generous basic allowance than singles between 1920 and 1970 and lower tax rates than singles for a given taxable income between 1953 and 1970.Footnote26 Our analysis reveals that the more favourable treatment of married couples does not have any discernible effect on tax wedges before the Second World War. The marginal tax wedge will be somewhat lower for one-earner married couples than for singles after the Second World War until the abolishment in 1971. Besides that, the tax wedge for married one-earner couples and singles basically shows the same evolution. If both spouses were working, the favourable treatment is reduced and can even be reversed, i.e. the marginal tax wedge for a two-earner married couple could be higher than for singles. The long-term evolution of the tax wedge basically remains the same independent of family conditions.Footnote27
Child allowance was introduced in 1920 and applied up until 1952 on the local tax, and up until 1948 on the state tax. The local tax allowance had no direct effect on the marginal tax as the local tax was proportional. The direct effect of the tax allowance for the state tax is zero or negligible as it is too small to influence our results (at most about 1 percentage point for the high-income earner with two children).
2.5. Non-wage incomes and tax reliefs
Business income has been taxed together with labour income in Sweden throughout the whole period examined, while capital income has been taxed jointly with labour income between 1903 and 1991. Full time employees, in general, report low or no income from business operations, and capital income is highly skewed.Footnote28 Capital income is usually negative for ‘ordinary’ income earners, since interest on mortgages is deductible from other capital income, and when capital income is positive it is usually small. Interest costs may be large, especially for younger taxpayers who recently began a career, started a family and bought a home.
Besides the possibility to deduct interest costs, there exist other non-standard tax reliefs such as the possibility to deduct costs necessary for acquisition of income. These reliefs were low in general and often limited by law. A previous study has calculated the tax wedge between 1952 and 1993 taking estimated interest costs and other non-standard tax reliefs, such as costs necessary for acquisition of income, into consideration.Footnote29 Comparing the marginal tax wedge from that study with our results, the differences are minor. The largest difference is about 5 percentage points for the average-income earner between 1977 and 1982.Footnote30 Hence, these tax reliefs are of minor importance for the general evolution of the marginal tax wedge.
2.6. Wealth
Combined wealth and income taxation (meaning that a part of wealth was included in taxable income) was used in Sweden between 1911 and 1947 (a separate wealth tax was introduced in 1934 as well). Up until 1938, 1/60th of wealth was due to state taxable income and 1/100th thereafter. However, to increase the marginal tax wedge more than marginally, extensive wealth was required. It would, for example, require that an average-income earner held wealth corresponding to more than 200 times her/his yearly labour income to affect the tax wedge in year 1930, and the effect would increase the wedge by only about 1 percentage point.
2.7. General tax structure
Generally speaking, the structure of the tax system was such that considering other non-labour income, non-standard tax reliefs and wealth, would not alter the evolution of the tax wedges materially. The tax system was proportional until the tax reform in 1903 and changes in the taxable income would not change the marginal tax wedge. Between 1903 and 1919, the tax system was slightly progressive, tax levels were low and any small change in taxable income would only marginally change the marginal tax wedge without altering the general evolution. Between 1920 and 1938, progressivity was higher but the tax brackets were very wide and most taxpayers were situated in the lowest tax bracket. To alter the marginal tax wedge more than marginally, the taxable income must change considerably. Hence, even though deductions or increased income may imply that the income earner fall into a new tax bracket between 1903 and 1939, the difference in the tax rates will be low and the effect on the marginal tax wedge negligible.
After the Second World War, the tax system was more progressive and tax brackets more narrow. However, even if deductions reduced the taxable income and made the income earners fall into a lower tax bracket, the difference in tax rates was low and the effect on the marginal tax wedge small.
3. Income taxes
This section briefly presents the development of state and local income taxes. The presentation of the state income taxes is more extensive as it includes several major changes.
3.1. State income taxes
During the nineteenth century, Sweden had a state income tax system based on so-called appropriations. The system was rather heterogeneous, taking its roots in the economic and social order present in the agricultural society. A major reform was implemented in 1862, which simplified the system reducing income tax groups from eight to two (appropriation on real estate income and appropriation on labour or capital income).Footnote31 Parallel to these income taxes, there were also some basic taxes (grundskatter), such as armament fees and personal protection fees, which can be characterised as lump-sum taxes. These taxes were mainly phased out during the 1890s.
A completely new state income tax system, considered to be the predecessor of today's ‘modern’ tax system, was implemented in 1903. Among other things, it became mandatory for taxpayers to provide an income tax return. This tax system was slightly progressive. The old appropriation tax system was not abolished and two parallel systems existed, side by side, until a new state tax reform was implemented in 1911.Footnote32
Major state tax reforms were then implemented in 1920, 1939, 1948, 1971, 1983–1985 and 1990–1991. Initially, the tax system had a pure fiscal function, i.e. taxes were collected in order to finance public expenditures; the state budget should be in balance. During the 1930s, the function of the tax system was expanded to also dampen cyclical fluctuations and stabilise the economy by under- or over-financing the budget. At the end of the 1940s a more pronounced function of redistribution was included as an important aspect of the tax system.
Parallel to the ordinary state tax system, temporary taxes were in place during and between the World Wars. When the ordinary state tax system was reformed, the temporary tax increases were often included in the new ordinary tax system schedule and the temporary tax increases were in this way made permanent. This is more or less true for the tax reforms in 1920, 1939 and 1948.
The 1920 state tax system was more progressive than the 1903 and 1911 state tax systems, but the first tax bracket was very wide (the upper limit corresponds to more than three times the wage of an average-income earner in 1920) and included the majority of all taxpayers.Footnote33 With the 1939 tax reform, the state marginal income tax rate starts to differ significantly between the three examined income groups. The 1948 tax reform was almost exclusively endorsed from a redistribution perspective, which was highly controversial at that time and the system was decided upon in disagreement after a heated debate in parliament.Footnote34
As can be seen from , the state marginal income tax rate was low initially but increased sharply after the tax reform of 1939 and 1948. The state top marginal income tax rate increased sharply already with the First World War and the subsequent tax reform in 1920.
Note: High-, average- and low-income earner refers to 167, 100 and 67% of the wage of an average-income earner, respectively. The spike in the state top marginal income tax rate in 1913 refers to a temporary defence tax that was decided in 1914 but based on the income in 1913 (hence it was a retroactive tax). It was considered so heavy that payment was split over three years 1915, 1916 and 1917. The dip in 1971 is explained by adjustment of the state tax due to the abolishment of the deduction for local taxes.
Source: Own calculations based on sources in Appendix.
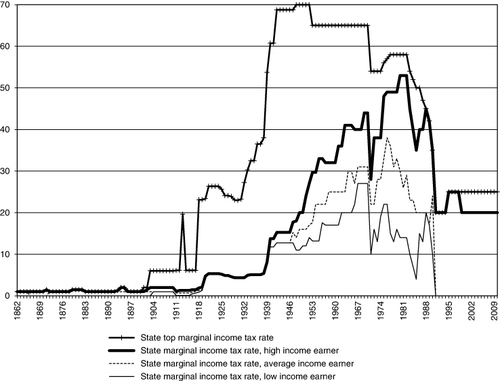
Although no new major state tax reform was implemented until 1971, the state tax rate increased profoundly for wage earners after the Second World War.Footnote35 The driving force behind this sharp increase was so-called bracket creep, i.e. when price and wage inflation in combination with a progressive tax schedule pushes taxpayers into higher tax brackets with higher marginal income tax rates. This inflation-driven tax increase mechanism meant that politicians did not have to pass new tax laws to increase tax rates and tax revenues.
The tax reform of 1971 implied that the deduction of the local tax paid was abolished. The statutory tax rate decreased. However, taking into account this change of rule, the marginal income tax rate could be substantially higher, but also lower for taxpayers with low income. For redistributional purposes, marginal income tax rates and progressivity was further sharpened in this reform.Footnote36
On-going and increasing inflation in combination with the nominal progressive tax system made it necessary to adjust tax rates on a regular basis to keep the real tax level constant and to avoid an accelerating inflationary process. These changes were focused on low-income earners who faced lower marginal income tax rates. However, to avoid lower marginal income tax rates in the lowest tax bracket resulting in lower total tax for high-income earners, the marginal income tax for average and high-income earners was increased.Footnote37 This resulted in an increased progressivity in the income tax.Footnote38
With minor tax reforms implemented in 1983–1985, and in particular, a major tax reform in 1990–1991, the tax rates decreased. After the tax reform in 1990–1991, the tax schedule initially consisted of one state income tax rate at 20% that was supposed to be paid by high-income earners only. Due to the crises and the depression of the 1990s, the tax rate was increased and later split up into two new tax brackets at 20 and 25%. In 2007, a tax credit for earned income was implemented. A minor tax credit for low- and average-income earners was in place between 1999 and 2002.
3.2. Local income taxes
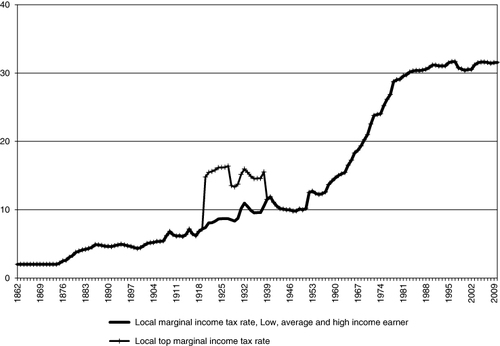
A local tax system existed parallel to the central government's system of taxation during the studied period. A major reform was implemented in 1863, which – in the same way as the state income tax – simplified the system and included a proportional income tax. At the beginning of the twentieth century, the local income tax was debated intensely by politicians. With the state tax reform in 1920, a temporary local tax reform was introduced (kommunalskatteprovisorium). At this time a temporary progressive local tax system was also introduced, which was in place until just before the outbreak of the Second World War. A major local tax reform was first implemented in 1928. It mostly affected the technical and legal part of the local tax system. This reform still constitutes the foundation of the local tax system.Footnote39
As can be seen from , the local tax increased slowly before the Second World War, ignoring the temporary local progressive tax.Footnote40 After the War, it increased faster and almost tripled until the 1980s. Since then, it has increased slowly.
Note: See .
Source: Own calculations based on sources in Appendix.
4. Social security contributions paid by employees
Taxpayers have occasionally also paid social security contributions (SSCs). The first SSC paid by employees was implemented in 1913 (a national basic pension contribution) and a second in 1955 (a health insurance fee). The marginal effect from these contributions was at most 5%. Both these contributions had an upper income cap, above which no contribution was paid so that the marginal effect was zero. In the mid-1970s, the national basic pension contribution was converted to a contribution paid by employers and the health insurance fee was abolished.
In 1993, SSCs paid by employees were reintroduced. The fees increased from an initial rate of about 1% in 1993 to 7% in 2000. As from 2000, the contributions were compensated by a tax deduction, and as from 2006, the contributions were fully compensated and did not impact the marginal tax. These contributions had an income cap as did the earlier contributions.Footnote41
5. The marginal tax rate
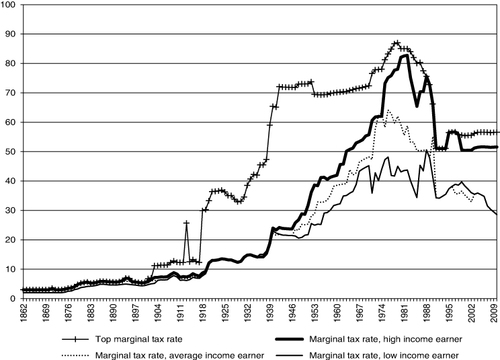
The marginal tax rate, i.e., the combined effect of the state and local income tax rates as well as the SSCs paid by employees, can be seen in . It largely follows the same evolution as the state marginal income tax rate. At the end of the 1980s, the formal top marginal tax rate and the actual marginal tax rate paid by high-income earners coincided and they continued to roughly coincide throughout the rest of the period. In 1980, a marginal tax cap was introduced to avoid excessive marginal tax rates. Initially, the tax cap restricted the total marginal tax rates to at most 80% and 85% in the two highest tax brackets. The state tax reforms of 1983–1985 and 1990–1991 decreased the top marginal tax from at most 85% to, today, about 55%. At the end of the period examined, the marginal tax rate was about 30% for the low- and average-income earners and about 50% for the high-income earner.
Note: See . The marginal tax rate is the sum of the state and local marginal income tax rates as well as SSCs paid by employees, considering that local income taxes were deductible from the state income tax base between 1920 and 1970.
Source: Own calculations based on sources in Appendix.
6. Social security contributions paid by employers
In 1955, together with the introduction of the second SSC paid by employees, the first SSC paid by employers (a health insurance fee) was introduced.Footnote42 During the 1960s, additional contributions were implemented (a national supplementary pension contribution, an industrial injury insurance contribution and an unspecified payroll tax) and, as stated above, the national basic employee pension contribution was converted to a contribution paid by employers in the 1970s. As with the SSC paid by employees, all these contributions had an income cap. The income caps were removed in two steps in 1976 and 1982. When all caps had been removed, the SSCs were the same for all workers independent of income. In the 1990s, the SSCs paid by employers started to decrease slowly.
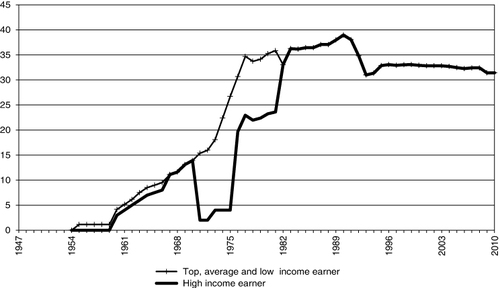
The top marginal SSCs paid by employers as well as the marginal SSCs paid by employers for the three income groups can be seen in . The top marginal SSCs and the SSC for the low- and average-income earners coincide. The SSCs started to increase sharply during 1960s and 1970s and then decreased slightly during the crisis at the beginning of the 1990s. During the 1970s, the marginal SSCs were much lower for the high-income earner due to income caps and the high-income earner only paid a few of the SSCs on marginal income increases. However, the marginal SSCs increased sharply in 1976 and 1982 due to the removal of the income caps.
Note: See .
Source: Own calculations based on sources in Appendix.
7. The marginal tax wedges on labour
The evolution of the marginal tax wedges resembles the evolution of the marginal tax rates but at a higher level (see ). The top marginal tax wedge increased sharply during the World Wars and during the depression in the 1930s. The top marginal tax wedge peaked at almost 90% around 1980. After the tax reforms in 1983–1985 and 1990–1991, the top marginal tax wedge decreased and at the end of the examined period it was about 67%.
Note: See . The tax wedge on the average-income earner is higher than that for the high-income earner at the beginning of the 1970s due to a much lower marginal SSCs paid by the high-income earner. The tax wedge on the low-income earner is higher than the average-income earner's wedge at the end of the 1990s due to a decreasing basic allowance, which affects the tax rate for the low-income earner.
Source: Own calculations based on sources in Appendix.
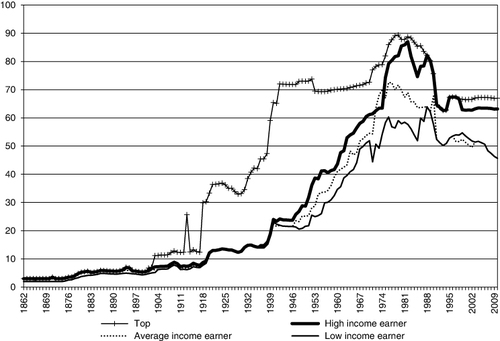
The marginal tax wedges for the examined income groups increased to a lesser extent due to the First World War and the depression during the 1930s. It increased sharply, and started to differ between the income groups, first due to the tax reform in 1939 and due to the temporary defence taxes during the Second World War. After the Second World War, the marginal tax wedges continued to increase sharply due to bracket creep until the tax reform in 1971 for the three examined income categories. The marginal tax wedges had now tripled in 40 years. Additional reasons for the rise are increasing local income tax rates, which doubled from about 10% to 20% after the war until the tax reform in 1971 and, especially during the 1960s, increasing social security contributions paid by employers. This development was largely driven by the expansion of the welfare state, which required higher tax revenues.Footnote43 During the 1970s, the marginal tax wedge continued to increase for the high-income earner whereas it fluctuated up and down for the low- and average-income earners. As with the top marginal tax wedge, the marginal tax wedges for the three income groups decreased after the tax reform in 1983–1985 and 1990–1991. At the end of the period examined, the marginal tax wedge was about 46% for the low- and average-income earners and about 63% for the high-income earner.
The evolution also shows how temporary tax increases, from the World Wars and depressions, were made permanent after the crises. This development gives support to an idea that the acceptable burden of taxation increases in crises and the acceptance of the higher tax level remains after the crises, giving rise to a stepwise increasing function of tax rates and public expenditures.Footnote44 The sharply decreased marginal tax rates after the tax reform at the beginning of the 1990s represents a break from this pattern.Footnote45
The analysis can be further extended by considering the income at which the top marginal tax wedge starts to apply. To make this income comparable over time, some form of relative income level should be calculated. Here, we will compute the relative top tax income, defined as the wage where the top marginal tax wedge starts to apply divided by the wage of an average-income earner. The results can be seen in .
Note: Right scale refers to the marginal tax wedge (%) and left scale to the relative top tax income level expressed as the number of average-income earner wages at which the top marginal tax wedge starts to apply.
Source: Own calculations based on sources in Appendix.
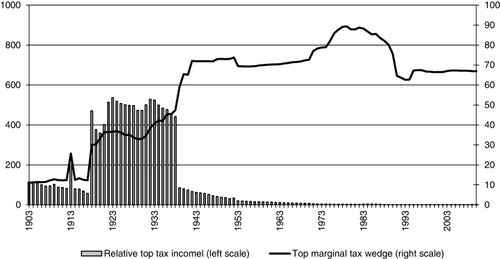
Before 1903, the tax system was proportional and we do not report any numbers before this year. Initially the relative top tax income was rather high, corresponding to about 100 times the wage of an average-income earner. It increased further at the end of the the First World War and with the new tax reform in 1920 to about 400 times the wage of an average-income earner. The relative top tax income decreased sharply with the new tax reform in 1939 and it was further almost halved during the Second World War due to increasing nominal wages. The 1948 tax reform did not significantly change the relative top tax income.
Although the top marginal tax wedges did not change much after the Second World War and until 1971, the relative top tax income decreased profoundly due, mainly, to nominal wage increases. The decrease continued during the 1970s, at the same time as the top marginal tax wedges started to increase again. From the 1980s and onwards, the relative top tax income has fluctuated somewhat. At the end of the period, the relative top tax income was below 2, i.e., the top marginal tax wedge starts to apply at earnings less than twice the wage of an average-income earner.
The analysis shows that there are distinct periods with certain features, which are distinguishable from other periods, and separated by turning points caused by major tax reforms representing a break with previous periods. The evolution could be divided into four distinct periods.
The first period stretches from the start of our examined time period in 1862 until the Second World War. The marginal tax wedges were low and slowly increasing. The income tax system was proportional until the tax reform in 1903 but can be considered proportional up until the Second World War, as the tax brackets were wide and almost all tax payers paid the lowest income tax rate during this period.
The second period, after the Second World War until the tax reform in 1971, is characterised by a high top marginal tax wedge along with increasing tax wedges, which became substantial, for ‘ordinary’ taxpayers. The tax system had a distinct progressive feature and had an explicit redistributional purpose starting with the tax reform implemented in 1948. Although no more substantial increases of the top marginal tax wedge were realised until the tax reform implemented in 1971, the income where the top marginal tax wedge started to apply decreased sharply. It exceeded 400 times the wage of an average-income earner just before the Second World War and dropped to seven by 1970.
The third period begins with the 1971 tax reform, in which efforts to redistribute income culminated,Footnote46 and lasts until the major tax reform in 1990–1991. It is distinguished by the highest tax wedges during the examined period. They peaked around 1980 when the top marginal tax wedge and the marginal tax wedge for the high-income earner could be close to 90%. SSCs paid by employers were sharply increased. More and more taxpayers paid the top marginal tax wedge as the relative top tax continued to drop and it became sufficient to earn less than twice the wage of an average-income earner to pay the top marginal tax wedge.
The major tax reform in 1990–1991 decreased the marginal tax wedges to levels prevailing before the third period. It represents the beginning of a new and still continuing period with decreasing tax wedges.
8. Conclusions
The effect of marginal taxes on economic behaviour and economic development has attracted great interest from researchers and policy makers as marginal taxes influence, for instance, supply of hours, occupational choice, and educational effort. A wider measure, such as the marginal tax wedge, often better captures the combined effect from different taxes on individual choices than a measure studying the effect from one narrow form of taxation, such as the marginal tax rate, and is therefore often preferable. The analysis may also benefit from a longer time perspective as tax systems may change slowly and it may take long time – sometimes generations – before all effects are conceivable.
The purpose of our study is to derive homogenous series of marginal tax wedges on labour income in Sweden. We have compiled information on the tax system and computed tax wedges for close to 150 years of tax history, from 1862 to 2010. We are interested in whether the evolution of tax wedges discerns periods with different characteristics and whether turning points in Swedish tax history are detectable.
We follow the OECD and calculate marginal tax wedges for a low-, average- and high-income earner. We also have computed the top marginal tax wedge on labour as well as the income at which the top marginal tax wedge starts to apply. These data are unique as no one has calculated this for Sweden before. We are unaware of such long time series for any other country.
The analysis shows that marginal tax wedges were low and about the same for a low-, average- and high-income earner until the 1939 tax reform, although progressivity was already introduced in the 1903 tax reform. The top marginal tax wedge increased considerably during the First World War and increased further during the depression in the 1930s. The wedges were raised profoundly by temporary defence taxes during the Second World War, which were made permanent by the 1948 tax reform. The marginal tax wedges for the three income groups continued to increase thereafter, mainly due to increased local taxes, the introduction and increase of SSC paid by employers and due to bracket creep, i.e., as a result of inflation which in combination with a progressive tax schedule pushed taxpayers into tax brackets with higher marginal tax rates. The income level where the top marginal tax wedge started to apply decreased sharply during this time. It required close to 400 times the wage of an average-income earner to pay the top marginal tax in 1938, about 7 in 1970 and 1.6 by the end of the 1980s. The wedges peaked around 1980. At this time, the high-income earner started to pay the top marginal tax wedge, which could be almost as high as 90%. The major tax reform in 1990–1991 lowered the tax wedges to levels prevailing before the 1971 tax reform.
The evolution can be divided into four distinct periods. During the first period, from 1862 until the Second World War, the tax system can be seen as proportional with low and slowly increasing tax wedges. The second period, stretching from the tax reform in 1948 until the tax reform in 1971, is characterised by steadily increasing tax wedges and a more progressive tax system. The tax reform in 1971 constitutes the start of the third period during which the efforts to redistribute income culminated and the tax wedges were peaking. The 1990–1991 tax reform represents the beginning of the final and still continuing period with decreasing marginal tax wedges.
Sweden has in general good tax records. It is therefore possible to complement our analysis and examine the entire Swedish tax system for the investigated period by applying a similar historical approach as we have used for labour taxes in this article. The data that we have produced could be useful for researchers and policy makers to evaluate economic policy in a long run perspective. Our use of the method applied by the OECD will also make international comparisons easier. It is our hope that our study will inspire researchers in other countries to carry out corresponding research. In that case, the analysis can be extended to cross-country comparisons.
Interestingly, the periods we identify largely coincide with the categorisation of the Swedish economic system into four ‘models’ made by the Swedish economist Assar Lindbeck: the market-oriented period (den marknadsdominerade perioden) 1870–1939, the period of welfare capitalism (välfärdskapitalismen) 1945–1970, the interventionist period (den interventionistiska perioden) 1970–1990 and the period of partial liberalisation (den partiella liberaliseringsperioden).Footnote47 It is conceivable that the same ideologies, economic theories, changes in the surrounding world et cetera underlying tax reforms and tax policy affect other policy areas as well. Our time series can be used in future research to study the conjecture that tax policy coincides with the evolution of other policies, such as labour market policy and monetary policy, and whether these policy areas together make up the features of the ‘Swedish model’ under different time periods. A further step is then to relate taxation and other economic policy areas to economic outcome, such as employment and economic growth.
Acknowledgements
Stenkula gratefully acknowledges financial support from Finanspolitiska Forskningsinstitutet and Jan Wallander and Tom Hedelius Research Foundation. Johansson gratefully acknowledges financial support from Ragnar Söderberg's Foundation. Du Rietz acknowledges financial support from the Jan Wallander and Tom Hedelius Research Foundation. We are grateful for comments on an earlier version from Krister Andersson, Niclas Berggren, Sven-Olof Lodin, Enrique Rodriguez, Hans Sjögren, Anders Gustafsson and Hans Westerberg (the last two also collected data for several of the tables in the appendices) and seminar participants at the Institute for Economic and Business History Research (EHFF), Stockholm School of Economics, at the 12th Annual SNEE European Integration Conference in Mölle and at the 77th Annual meeting of the Southern Economic Association.
Additional information
Notes on contributors
Mikael Stenkula
Mikael Stenkula is a research fellow at IFN, the Research Institute of Industrial Economics, Stockholm, Sweden, and his research concerns entrepreneurship, business structures and taxation.
Dan Johansson
Dan Johansson is professor of Economics at Örebro University School of Business, Örebro, Sweden, and a research fellow at HUI Research, Stockholm, Sweden, and his research concerns entrepreneurship, institutions and firm growth.
Gunnar Du Rietz
Gunnar Du Rietz is a research fellow at IFN, the Research Institute of Industrial Economics, Stockholm, Sweden, and his research concerns taxation, employment and business activity.
Notes
1 This is part of a project that includes a comprehensive effort to characterize the Swedish tax system from 1862 to 2010.
2 A distinction is often made between intensive and extensive marginal decisions. The intensive marginal decision, which affects the number of work hours and effort put in by those already employed, is mainly influenced by the marginal tax rates. The extensive marginal decision, which affects the incentive to participate in the labour market, is mainly influenced by the average tax rates.
3 This is because individual choices are affected by several forms of taxations. The marginal income tax rate captures the effect from one, the income tax on labour, while the marginal tax wedge incorporates the effect from other taxes as well. The incentive effect from these taxes, for instance, the social security contributions paid by employers can be large and it has, therefore been argued that a tax measure taking account of the combined effect from different taxes better seizes the effect on individual decision-making from taxation. See, for instance, Agell et al., Incentives (Citation1998) or Sørensen, Measuring (Citation2004), for a thorough discussion.
4 The excess burden is, furthermore, not a linear function of the marginal tax wedge but an increasing convex function, i.e., the burden increases disproportionately faster than the marginal tax wedge, which implies large distortion costs at high tax levels, see Hansson/Norrman, Skatter (Citation1996), Hansson, ‘Limits’ (Citation2000) or Jaimovich/Rebelo, ‘Non-linear Effects’ (Citation2012).
5 Rodriguez, Den Svenska Skattehistorien (Citation1981).
6 See, for instance, http://stats.oecd.org/Index.aspx?DataSetCode=REV.
7 Esping-Andersen, Three Worlds (Citation1990), Okun, Equality (Citation1975), Lindbeck,Swedish Experiment (Citation1997), Madrick, Case (Citation2009).
8 The tax system is, however, less well documented during the nineteenth century. Tax tables reporting tax brackets and tax rates have, for example, not been compiled and are not easily available. Part of our study has been devoted to going through all the issues of Svensk författningssamling (Swedish Code of Statutes, SFS for short) in Riksdagsbiblioteket to include all tax tables for the earlier period of our examination.
9 See, for instance, Roine et al., ‘Long-run Determinants’ (Citation2009), and Rydqvist et al., ‘Evolution’ (Citation2009). Historical studies on the Swedish tax system include Eberstein, Om Skatt (Citation1929, Citation1937), Genberg, Skatteutvecklingen (Citation1942), Elvander, Svensk Skattepolitik (Citation1972), Hedlund-Nyström, ‘Finance Act’ (Citation1972), Jakobsson/Normann, ‘Inkomstbeskattningen’ (Citation1972), Rodriguez, ‘Offentlig Inkomstexpansion’ (Citation1980), Rodriguez, Den Svenska Skattehistorien (Citation1981), Gårestad, ‘Industrialisering’ (Citation1987), Dahlgren/Stadin, ‘Från Feodalism’ (Citation1990), Du Rietz, Välfärdsstatens (Citation1994), Söderberg, Inkomstskattens (Citation1996), and Löwnertz, De Svenska Skatternas (Citation2003). These studies incorporate extensive information about the Swedish tax system and part of the results in our paper are derived from these sources. Longer time series about the marginal tax wedge have previously only been compiled by Du Rietz. The most recent update, covering the period 1952–2003, is published in Johansson, ‘Skatternas’ (Citation2004), Table A1, 93–94.
10 Barro/Sahasakul, ‘Average’ (Citation1986), Poterba, ‘Taxation’ (Citation2004), Saez, ‘Reported Incomes’ (Citation2004).
11 Orhnial/Foldes, ‘Estimates’ (Citation1975).
12 Corneo, ‘Rise’ (Citation2005).
13 Extensive data material, reporting all tax tables for the examined period, making it possible to calculate the marginal tax wedges for any income for the whole period, can be seen in Du Rietz et al., ‘Marginal Taxation’ (Citation2013).
14 For instance, in year 1971 the state income tax was 22.0%, the local income tax 22.54%, the SSCs paid by employees 5.0% and the SSCs paid by employers 15.37% for an average production worker. Hence, the tax wedge was 1−((1− (0.22+0.2254))*(1−0.05))/(1+0.1537) = 0.543 = 54.3% in 1971.
15 See OECD, ‘Special Feature’ (Citation2009) for a further discussion about consumption taxes.
16 Disney et al., ‘Contributions’ (Citation2004) and Disney, ‘Household’ (Citation2006).
17 See, for instance, Heady, ‘Taxing Wages’ (Citation2004).
18 McKee et al., ‘Marginal tax rates’ (Citation1986).
19 See Du Rietz et al., ‘Marginal Taxation’ (Citation2013).
20 See, for example, OECD, Taxing Wages (Citation2011) for an extensive discussion about OECD's Taxing Wages approach.
21 Industry sectors C–K include: Mining and quarrying (C), Manufacturing (D), Electricity, gas and water supply (E), Construction (F), Wholesale and retail trade; repair of motor vehicles, motorcycles, and personal and household goods (G), Hotels and restaurants (H), Transport, storage and communications (I), Financial intermediation (J) and real estate, renting and business activities (K). According to the OECD, ‘Special Feature’ (Citation2005), this change only produced minor effects on the tax measures.
22 See Confederation of Swedish Enterprise, Fakta (Citation2012).
23 See Edvinsson, ‘Growth’ (Citation2005). Edvinsson has compiled long time homogenous wage data series based on previous sources covering shorter and different time periods, for instance, Jungenfelt, Löneandelen (Citation1966). Edvinsson's data-set includes SSCs and we have adjusted for this to obtain the wage level. The data-set from OECD does not include SSCs. Prado, ‘Nominal Wages’ (Citation2010) calculates hourly earnings for manufacturing workers 1860–2007.
24 Bentzel, Inkomstfördelningen (Citation1952), Prado, ‘Nominal Wages’ (Citation2010), Bergh, ‘What’ (Citation2013).
25 For instance, it has been argued that high taxes on highly specialised individuals affect the growth of high-tech firms, the commercialisation of research and the localisation of knowledge intensive production and headquarters, see Henrekson/Rosenberg, Akademiskt Entreprenörskap (Citation2000), Braunerhjelm, ‘Headquarters’ (Citation2004), Birkinshaw et al., ‘Corporations’ (Citation2006).
26 If both spouses were working, there were also an additional small extra allowance between 1921 and 1984. See, for instance, Svensson, ‘Politics’ (Citation1996) for a discussion on female labour participation and wages.
27 In Du Rietz et al., ‘Marginal Taxation’ (Citation2013), we show the evolution for a married one- or two-earner household.
28 Roine/Waldenström, ‘Evolution’ (Citation2008).
29 Du Rietz, Välfärdsstatens (Citation1994). Updated figures spanning through 2003 can be seen in Johansson, ‘Skatternas’ (Citation2004), Table A1, 93–94.
30 The OECD has made robustness tests on average tax rates including non-standard tax reliefs. For Sweden, the estimated difference is about 5 percentage points at most, see for instance OECD, Taxing Wages (Citation2010), 490–494.
31 Normally, new tax rules have been implemented the year after approval, for instance, the tax system that was implemented in 1862 was approved in 1861. In the literature the year associated with the introduction of a tax reform can either refer to the year the tax rules were approved or implemented. We will, in this paper, use the year when the tax system was implemented.
32 The political voting system was differentiated and based on the appropriation paid. Abolishing the appropriation system would force a change in the voting law; many politicians feared this could provide an opening for changes in the voting system, which was highly debated at the turn of the century. Equal voting rights for all men was introduced in 1909. The voting system for local government was also based on taxes paid, but to a lesser degree, until 1919. Despite the reformed voting rules, it was difficult to abolish the appropriation system as the local tax system was also based on it. The appropriation system therefore had to be in place until the major reform of the local tax system in 1928. It was transformed to a local tax in the 1911 tax reform and the appropriation system worked as a parallel local tax system between 1911 and 1928 (but at a symbolic tax level of 0.1%). For a thorough discussion about how the voting system affected the tax system in Western Europe, see Aidt/Jensen, ‘Tax Structure’ (Citation2009). Ignoring the appropriation system, the differences between the 1903 and 1911 state tax systems were minor.
33 In 1920, about 98% of all persons with a taxable income had a taxable income implying that they paid the lowest marginal state tax rate or no state tax at all, see Statistical Yearbook of Sweden (Citation1923), Table 210, 234–235.
34 Elvander, Svensk Skattepolitik (Citation1972). Lodin, Tax Law (Citation2011). Rodriguez, Den Svenska Skattepolitiken (Citation1981).
35 The income tax schedule was slightly adjusted several times during the 1950s and 1960s. In nominal terms, these adjustments can be seen as minor tax reductions. However, these adjustments were all insufficient to prevent tax increases in real terms when price and wage inflation shifted taxpayers up into tax brackets with higher marginal tax rates.
36 Lindbeck, ‘Swedish Experiment’ (Citation1997), 1275, concludes: ‘The efforts to redistribute income via very high marginal tax rates increased gradually culminating in the 1971 tax reform.’
37 Real net wage increases, demanded by workers and trade unions, required high nominal wage increases due to the high marginal tax rates. However, high nominal wage increases could push up wages into higher tax brackets with even higher marginal tax rates for many taxpayers. This increased the nominal wage demand even further. Inflation increased from 4.1% on average during the 1960s to 9.2% on average during the 1970s. Lodin, Tax Law (Citation2011), 43–44, claims that the income taxation was trapped in a “vicious cycle of self-generating reforms” with constant need for tax reforms increasing the progressivity of the system, and that an industrial worker would need a yearly wage increase of about 20% to avoid a real wage decrease during this period.
38 Jakobsson/Normann, ‘Inkomstbeskattningen’ (Citation1972), Lodin, Tax Law (Citation2011), Söderberg, Inkomstskattens (Citation1996).
39 Tax Statistical Yearbook (Citation2009).
40 Including the temporary local progressive tax, the top tax rate increased profoundly between the World Wars. As can be seen from the figure, the examined income groups were not affected by this tax.
41 As the marginal SSCs paid by employees were mostly negligible, they are not shown in any figure. They are, however, included in our calculations of the tax wedges. For more details about these contributions, see Du Rietz et al., ‘Marginal Taxation’ (Citation2013).
42 Hence, in 1955 a health insurance fee paid by both the employers and the employees was introduced.
43 Becker/Mulligan, ‘Deadweight’ (Citation2003) argue that tax innovations, which increase the ability to tax more, largely drive the size of the public sector. In the case of Sweden, a number of analysts, including several ministers of finance, are of the opinion that the two explanations are complementary rather than mutually exclusive. For instance, taxation at source introduced in 1947 and the use of new indirect, so called “invisible”, taxes, like the social security contributions paid by employers, are considered essential for politicians to realize ambitious welfare plans, see Elvander, Svensk Skattepoltik (Citation1972), Lodin, Tax Law (Citation2011), Rodriguez, Den Svenska Skattehistorien (Citation1981).
44 The idea was originally put forward by Peacock/Wiseman, Growth (Citation1961). Higgs, Crises (Citation1987), shows that economic crises and wars may explain (part of) the increase of federal expenditures in the USA during the twentieth century. Rodriguez, ‘Offentlig Inkomstexpansion’ (Citation1980) also argues that the Swedish evolution supports this idea. The hypothesis is, however, difficult to formally test and empirical support analysing the evolution of public spending during, for instance, Second World War is inconclusive, see Henrekson, ‘Peacock-Wiseman Hypothesis’ (Citation1993).
45 The evolution of the average tax wedge mimics the marginal tax wedge but at a lower level. It was below 20% before the Second World War for the three income groups. It increased sharply after the War and peaked during the 1980s when it was about 62.5% for the high-income earner, 55% for the average-income earner and 50% for the low-income earner. At the end of the examined period the average tax wedge had decreased about 10 percentage points for each group.
46 Lindbeck, ‘Swedish Experiment’ (Citation1997), Lodin, Tax Law (Citation2011).
47 Lindbeck, Ekonomi (Citation2012), 342–359.
48 See http://stats.oecd.org/Index.aspx?DataSetCode=AWCOMP http://stats.oecd.org/Index.aspx?DataSetCode=AWCOMP_OLD http://stats.oecd.org/Index.aspx?DataSetCode=AWHIST_OLD
49 Gårestad, ‘Industrialisering’ (Citation1987), 197, 213–215.
50 Tithe had to be paid to the church earlier in history. In reforms carried out in 1527 by the king, Gustav Wasa, part of the tithe was abolished, part was converted to a central state tax and the remaining part was, later on, transformed to a local tax, see Eberstein, Om Skatt (Citation1937), 822–832.
51 Tax Statistical Yearbook of Sweden (2000), 56.
52 In 1953, the national church tax was about 0.80% on average. In 2010, there is a compulsory fee for funeral service of, on average, 0.22%. The voluntary fee to the church is 0.99% on average, see Tax Statistical Yearbook of Sweden (Citation2009), 78 and 189.
53 Söderberg, Inkomstskattens (Citation1996), 2.
Related Research Data
References
- Agell, Jonas/Englund, Peter/Södersten, Jan (1998), Incentives and Redistribution in the Welfare State. The Swedish Tax Reform, London: Macmillan.
- Aidt, Toke S./Jensen, Peter S. (2009), ‘Tax structure, Size of Government, and the Extension of the Voting Franchise in Western Europe, 1860–1938’ in: International Tax and Public Finance 16, no. 3, 362–394. 10.1007/s10797-008-9069-9
- Barro, Robert J./Sahasakul, Chaipat (1986), ‘Average Marginal Tax Rates from Social Security and the Individual Income Tax’ in: Journal of Business 59, no. 4, 555–566. 10.1086/296354
- Becker, Gary S./Mulligan, Casey B. (2003), ‘Deadweight Costs and the Size of Government’ in: Journal of Law and Economics 46, no. 2, 293–340. 10.1086/377114
- Bentzel, Ragnar (1952), Inkomstfördelningen i Sverige, Stockholm: IUI.
- Bergh, Andreas (2013), ‘What Are the Policy Lessons from Sweden? On the Rise, Fall and Revival of a Capitalist Welfare State’ in: New Political Economy, forthcoming.
- Birkinshaw, Julian/Braunerhjelm, Pontus, Holm, Ulv/Terjesen, Siri A. (2006), ‘Why Do Some Corporations Relocate Their Headquarters Overseas?’ in: Strategic Management Journal 27, no. 7, 681–700. 10.1002/smj.541
- Braunerhjelm, Pontus (2004), ‘Heading for Headquarters? Why and How the Location of Headquarters Matter among the EU-Countries’, in: European Union and The Race for Foreign Direct Investment in Europe, ed. by P. Ghauri/L. Oxelheim, Amsterdam/Boston: Elsevier, 123–148.
- Confederation of Swedish Enterprise (2012), Fakta om Löner och Arbetstider 2012, Stockholm: Svenskt Näringsliv.
- Corneo, Giacomo (2005), ‘The Rise and Likely Fall of the German Income Tax, 1958–2005’ in: CESifo Economic Studies 51, no. 1, 159–186. 10.1093/cesifo/51.1.159
- Dahlgren, Stellan/Stadin, Kekke (1990), ‘Från feodalism till kapitalism: skatternas roll i det svenska samhällets omvandling 1720–1910’ ( phil. diss., Uppsala University).
- Disney, Richard/Boeri, Tito/Jappelli, Tullio (2004), ‘Are Contributions to Public Pension Programmes a Tax on Employment?’ in: Economic Policy 19, no. 39, 267–311. 10.1111/j.1468-0327.2004.00124.x
- Disney, Richard (2006), ‘Household Saving Rates and the Design of Public Pension Programmes: Cross–country Evidence’ in: National Institute Economic Review 198, no.1, 61–74. 10.1177/0027950106074040
- Du Rietz, Gunnar (1994), Välfärdsstatens Finansiering, Stockholm: City University Press.
- Du Rietz, Gunnar/Johansson, Dan/Stenkula, Mikael (2013), ‘Marginal Taxation on Labor Income in Sweden from 1862 to 2010’, IFN Working Paper and HUI Research Working Paper, forthcoming.
- Eberstein, Gösta (1929), Om Skatt till Stat och Kommun enligt Svensk Rätt: Förra Delen, Stockholm: P.A. Norstedt & Söner.
- Eberstein, Gösta (1937), Om Skatt till Stat och Kommun enligt Svensk Rätt: Senare Delen, Stockholm: P.A. Norstedt & Söner.
- Edvinsson, Rodney (2005), ‘Growth, Accumulation, Crises. With New Macroeconomic Data for Sweden’ ( phil. diss., Stockholm University).
- Elmér, Åke (1960), ‘Folkpensioneringen i Sverige med särskild hänsyn till ålderspensioneringen’ ( phil. diss., Lund University).
- Elvander, Nils (1972), Svensk Skattepolitik 1945–1970: En Studie i Partiers och Organisationers Funktioner, Stockholm: Rabén and Sjögren.
- Esping-Andersen, Gösta (1990), The Three Worlds of Welfare Capitalism, Princeton, NJ: Princeton University Press.
- Genberg, Torsten (1942), Skatteutvecklingen sedan Sekelskiftet, Stockholm: Skattebetalarnas Förening.
- Gårestad, Peter (1987), ‘Industrialisering och beskattning i Sverige 1861–1914’ ( phil. diss., Uppsala University).
- Hansson, Ingemar/Norrman, Erik (1996), Skatter – Teori och Praktik, Stockholm: SNS Förlag.
- Hansson, Åsa (2000), ‘Limits of Tax Policy’ ( phil. diss., Lund University).
- Heady, Christopher (2004), ‘The “Taxing Wages” Approach to Measuring the Tax Burden on Labour’ in: Measuring the Tax Burden on Capital and Labour, ed. by P. Sørensen Birch, Cambridge: MIT Press, 263–287.
- Hedlund-Nyström, Torun (1972), ‘The Finance Act of 1862 and its Effect on the Economy’ in: Economy and History 15, no. 1, 58–82. 10.1080/00708852.1972.10418896
- Henrekson, Magnus (1993), ‘The Peacock-Wiseman Hypothesis’ in: The Growth of the Public Sector, Theories and International Evidence, ed. by N. Gemmel, Cheltenham: Edward Elgar Publishing, 53–71.
- Henrekson, Magnus/Rosenberg, Nathan (2000), Akademiskt Entreprenörskap. Universitet och Näringsliv i Samverkan, Stockholm: SNS Förlag.
- Higgs, Robert (1987), Crisis and Leviathan: Critical Episodes in the Growth of American Government, New York: Oxford University Press.
- Jaimovich, Nir/Rebelo, Sergio (2012), ‘Non-linear Effects of Taxation of Growth’, NBER Working paper no. 18473, Cambridge, MA.
- Jakobsson, Ulf/Normann, Göran (1972), ‘Inkomstbeskattningen i den ekonomiska politiken’ ( phil. diss., Lund University).
- Johansson, Dan (2004), ‘Skatternas utveckling, omfattning och fördelning’ in: Skatter och Värdighet, ed. by N. Karlson/D. Johansson/R. Johnsson, Stockholm: Ratio, 66–94.
- Jungenfelt, Karl G. (1966), Löneandelen och den Ekonomiska Utvecklingen, Stockholm: IUI and Almqvist & Wicksell.
- Lindbeck, Assar (1997), ‘The Swedish Experiment’ in: Journal of Economic Literature 35, no. 3, 1273–1319.
- Lindbeck, Assar (2012), Ekonomi är att Välja, Stockholm: Albert Bonniers Förlag.
- Lodin, Sven-Olof (2011), The Making of Tax Law, Uppsala: Iustus förlag.
- Löwnertz, Susanne (2003), De Svenska Skatternas Historia, Stockholm: Riksskatteverket.
- Madrick, Jeff (2009), The Case for Big Government, Princeton, NJ: Princeton University Press.
- McKee, Michael/Visser, Jacob/Saunders, Peter (1986), ‘Marginal Tax Rates on the Use of Labor and Capital in OECD Countries’ in: OECD Economic Studies, no. 7, 45–101.
- OECD (2005), ‘Special feature: Broadening the Definition of the Average Worker’ in: Taxing Wages 2004, Paris: OECD Publishing, 33–42. http://dx.doi.org/10.1787/tax_wages-2004-3-en
- OECD (2009), ‘Special feature: Consumption Taxation as an Additional Burden on Labour Income’, in: Taxing Wages 2008, Paris: OECD Publishing, 23–39. http://dx.doi.org/10.1787/tax_wages-2008-3-en
- OECD (2010), Taxing Wages 2008–2009, Paris: OECD.
- OECD (2011), Taxing Wages 2010, Paris: OECD.
- Okun, Arthur M. (1975), Equality and Efficiency: The Big Tradeoff, Washington, DC: Brookings Institution.
- Orhnial, A. J. H./Foldes, Lucien (1975), ‘Estimates of Marginal Tax Rates for Dividends and Bond Interest in the United Kingdom 1919–1970’ in: Economica 42, no. 165, 79–91. 10.2307/2552987
- Peacock, Allan/Wiseman, Jack (1961), The Growth of Public Expenditure in the United Kingdom, Princeton: Princeton University Press.
- Poterba, James (2004), ‘Taxation and Corporate Payout Policy’ in: American Economic Review 94, no. 2, 171–175. 10.1257/0002828041301416
- Prado, Svante (2010), ‘Nominal and Real Wages for Manufacturing Workers, 1860–2007’ in: Historical Monetary and Financial Statistics for Sweden, vol. 1, Exchange rates, prices and wages, 1277–2008, ed. by R. Edvinsson/T. Jacobson/D. Waldenström, Stockholm: Ekerlids Förlag, 479–527.
- Rodriguez, Enrique (1980), ‘Offentlig inkomstexpansion: En analys bakom de offentliga inkomsternas utveckling i Sverige under 1900-talet’ (phil. diss., Uppsala University).
- Rodriguez, Enrique (1981), Den Svenska Skattehistorien, Lund: Liber Läromedel.
- Roine, Jesper/Vlachos, Jonas/Waldenström, Daniel (2009), ‘The Long-run Determinants of Inequality: What Can we Learn From Top Income Data?’ in: Journal of Public Economics 93, no. 7–8, 974–988. 10.1016/j.jpubeco.2009.04.003
- Roine, Jesper/Waldenström, Daniel (2008), ‘The Evolution of Top Incomes in an Egalitarian Society: Sweden, 1903–2004’ in: Journal of Public Economics 92, no. 1–2, 366–387.
- Rydqvist, Kristian/Spizman, Joshua D./Strebulaev, Ilya A. (2009), ‘The Evolution of Aggregate Stock Ownership – A Unified Explanation’, CEPR Discussion Paper No. DP7356.
- Saez, Emmanuel (2004), ‘Reported Incomes and Marginal Tax Rates, 1960–2000: Evidence and Policy Implications’ in: Tax Policy and the Economy, ed. by J. Poterba, Cambridge, MA: MIT Press, 117–173.
- SFS 1861: 34 Bewillningsförordning 1862.
- SFS 1871: 30 Kongl. Maj:ts nådiga förordning, angående utgörande af en särskild tilläggsbewillning för år 1893.
- SFS 1879: 25 Kongl. Maj:ts nådiga kungörelse, angående särskild tilläggsbevillning för år 1879 och 1880.
- SFS 1880: 46 Kongl. Maj:ts nådiga kungörelse, angående särskild tilläggsbevillning för år 1881.
- SFS 1881: 29 Kongl. Maj:ts nådiga kungörelse, angående särskild tilläggsbevillning för år 1882.
- SFS 1883: 51 Kongl. Maj:ts nådiga förordning angående bevillning af fast egendom samt af inkomst.
- SFS 1892: 44 Kongl. Maj:ts nådiga förordning angående bevillning af fast egendom samt af inkomst.
- SFS 1892: 111 Kongl. Maj:ts nådiga förordning, angående särskild tilläggsbevillning för år 1893.
- SFS 1893: 34 Kongl Maj:ts nådiga förordning, angående särskild tilläggsbevillning för år 1894.
- SFS 1894: 76 Kongl. Maj:ts nådiga kungörelse angående den vid 1894 års riksdag åtagna bevillning af fast egendom samt af inkomst.
- SFS 1895: 62 Kongl. Maj:ts nådiga kungörelse angående den vid 1895 års riksdag åtagna bevillning af fast egendom samt af inkomst och angående särskild tilläggsbevillning för år 1896.
- SFS 1897: 111 Kongl. Maj:ts nådiga förordning angående bevillning af fast egendom samt af inkomst.
- SFS 1901: 31 Kongl. Maj:ts nådiga kungörelse angående den vid 1901 års riksdag åtagna bevillning af fast egendom samt af inkomst.
- SFS 1901: 34 Kongl. Maj:ts nådiga förordning angående särskild tilläggsbevillning för år 1901.
- SFS 1902: 50 Kongl. Maj:ts nådiga kungörelse angående den vid 1902 års riksdag åtagna bevillning af fast egendom samt af inkomst.
- SFS 1902: 84 Kongl. Maj:ts nådiga förordning om inkomstsskatt.
- SFS 1910: 115 Kongl. Maj:ts nådiga förordning om inkomst- och förmögenhetsskatt.
- SFS 1910: 116 Kongl. Maj:ts nådiga förordning angående bevillning af fast egendom samt af inkomst.
- SFS 1917: 513 Fastställelse av vissa till ledning vid uträknandet av extra inkomst- och förmögenhetsskatt för år 1918 erforderliga tabeller.
- SFS 1918: 512 Tilläggsskatt för år 1918 års inkomst och förmögenhet.
- SFS 1918: 513 Extra inkomst- och förmögenhetsskatt för år 1919.
- SFS 1920: 759 Kungl. Maj:ts förordning om ändring i vissa delar av förordningen den 28 oktober 1910 (n:r 116) angående bevillning av fast egendom samt av inkomst.
- Statistical Yearbook of Sweden (1923), Stockholm: Statistiska centralbyrån.
- Statistics Sweden (2010), Årsbok för Sveriges Kommuner 2010, Örebro: Statistiska centralbyrån.
- Svensson, Lars (1996), ‘Politics or Market Forces? The Determinants of the Relative Wage Movements of Female Industrial Workers in Sweden, 1960–1990’ in: Scandinavian Economic History Review 44, no. 2, 161–182.
- Söderberg, Hans (1996), Inkomstskattens Utveckling under 1900-talet. En vägvisare för skatteberäkningar 1921–1996, Stockholm: Skattebetalarnas Förening.
- Sørensen, Peter B., ed., (2004), Measuring the Tax Burden on Capital and Labour, Cambridge: MIT Press.
- Tax Statistical Yearbook of Sweden (1998–2009), Stockholm: Skatteverket.
Appendix 1. Sources
Information about the marginal tax rates during the appropriation system are collected from SFS Citation1861: 34, SFS Citation1871: 30, SFS Citation1879: 25, SFS Citation1880: 46, SFS Citation1881: 29, SFS Citation1883: 51, SFS Citation1892: 44, SFS Citation1892: 111, SFS Citation1893: 34, SFS Citation1894: 76, SFS Citation1895: 62, SFS Citation1897: 111, SFS Citation1901: 31, SFS Citation1901: 34, SFS Citation1902: 50, SFS Citation1910: 116, SFS Citation1920: 759, Eberstein (Citation1929), 119–135, Eberstein (Citation1937), 694–695, Genberg (Citation1942), 4–5, 18, Gårestad (Citation1987), 38–40.
Data on the marginal tax rates from the 1903 tax reform and onwards is collected from SFS Citation1902: 84, SFS Citation1910: 115, SFS Citation1917: 513, SFS Citation1918: 512–513, Genberg (Citation1942), Söderberg (Citation1996) and OECD stats extracts, Taxing wages.Footnote48
Statistics on local taxes is incomplete before 1875.Footnote49 We impute a tax rate of 2% between 1862 and 1874, which is slightly below the estimated tax level in 1875. For the years 1875 through 1914, Gårestad (Citation1987), 212–213 has compiled information about the total amount of various income taxes paid to the local government. For this period, we estimate the tax rate as total income taxes paid to the municipalities (excluding local lump-sum taxes), divided by total labour income earned by the taxpayers as reported by Edvinsson (Citation2005), 385–388. For the period 1915 through 1920, we base our estimate on Rodriguez (Citation1981), 107–108 and Edvinsson (Citation2005), 385–388. This approximated tax rate increases from about 2.2% to 6.5%. As from 1921, the marginal local tax rate is found using the available statutory tax rates reported by Söderberg (Citation1996), 63–64 and Statistics Sweden (Citation2010), 31–32. As the tax rates differ between cities, the average local tax rate has been used. Up until 1952, a tax earmarked for the national church was mandatory and included in the local tax.Footnote50 As from 1953, this tax is not levied on taxpayers who have left the national church. As from 2000, the national church is separated from the government and the fee to the national church is no longer regarded as a tax.Footnote51 In our time series we follow the OECD and exclude the national church tax as from year 2000.Footnote52
The income tax system also includes tax reliefs in the form of allowances and tax credits, where allowances are applied to pre-tax income to obtain taxable income. Basic local and state allowances were also introduced in 1920.Footnote53 The basic tax allowances differed somewhat between cities until 1960 depending on the price level in each city. We refer to an average city when calculating the basic tax allowance. Information is gathered from Genberg (Citation1942), Söderberg (Citation1996) and Tax Statistical Yearbook of Sweden (Citation1998–2009). The local tax was also deductible from state taxable income between 1920 and 1970. The basic state and local income tax allowances may affect the marginal income tax rate both positively or negatively, as these occasionally depend upon and change with income level.
Information about social security contributions paid by employees is collected from Elmér (Citation1960), Söderberg (Citation1996) and Tax Statistical Yearbook of Sweden (Citation1998–2009) and information about social security contributions paid by employer from Söderberg (Citation1996), 117–119 and from Tax Statistical Yearbook of Sweden (Citation2009), 84.