
ABSTRACT
We present the first comprehensive, long-run estimates of Finnish wealth and its distribution from 1750 to 1900. Using wealth data from 17,279 probate inventories, we show that Finland was very unequal between 1750 and 1850; the top decile owned about 90% of total wealth. This means that Finland was more unequal than the much wealthier economies Britain, France and the US, which goes against the common assumption of richer economies being more unequal. Moreover, when industrialisation took off in Finland, inequality started a downward trajectory. High inequality 1750–1850 was bottom-driven, by a large share of the population owning nothing or close to nothing of value, while economic development after 1850 was pro-equal since the ownership of forests, since long in the hands of the peasantry, became more valuable with the development of forest-based industries. Our findings thus contradict commonplace assumptions that economic growth and industrialisation are associated with more inequality, as well as recent arguments that very few factors beyond catastrophes can decrease inequality. We instead argue for a more inductive and open approach to the determinants of long-run inequality.
What causes variations in economic inequality? Growing inequality today has led to growing interest in historical studies; history allows us to study inequality in a variety of cases and scenarios. Thanks to studies building on probate inventories and taxation data, we now have long-run series of wealth inequality before 1900 for Britain, the United States, France and Sweden, as well as several cities and regions elsewhere (Alfani, Citation2015; Alfani & Ammanati, Citation2017; Bengtsson, Missiaia, Olsson, & Svensson, Citation2018; Hanson Jones, Citation1980; Lindert, Citation1986; Nicolini & Palencia, Citation2016; Piketty, Postel-Vinay, & Rosenthal, Citation2006; Shammas, Citation1993).
We add here another case to the literature by presenting new estimates for wealth and its distribution in Finland from 1750 to 1900 based on information from probate inventories. Finland’s peculiarities make this study a significant contribution to the historical inequality literature. While countries like Britain and France belonged to the economic core of Europe and were relatively early industrializers, Finland was a much more peripheral, poor and backward economy. In 1700, Finnish GDP per capita only corresponded to 43% of the British one and 78% of the Swedish; in 1900 its level had further declined to 37% and 76%, respectively.Footnote1 Finland only rapidly industrialised after 1870; industry contributed less than 20% of GDP until 1890 (Hjerppe, Citation1989, p. 62). The Finnish case thus offers a new perspective on the much-debated issues of the relationship between economic growth, industrialisation, structural change, and inequality.
1. Perspectives on historical inequality
Recently, a series of related ideas on the causes of variation in long-run inequality have been put forward. The common core is that economic growth and higher levels of living standards are correlated with more inequality, and that there are few if any factors that can decrease it. A strong focus on economic growth in the inequality debate goes back at least to Kuznets’ (Citation1955) argument, based on data for the US, Britain and Germany from the 1870s to the 1940s, that industrialisation increased inequality, as incomes were higher in industry than in agriculture, and so agricultural workers were left behind. This argument has been immensely influential (cf. also the ‘Super Kuznets Curve’ of Van Zanden, Citation1995).Footnote2 While Kuznets’ argument regarded income inequality, it has also been applied to wealth (e.g. Alfani, Citation2010).
Relatedly, Milanovic, Lindert, and Williamson (Citation2011) have shown that historically there is a positive relationship between GDP per capita and income inequality. In very poor societies, income inequality cannot be very high, as then the poorest groups would starve to death. Larger average incomes open up larger possibilities for inequality. However, the relationship is not deterministic: larger inequality is possible with higher average incomes, but not necessary. The degree of inequality is shaped by other factors, such as institutions, too.
Several researchers have claimed that there are, at least in pre-industrial economies, few or no other factors than catastrophes (diseases, wars) that decrease inequality. Alfani (Citation2015) in his study of Piedmont in the north-west of Italy from 1300 to 1800 finds that inequality grew at all times, regardless of the pace of economic growth. According to Alfani as well as Scheidel (Citation2017), inequality in Europe since 1300 only has had two episodes of decline: the first after the Black Death when lack of labour drove up wages and increased mortality fragmented large properties, the second during the twentieth century. Milanovic in his recent book, Global Inequality makes a similar argument for pre-industrial societies but claims that in industrialised societies, inequality can be decreased by education, social transfers, and progressive taxation (Milanovic, Citation2016, pp. 4–5, 55).
At least three historical studies contradict the commonly presumed relationship between economic growth and increases in inequality. Malinowski and van Zanden (Citation2017) show that in Poland, due to serfdom and its legacy, the rural sector was more unequal than the industrial sector, contra Kuznets, so that growth of the urban sector actually had an equalising effect. Reis (Citation2017) finds for Portugal from 1565 to 1770 falling inequality, ‘at a time of mostly positive macroeconomic performance’. Rossi, Toniolo, and Vecchi (Citation2001) in a study of Italian income inequality 1881–1961 found that other factors than the Kuznetsian were most important for the trajectory of inequality.
In a recent study of wealth inequality in Sweden in 1750, 1800, 1850 and 1900 Bengtsson et al. (Citation2018) argue against the strong focus on economic growth and industrialisation as drivers of inequality. They show that inequality grew from 1750 to 1800, from 1800 to 1850, and from 1850 to 1900, but in different ways: a bottom-driven increase (an increase in the number of very poor from 1750 to 1850 as proletarianisation reduced the farmers’ share of the population); a top-driven increase (polarisation within the elite from 1850 to 1900); and polarisation driven by rural real estate as well as claims and investments. The Swedish case shows the need to not only consider Kuznetsian/macroeconomic inter-sector effects, but also the distribution and class structure within economic sectors.
Studying inequality in pre-industrial societies, there are some reasons to focus on distribution of wealth, rather than income. In societies where subsistence was the rule, owning (some) property was the most important determinant of one’s living standards, and therefore wealth is the key variable of interest. Measurement of wealth may also be more precise than that of incomes: the individual’s annual income can require approximation, depending on the sources, and the sources on wealth are normally more abundant than the sources on income (Alfani, Citation2010, pp. 13–14). Nicolini and Palencia (Citation2016) have been able to combine wealth (from probate inventory) and income (from fiscal registers) in a pre-industrial micro level study for Spain. An expected result is that wealth inequality is higher than income inequality, but they also show that income is closely associated with wealth, and that low income households, although underrepresented, are not absent in the wealth sample. This supports the use of wealth in our inequality study; it should say something about inequality more broader conceived too.
This review of the literature motivates the interest in studying wealth inequality dynamics in Finland, a poor and backward European economy before 1900. Because of its special features – poor, late industrialisation – it offers a new perspective on inequality compared to those from previous studies of wealthier core economies. The next section provides an historical overview on Finland.
2. The Finnish case
Finland was only created as an independent state in 1917, in response to the collapse of the Russian empire. Since the twelfth century the areas that today are Finland had oscillated between Swedish and Russian influence (Alapuro, Citation1988, p. 19). From 1809 until 1917 Finland was a Grand Duchy of Russia. The Russian Tsar Alexander let Finland keep its Swedish legislation and many of its institutions, including the four-estate Diet which was modelled on the Swedish one. However, the Diet was only called irregularly, in 1809 and then not until 1863. For this reason, Finland in the nineteenth century was to a high degree ruled by the bureaucracy (which in turn was dominated by the nobility). Alapuro (Citation2004, p. 86) sees Finland in the nineteenth century as a combination of Western and Eastern European pattern: it was Eastern in that it was an ethnic minority ruled by an empire, while it remained Western in its social structure, with free farmers and no serfdom.Footnote3 Finnish agriculture was less developed than that in the other Nordic countries, related to the very Northern geography, with following cold climate, of Finland (Alestalo & Kuhnle, Citation1987, p. 10; Ojala & Nummela, Citation2006).
Finnish industrialisation was late. In the 1860s, 70s and 80s, industry stood for less than 20% of GDP (Hjerppe, Citation1989; Hjerppe & Jalava, Citation2006, pp. 33–35; Koivuniemi, Citation2018, pp. 213–215). It was also quite rural, described as taking place ‘in the middle of the forest’ (Alapuro, Citation1988; Haapala, Citation1987). The forest was indeed central to Finnish industrialisation, in which timber and wood industry, including tar production, led the way. The rural location of industry also grew out of its dependence on water power and hence proximity to rapids. As late as 1860, exports only represented about 10% of GDP. However, they grew rapidly in the 1860s and 1870s, reaching a level of 25% of GDP in 1880, and staying around that level until World War One (Hjerppe, Citation1989, p. 151). Exports were heavily dominated by forest products. Lumber was 44% of exports in 1900 and together with paper and pulp industries, products based on wood constituted 69% of exports (Alapuro, Citation1988, p. 32; Kaukiainen, Citation2006; Kuisma, Citation1993). The use of steam as power source in the saw mills was forbidden until 1857, but after abolishing this regulation, the industry grew very rapidly. An indicator of the growing weight of the Finnish timber industry is that The Economist of London first started publishing the prices of timber and planks from Finland in 1856 (Klinge, Citation1996, p. 184). The forest-based industry became more and more complex and from the 1870s on paper industry grew rapidly, as new techniques were introduced and paper exports to Russia boomed (Haapala & Lloyd, Citation2018, p. 26; Meinander, Citation2006, pp. 129–130). Finland was connected to St Petersburg by railroad in 1870; as well, transports over the Gulf of Finland were an advantageous route (cf. Alapuro, Citation1988, pp. 59–61).
In understanding the social aspect of Finnish industrialisation, it is important to notice that forests were to a high degree owned by farmers, especially since the middle of the eighteenth century after the general reparceling of previously state-owned fields and forests. As Ahvenainen (Citation1974, p. 13) states, ‘the Finnish farmer is almost always also a forest owner’. Incomes from these exports facilitated the transition to stock-raising for the farmers, increased purchasing power in the countryside, and thereby increased demand for domestic industry products (Alapuro, Citation1988, p. 34, 43, 262). This gave timber, paper and pulp exports special inter-sectoral linkages in Finland. In Norway and Sweden, which also had large forest-based industries, it was more common that merchants and companies owned the forests and exploited them. The transition to stock-raising was important for Finnish farmers after 1870 because of the large supply on the international markets in this period of cheap Russian grains. Like all grain producers, the Finnish farmers here faced stiff competition, but their transition was successful both because of the forest-based incomes and because of the very rapid growth of St Petersburg which, together with the building of railroads from the 1860s on, offered a large market for Finnish butter and other animal products (cf. Peltonen, Citation1992a, who emphasises the painful nature of the transition).
Finland’s experience of proletarianisation during the nineteenth century was intense, among other things because of relatively low rates of emigration to the United States and ‘nowhere else in Scandinavia did the problems of the landless rural proletariat become as pressing as in Finland’ (Alestalo & Kuhnle, Citation1987, p. 14; cf. Nummela, Citation2018, pp. 102–103). From 1801 to 1900, the Finnish population increased by 153%, which is a similar rate to Denmark’s 159% and Norway’s 154%, but higher than Sweden’s 119% (Jörberg, Citation1973, p. 14; see also Haapala & Peltola, Citation2018).
In terms of historical inequality, Jutikkala (Citation1953), Soltow (Citation1981) and Nummela (Citation1988) provide important previous studies of wealth distribution in Finland before 1900.Footnote4 Jutikkala and Soltow both use a wealth tax from 1800, with a sample of 2000 male household heads. While this tax is very interesting for inequality researchers as it covered the entire population, estimates built on it are likely to underestimate inequality as the tax allowed people to choose to have their property assessed ‘silently’, whereby the details and values of one’s individual property were excluded from the tax statistics and official publications built on it. Since wealthy people had reasons to not let other people know how wealthy they were, this option is likely to have been used the most by people with a lot of wealth. This means that studies built on the 1800 tax underestimate the true level of inequality. The next benchmark after that are Statistics Finland’s wealth tables, which begin in 1909; they are built on tax data and more reliable (Roine & Waldenström, Citation2015). We will get back to these estimates in relation to our results. Nummela (Citation1988) uses probate inventories, like this study but not with the adjustments for social class and the modern estimation techniques used here.
3. The dataset
Our estimates for wealth and its inequality 1750–1900 are built on probate inventories. Probate inventories were mandatory by law in Sweden-Finland from 1734 on (Markkanen, Citation1978, p. 67). They were made at the time of death to settle the division of inheritances, for re-paying debts, and for paying a small (0.125%) tax which funded poor relief. The Swedish-Finnish probate inventories were very comprehensive in their coverage of asset types, as they included real estate and land as well as movables and cash, and all debts. They are thus a very good resource for studying historical wealth and its distribution (cf. Bengtsson et al., Citation2018; Kuuse, Citation1974). Unlike the 1800 wealth tax used by Soltow (Citation1981), they include movables, and unlike for example the British probate inventories, they include real estate (cf. Lindert, Citation1986).Footnote5 The content of the probate inventory of the lower to middle classes could be as follows. The middle classes, such as farmers, would have clothes of wool, extensive bedding, a good selection of crockery, furniture such as clocks, several sets of clothing, books, and in the case of farmers, animals. The very poor would have very little furniture, little clothing beyond what they wore at the time, and very meagre household goods (see Moring, Citation2007, pp. 241–242 who presents four actual individuals from the mid-nineteenth century). As Moring (Citation2007, p. 246) remarks, ‘Inventories are fascinating sources that make us feel as if we come closer to the past.’ However, here we will abstract from the individual cases to focus on the aggregates.
The Finnish probate records have been used for example by Laurikkala (Citation1947) in his study of the dwellings and household appliances of farmers in one southwestern region in the eighteenth century, Markkanen (Citation1977) in a study of wealth and credit relationships in the rural population of central Finland 1850–1914, Nummela (Citation1990a, Citation1995) in studies of wealth inequality in Savonia and Central Finland, and Hemminki (Citation2014) in a local study of farmers in a western district of Finland and an eastern district in northern Sweden 1796–1830 in terms of their wealth and, especially, their credit relationships.
Often discussed features of pre-industrial probate inventories is if they contain all assets of the deceased and if certain assets could be underestimated. As we have seen above, the first objection is not relevant for Finland and Sweden. Concerning underestimation there are Swedish investigations indicating some underestimation of all kinds of assets, and especially land, before the 1860s (see discussion in Bengtsson et al., Citation2018). It is impossible to know if and how much this is the case in our Finnish sample. But if so, it would probably underestimate inequality 1750, 1800 and 1850, since land was an important asset, driving inequality.
The analysis in the paper builds on a great number of probate inventories collected by Ilkka Nummela between 1985 and 1989 (cf. Heikkinen, Hjerppe, Kaukiainen, Markkanen, & Nummela, Citation1987 for an early report from the project). As a whole, the dataset includes 27,100 probate inventories from 1653 to 1915. The inventories come from six towns and 28 rural judicial districts. It must be stressed that the dataset has not been created by a random sampling strategy; rather, the inventories have been collected over a longer time and for different purposes. This is a problem for the generalizability, but we believe that the dataset should still be used, given how large it is, that it encompasses so many different parts of Finland, and, simply, that it is the only comprehensive dataset of historical wealth which exists for Finland. We will come back to the possible problems of the unrepresentative sample.
The towns in the dataset are Oulu/UleåborgFootnote6 on the northwest coast in the province of Ostrobothnia, Kokkola/Gamlakarleby on the west coast (also in Ostrobothnia), Hämeenlinna/Tavastehus in the southern central part of the country (Tavastia Proper), Kuopio in eastern central Finland (Savonia), Porvoo/Borgå on the south coast, and Käkisalmi/Kexholm in Viipuri Province, since 1944 transferred to Russia. They constitute a healthy mix of towns in that they include towns from different parts of the country and with different histories – for example, Porvoo is a medieval city, while Käkisalmi was a small peripheral town which grew especially with the arrival of railways and paper mills around 1900. We have to remember that Finland was a very rural country in the period we study, so the towns are small. In 1805, Oulu had 3483 inhabitants, Kokkola 1710, Hämeenlinna 1689, Kuopio 819, and Porvoo 2038. The most populous cities (rather: towns) in Finland in this time were Turku with 11,300 inhabitants and Helsinki with 8843 (Jutikkala, Citation1953, pp. 96–97). In other words, we miss the two largest towns, but on the other hand the six towns in the sample are rather representative of Finnish towns in this period, in their variety. Oulu was indeed the third largest town, while Kuopio in 1805 was very small. By 1900, the population had grown to 16,306 in Oulu, 2646 in Kokkola, 5357 in Hämeenlinna, 11,732 in Kuopio, 5035 in Porvoo, and 1626 in Käkisalmi. Nineteenth century population growth was quite rapid in Oulu and Kuopio, but slow in Kokkola. Again, this shows the variety in our sample of six towns.
The rural parishes are drawn especially from three parts of the country.Footnote7 One is the southwestern region, southeast of Tampere and northwest of Helsinki. This is the region where industrialisation – and industrial agriculture – began in Finland (Klinge, Citation1996, pp. 108–110). The second region well-represented is around Jyväskylä in central Finland, slightly to the northeast. The third region is the eastern province of Savonia, which in the nineteenth century was known as an economically backward region (Alapuro, Citation1988, p. 58). This diversity, that the sample is drawn from the northwest and southwest of Finland, regions which had strong trade ties to Sweden, and from the east, which on the contrary traded more intensely with St Petersburg after 1809, is a strength of the dataset.Footnote8 However, the very North, which had a very small share of the population, and the eastern-most region of Carelia are both missing. We will further discuss the problem of regional composition below, and cross-check with other data that the representation issue does not bias the results.
We construct four benchmark estimates (1750, 1800, 1850 and 1900), for which we cluster enough inventories to be able to produce nationally representative estimates. In order to compile our benchmarks, we use a 20-year window, considering all observations recorded 10 years before and 10 years after each benchmark year. Because of the width of our windows, we have deflated all series using 1900 prices.
We follow Bengtsson et al. (Citation2018) in classifying the population in four social groups: nobility, bourgeoisie, farmers, and a residual category of ‘others’/workers and lower middle classes. The reasons for using a nobility category are rather self-evident, given their privileges, including their group representation in the parliament until 1906. They have been studied as a group by for example Wirilander (Citation1982). The bourgeoisie, until the late nineteenth century privileged by mercantilist regulations, captures the mostly urban merchants, traders and entrepreneurs who ran businesses. They play an important role in Finnish historiography (e.g. Rosenlund Eriksson, Citation2010). The farmers were a very large share of the population. The final category could be spliced up in more categories but we use the broad category of workers and lower middle classes to get enough probate inventories in each group. Thus, this category is quite heterogeneous.Footnote9
Beyond the issue of regional composition discussed above, and which we will get back to in the empirical investigation, the dataset has three major shortcomings, arising from the nature of Finnish probate inventories. The first is that it does not include information on the age at death of the probated individuals (Markkanen, Citation1978, p. 68, remarks on this difference between Swedish and Finnish practice.). This is problematic as the probated population is on average older than the living one and therefore the sample has to be adjusted for age to be able to represent the living population (Lindgren, Citation2002; Piketty et al., Citation2006). We solve this problem by relying on the age distribution from the Swedish dataset in Bengtsson et al. (Citation2018). We basically order the individuals in the two samples according to their wealth attach to each individual a percentile and match Swedish and Finnish individuals based on the percentile they occupy in their distribution. Finally, we assign for each match the age of the Swedish individual to the Finnish one. This is of course a second best solution compared to having direct information on the age of the deceased; bias in this case could arise especially from the matching of the wealthiest individuals with an age far from the true one. However, although the age-earning profile of the two countries might have differed over the period, we are confident that the high number of observations can even out the effect of individual mismatching.
The second shortcoming is that except for the years 1827–1865, we do not have enough information on the wealth of the nobles. The reason is that an important part of the noble court archives of Finland went up in smoke in the Great Fire of Turku in 1827 (Nummela, Citation2013). We adjust for this problem by first compiling an all Finnish benchmark for the nobles in 1850. We then assume that the development of the size of Finnish nobles’ wealth mirrors that of the Swedish nobles from Bengtsson et al. (Citation2018) that were located outside of Scania and Stockholm; Scanian and Stockholm nobles were especially wealthy, and thus not comparable to Finnish ones. We then extrapolate to 1750, 1800 and 1900 by applying this growth rate to the 1850 Finnish nobility. Our methodology can be justified as an assumption given that the Finnish nobles – in fact, they were often Swedish-speaking – had a similar position before 1809 as other regional nobility within the country, and that the Russians did not interfere with the composition of the nobility after 1809. The Finnish elites, in return, allied with the new Russian regime without much fuss (Meinander, Citation2006, p. 100). We must remember that the Tsar had very low ambitions in terms of ‘Russification’ of Finland, at least until 1899; Swedish and Finnish remained the main languages of the province, and much of the administration, army etc. were separated from the main Russian state (cf. Meinander, Citation2006, pp. 143–145). However, this still means that our estimate for 1850 is more complete and more reliable than the estimates for 1750, 1800 and 1900. We will get back to the reasons why we still believe that the results are defensible also for these years.
The third shortcoming is that in our sample the urban population is generally over represented.Footnote10 To overcome this issue, an adjustment through the replication of individuals from the rural population is necessary to match the correct urban-rural ratio. It is however not realistic to assume that the overrepresentation of the urban population is the same in all social groups: for instance, we know that the bourgeoisie and the nobility are far more urban than the Finnish average; therefore, adjusting them according to the overall urban share of Finland would introduce far more rural bourgeois and nobles than there should be. To avoid any bias of this type, we proceed is the following way: we leave the sample as it is for the nobility (which is 51% urban and 49% rural in 1850, the only year we have direct information), for the bourgeoisie (which fluctuates between 72% urban in 1800 and 95% urban in 1900) and for the farmers (which are always 100% rural) and we only adjust the workers, replicating the rural ones until the overall urban-rural ration for Finland was correct. Doing so, we are able to arrive to a balanced rural-urban sample without changing the intra-group urban-rural ratio for the groups for which we believe the starting sample is not clearly biased. and describe the dataset after ages have been assigned and the 1850 nobles have been used to in the other years. shows the four social groups that we use in the analysis and shows the sample in the seven age classes. The columns ‘True’ indicate the share of each social and age group in the living population.
Table 1. Probate inventories in the sample by socio-economic group (number and share) compared to actual social distribution.
Table 2. Probate inventories in the sample by age (number and share) compared to actual age distribution.
As is clear from the two tables, the distribution of both social and age groups in the sample is very unbalanced. In particular, nobles and older individuals are overrepresented. We adjust for these two dimensions. To adjust for age we use the inverse mortality multiplier approach, simply multiplying each wealth observation in each age group for the inverse of the mortality rate by age group. Doing so, the observations for the younger groups have a larger weight in the calculation of inequality measures. For social groups, we keep the size of the most overrepresented group fixed and then replicate individuals in the other groups so that they match the living population shares (following Bengtsson et al., Citation2018).
4. Finnish inequality 1750–1900
Let us begin by considering a key indicator of economic inequality: the share of private wealth held by the richest decile of the population. shows this indicator for Finland in 1750, 1800, 1850 and 1900, compared to four other economies for which long-run estimates exist: Britain, France, Sweden, and the United States.Footnote11
Figure 1. Finnish wealth inequality in international perspective, 1750–2010. The richest decile’s share of total wealth. Notes: Sources are USA 1774 and 1870 from Shammas (1993, p. 424) and Piketty (Citation2014) for 1910–2010, Britain 1740–1870 from Lindert (1986, ) and from Piketty (Citation2014) for 1910–2010, France from Piketty et al. (Citation2006), Sweden from Bengtsson et al. (Citation2018) for 1750–1900 and from Piketty (Citation2014) for 1910–2010. Finland 1910–2010 from Roine and Waldenström (Citation2015).
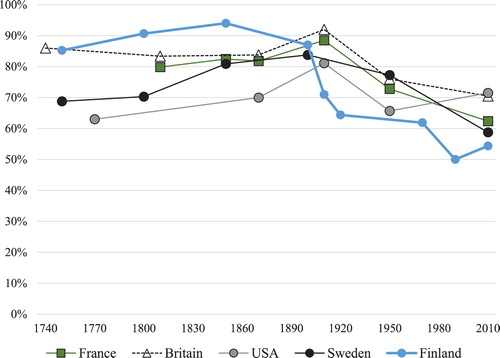
There are two striking and surprising facts about Finnish inequality from 1750 to 1900. One is that the level is extremely high in 1750, 1800 and 1850. Given how poor the economy was in these years, and how little industrialisation there was going on, from the literature (Kuznets, Citation1955; Milanovic et al., Citation2011), we would expect inequality to be lower. Finland, whose GDP per capita was about half of British and French levels in these years, was more unequal than all the four comparison countries in 1800 and 1850.Footnote12 The second surprising fact is that precisely when we from the Kuznets Curve would expect inequality to increase, meaning when industrialisation gets going in the mid-nineteenth century, it actually decreases. For more detail, provides the top 1%, 5% and 10% shares as well as the Gini coefficients for the four benchmark years, with a comparison with Sweden.Footnote13
Table 3. Wealth inequality in Finland and Sweden, 1750–1900.
From 1850 to 1900, inequality does not decrease as much when we look at the Gini coefficient as when we look at the top decile’s share. The Gini coefficient only falls by 5.2% (5 points out of 96), while the top decile’s share falls by 7.4% (7 points out of 94.3), and the top percentile’s share by a third (from 74% to 50%). This indicates that inequality decreased especially by the middle of the distribution catching up on the top: the top shares decreased very heavily, but without, perhaps, an all-over flattening of the distribution. When Finland industrialised, the wealth of the elite did not at all grow at the same pace as the wealth of the population at large – unlike Sweden, where inequality increased during these years.Footnote14
We now turn to explaining these results, which challenge some of the established theories of long-run change in inequality.
4.1. Social structure
Finland saw rapid expansion of the non-landowning class during the nineteenth century. 75% of the rural population were landowning in 1820 and only 50% in 1870. It can thus be assumed that rural inequality grew during this period (cf. Alapuro, Citation1988, p. 47; Voutilainen, Citation2016, p. 80, 83). The change of social structure in both Finland and Sweden is shown in .
Table 4. Social structure in Finland and Sweden, 1750–1900 (percent).
The Finnish bourgeoisie grew slower than the Swedish, which reflects the lower rate of industrialisation. The end-to-end decrease of farmer and the increase of workers is similar in the two countries.
Another important difference is that Finland urbanised later than Sweden. Sweden was a very rural country in the nineteenth century, with only around 10% of the population in cities in 1800 and 1850. Between 1850 and 1900 however, this proportion more than doubled. The Finnish experience, as we see in , was similar but from a lower level (cf. Eloranta & Ojala, Citation2018, p. 161). Here, only 5% to 6% of the population lived in cities 1750–1850. The proportion did about double from 1850 to 1900, but still only reached 12.6% in 1900. Given that cities typically were more unequal than the countryside, this could imply lower inequality in Finland.
Table 5. Urbanisation (share of population in urban areas) and industrialisation (share of value added in industry) in Finland and Sweden.
Finland industrialised and urbanised later than Sweden did.Footnote15 shows the Gini coefficients for urban and rural areas. As in most other countries, urban inequality was higher than rural inequality. In 1750, the urban Gini coefficient was 0.84 while the rural was 0.75. From 1750 to 1800 the urban Gini grows to over 0.9, and stays on this level until 1900. Rural inequality grows more dramatically, from 0.75 in 1750 to 0.91 in 1800, after which it stays around 0.9. Given that most Finns lived in the countryside, these changes are of great importance to overall inequality.
Table 6. Urban and rural wealth in Finland 1750–1900, mean wealth and Gini coefficients.
also shows that wealth differences between urban and rural residents were very large, but decreasing, in Finland in our period. In 1750 the average urban resident – remember that the urban population was only a very small share of the population – was 13 times wealthier than the national average. However, the urban-rural gap shrank significantly over time, to 8 times wealthier in 1800 and to 3 times wealthier in 1900. The results highlight that rural wealth grew rapidly between 1750 and 1800 and between 1850 and 1900.
4.2. Social groups
slices the wealth cake in a different way, showing wealth per social group, with the average wealth of each group represented in multiples of the wealth of the average Finn. The ‘share’ column shows the group’s share of total private wealth.
Table 7. Wealth by social group, 1750–1900.
The farmers’ relative position improved dramatically over time. In 1800 and 1850 they were almost 40% poorer than the average person, but by 1900 they were instead 64% wealthier than the average.Footnote16 The result also accords very well with what showed, that rural wealth grew much faster than urban wealth between 1850 and 1900.
Our explanation is the rapid expansion of the forest-based industries, which we have discussed in Section 2, combined with the re-orientation from grain production to animal products. Since most of the Finnish forests were owned by farmers, they benefitted from the very rapid expansion of the forest sectors, which increased the price of their forest land. Alapuro (Citation1988, pp. 44–45) claims that ‘differences between manors and wealthy peasant farms nearly disappeared’ during the industrialisation period after 1860, when the peasants grew rich on the basis of their forestry, and could afford a re-orientation of agriculture towards husbandry and exports of butter to the rapidly growing Russian capital of St Petersburg, which with 524,000 inhabitants in 1863 was one of the largest cities in Europe (Alapuro, Citation1988, p. 59). This statement accords well with our findings in . Peltonen (Citation1992b, pp. 365–366) presents estimates that in 1900, 36% of peasant households produced enough timber so that they could sell it in the market. He presents this as a low number and rather puts more weight on the role of butter for farmers’ cash flows, but nevertheless forest incomes seem important. Peltonen (Citation1992a) also emphasises the pain of the farmers’ transition from crop farming to dairy farming; however, it does seem that they came out of the indeed painful process having gained something. What was furthermore helpful for farmers was that taxes on agriculture were fixed and thus regressive, so farmers got to keep all of their expanded surplus, and the peasants were also politically strengthened as the Diet started convening regularly again after 1863. Our results in do indicate that farmers were the social group which benefitted the most from the economic development of the country during the second half of the nineteenth century.Footnote17
Regarding the effect of the expansion of forest-based industries on wealth and its distribution, it is important to note the difference between Finland and Sweden. In northern Sweden (Dalarna and Norrland), which was the most important location for wood, paper and pulp industry in the country, corporations owned about 20% of the forest (Sundbärg, Citation1913), and furthermore they had long-run usage contracts for a large part of the forest which they did not own. By the late 1860s, corporations had bought the right to fell the forest on among one third of Jämtland and one fourth of Gävleborg County, and the corporate expansion continued rapidly until the beginning of the twentieth century. The more corporation-dominated ownership of the forest in Sweden has important implications for the different inequality effects of industrialisation in the two countries. In 1900 companies owned 0.9 million hectares forests in Finland and in 1923 1.9 million hectares (7.6% of total forests area), while in northern Sweden corporations owned about one third of the land in 1900 (Enander, Citation2007, p. 18, 20). Finland companies owned in 1900 only 0.6% of the land area (Harve, Citation1947, pp. 34–36; Laitinen, Citation2012, pp. 37, 41–44; Vennola, Citation1917, pp. 38–39, 44).Footnote18
We move forward with a breakdown of inequality per social group. shows wealth distribution within each of our four social groups. The nobility shows a high and stable inequality. The stability is not surprising given that the 1850 benchmark is the base for all the others and only the mortality multiplier adjustment is responsible for the slight differences in the other years. The bourgeoisie does not show much change, and neither do the workers. Normally, less wealthy groups such as workers should display little inequality, but since we have for economy used only four social groups, the ‘workers and lower middle class’ group is quite diverse. We do not put too much emphasis on the results for this precise group, as it is so diverse. For the farmers, we find an increase in within-class inequality from 1750 to 1800 (as in Nummela, Citation1988, p. 34), and then stability.
Table 8. Within–inequality for social groups in Finland, 1750–1900 (Gini coefficients).
shows Finnish inequality with the Theil index. The Theil index is a widely used measure of inequality, already employed in the Swedish case by Bengtsson et al. (Citation2018). Although the Theil index is not normalised between a lower and an upper bound like for instance the Gini index, it has the great advantage to be fully decomposable into a within and a between component when different groups can be identified in the sample. In our case, the groups we are interested in a the social groups from , so we decompose inequality within-class (inequality among the individuals of the same social group) and the between-class inequality (inequality originating from different wealth between different social groups). This allows us to ask: were differences between the four social groups or within them more important for total inequality?
Table 9. Within and between components of inequality in Finland, 1750–1900 (Theil index).
The two components seem to be generally balanced. They are about par in 1800, in 1850 the between component is larger, and in 1900 after a large decrease in the between component, the within component is larger. This information together with the wealth catch-up by the farmers shown in supports our interpretation that the decrease in inequality from 1850 to 1900 was driven by the growing wealth of the farmers in relation to the upper-class groups, the nobility and the bourgeoisie. This increase in farmer wealth decreased the between component, but the within difference stayed important.
Lindert (Citation1986) once pointed out that since land was so incredibly unequally held in Britain, the growth of industry and cities actually had an equalising effect, ceteris paribus, on wealth inequality. The growth of other asset classes than land equalised asset holding since they were not as unequally held as the arable land of which in 1873, 80% was held by 7000 individuals (cf. Thompson, Citation1963, p. 27). Forested land was not a new asset class in Finland after 1850, but the use of steam power after 1857, new paper processing techniques from the 1870s on, and the increasing export possibilities, offered by newly built railways and expanding economies abroad, gave it a new value (cf. Klinge, Citation1996, pp. 184–187). Since farmers held so much of it, they benefitted tremendously. The Finnish case was in a sense opposite to the British analysed by Lindert, but also parallel. Finland lacked a dominant upper class of large landowners corresponding to the nobles and gentry in Britain. Instead, the dominance of the upper class in nineteenth century Finland was based on control of the bureaucracy and the state (Alapuro, Citation1988, p. 91). Thus, the growth and intensification of capitalism may in Finland unusually enough have had egalitarian implications.
4.3. Robustness checks
One may doubt our argument on the evolution of Finnish wealth inequality, on the basis that we only have a complete dataset in 1850, and that we use proxies for nobles’ wealth in 1750, 1800 and 1900. However, the inverted U from 1800 to 1900/1909 holds up also if we instead use our own data only for 1850, when we have the full dataset, and combine this with Soltow’s (Citation1981) tax-based estimate for 1800 and the official tax-based estimate for 1909. This is demonstrated in .
Figure 2. Top decile’s share of total wealth 1800–2010, using our data only for 1850. Notes: Sources: Soltow’s (Citation1981) tax data analysis for 1800, official estimates presented by Roine and Waldenström (Citation2015) for 1909–2010. Our estimate for 1850.
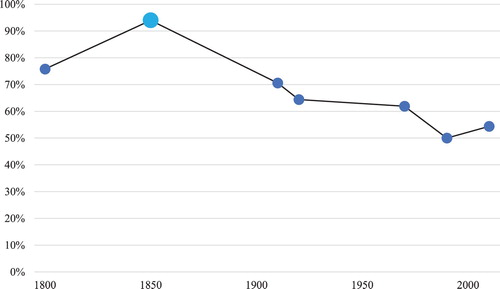
Furthermore, we should keep in mind that Soltow’s estimate for 1800 underestimates inequality, as some wealthy people opted for ‘silent’ taxation and thus are excluded from the preserved tax data.Footnote19 When this is taken into account, our story holds up here too: Finland was quite unequal in 1800 and 1850, on par with Britain and France in terms of the top decile’s share of total wealth, and then, uniquely, inequality dramatically decreased from 1850 to the early twentieth century, during Finland’s most intense industrialisation period.
provides further robustness checks. Panel A shows the pattern of inequality if we remove the nobility from the sample, considering that we only have full data for them in 1850. Beyond the expected drop in inequality, a similar pattern through time is observed, confirming the overall picture, although with some smoother evolution. Panel B in provides a robustness check for the changing geographical composition of the dataset. Since the dataset was not created to be nationally representative, the geographical representation varies over time. Especially, there are very few observations from Eastern Finland (more specifically the Savonia region) in the 1750 and 1800 benchmarks, but many in the 1850 and 1900 benchmarks. Since Savonia was poorer and probably less unequal than other parts of the country, especially the southwest, this might bias the results (cf. Åström, Citation1993, p. 33). Panel B tests for this effect.
Table 10. Robustness checks: wealth inequality excluding nobility or excluding Savonia, 1750–1900.
Panel B in shows that our results hold up when we exclude Savonia parishes and the Savonia town Kuopio from the sample.
One more robustness check is represented by the inequality measures that we can calculate based on the 1914 Estate Tax paid on testamentary successions (Finland Statistiska Byrån, Citation1909–Citation1917). This source provides the number of individuals and the wealth of the succession in Finland in 1914 before any taxation (similarly to our probate inventories). The data are presented in 18 wealth brackets and with a breakdown in 8 regions, for which we have both rural and urban wealth. This dataset, unlike ours, does not provide a breakdown by social group but it provides a full geographic coverage of the country, making it suitable to be compared to our overall estimates. From this dataset, we can first check whether the overall level of wealth inequality is comparable with ours; we can then remove first the regions of Savonia as in and then the most northern region of Oulun, which beyond the city of Oulu is missing in our dataset, to check whether they impact the overall trend. shows the results. If we compare our results for 1900 from to Panel A, we note that the Gini coefficient and the 10% top share are both in 1914 four points lower, while the 1% top share is two points higher. Considering the different year base, the different source and the fact that the 1914 estimates use information from wealth classes, this appears as a remarkably consistent result. Panel B and C supports the geographical composition of our sample, showing that at least in 1914, removing either the Eastern region of Savonia or the Northern region of Oulun does not significantly change the overall results.
Table 11. Robustness checks: wealth inequality in 1914.
A final robustness check is to compare the level of wealth per household according to our probate inventory dataset. According to our data, the level of wealth per household is in 1900 prices 278 kr in 1750, 215 kr in 1800, 183 kr in 1850, and 968 kr in 1900. There are not many indicators that we can compare with within Finland. Heikkinen et al. (Citation1987, p. 69) provide wage data for 1750–1913 in constant prices. According to their data, the real wage fell by about one quarter from 1750 to 1800, then increased by about 67% to 1850, and then increased much more rapidly, by about 100% to 1900. Our data concord with Heikkinen et al.’s wage data in that wealth falls 1750–1800 and that 1850–1900 is the most rapid increase, but our 15% decrease 1800–1850 is not matched in the wage data. Of course, wages and wealth are quite different indicators, and especially in an agrarian, subsistence-based economy such as the Finnish, we should not expect a perfect fit. Heikkinen et al. (Citation1987, pp. 80–82) also study probate inventories, using an early version of the dataset used in this paper, with six cities but a much more limited rural sample. When deflating inventory wealthy by the prices of a consumer basket, they find a huge fall in average wealth from the mid-eighteenth century to 1800, by about half, and then a fairly large increase to 1850. From their inspection of the data, it appears that measured wealth around 1750 simply was abnormally high. It should also be noted that they do not control for changes in the social composition of the population, as we do. Heikkinen and Nummela (Citation2015) estimate GDP per capita in Finland since 1733 using wage data and Swedish wage and GDP data. They find that Finnish GDP per capita fell significantly from 1750 to the early nineteenth century, then increased until 1850, and then increased much faster 1850–1900. In general, then it seems that the data we use give a picture which accords with previous studies when it comes to the level of wealth. For the decrease in average wealth which we find 1800–1850, the most likely explanation is proletarianisation, as the share of the population who were farmers decreased by 7 percentage points, with a corresponding increase in the workers’ share. This means that while wealth might have increased within social groups – farmers, over-sampled by Heikkinen et al. (Citation1987), and workers, proxied by real wage – there was a contradictory force driving down average wealth in the total population, as the poorer groups grew faster in size.
5. Conclusions
Finland is the poorest economy for which we now have consistent long-run inequality estimates before 1900. As such, our study provides peculiar insights into the dynamics of inequality. The Finnish case provides evidence at odds with three influential arguments in the extant literature. One, the relationship between average incomes and inequality. As argued by Milanovic et al. (Citation2011), we would expect poorer economies to have lower inequality. However, Finland in 1800 was as unequal as the much wealthier countries Britain and France, and more unequal than the wealthier United States. Two, the even more influential argument that inequality grows with industrialisation and urbanisation (the Kuznets Curve). On the contrary, in Finland inequality grew before industrialisation from 1800 to 1850, and decreased heavily from 1850 to 1900, during industrialisation. Our results then join in with what Alfani and Ammanati (Citation2017, p. 1073) call ‘revisionist’ studies of historical inequality, studies which contradict the classical Kuznetsian argument, like Rossi et al. (Citation2001), Malinowski and van Zanden (Citation2016) and Reis (Citation2017). Three, the decrease in inequality from 1850 is also at odds with the argument made by Scheidel (Citation2017) and Alfani (Citation2015) that inequality only decreases in connection to disasters and wars. By all means, 1867–1868 saw a Finnish famine caused by harvest failures that resulted in over 100,000 deaths – in fact the last major famine in the history of the Nordic countries (Dribe, Olsson, & Svensson, Citation2017; Voutilainen, Citation2016). But there are no signs showing that this produced the kind of economic or institutional change that could reverse long-term trends in inequality patterns. In Finland between 1850 and 1900 inequality decreased because of a kind of inclusive growth, built on widespread property rights in a large share of the population, when the forest became more valuable as timber industry and other forest-based industries grew.
Finland is just one country case study and it might prove to be exceptional, but the results do point to that we need further studies to further our understanding of historical inequality. We would argue that the Finland results presented here suggest the historical inequality literature must consider the influence of property rights and their distributions, class, and institutions as well as economic development and external factors such as wars and disasters, if we shall understand long-run inequality (cf. Acemoglu & Robinson, Citation2015; Lindert & Williamson, Citation2016). The peasant-dominated Finnish route here appears as a historical counterpart to what in development economics would be referred to as ‘inclusive growth’.
The comparison with Sweden is striking. In Sweden, inequality increased drastically from 1850 to 1900. This increase was driven especially by new industrial fortunes being concentrated in the hands of the bourgeoisie elite (Bengtsson et al., Citation2018). In Finland, the development in these years is very different. Industry was less dominant in the economy, and the ownership of peasant farmers was more important as a share of the economy. In Sweden, wealth inequality only started to decrease after 1930, with strong trade unions driving up wages and decreasing profits, and taxation reducing the great fortunes. Sweden never had a land reform, and despite the country’s egalitarian reputation, the role of great noble landowners was quite important in 1900 and still is today (Gary & Olsson, Citation2017). Finland on the other hand seems to have had a stronger farmer class in 1900. It went through a terrible, costly Civil War between ‘Reds’ and ‘Whites’, but in this country unlike in Sweden, in the 1920s a string of land reforms was put through, decreasing the right of companies to buy forest, and strengthening crofters’ right to the soil. In 1923, companies owned only 7.6% of forest land, while individuals held 51.0% and the state 39.8% (Statistics Finland, Citation1930, p. 95). These reforms have been put forward as an explanation of rapid and equal economic growth in the 1920s and 1930s (Meinander, Citation2006, p. 164), in arguments parallel to those stressing the positive impact of land reforms in East Asia after 1945. Maybe we can see the Finnish route to equality, compared to the Swedish, as a more whole-heartedly agrarian one. We should remember that in Finland in 1950 still about half of the labour force was in agriculture, while the same figure was only 23% in Sweden (calculated from Edvinsson, Citation2005). Thus, although it would appear easy to bunch together Sweden and Finland as two similar, Nordic countries, there routes to equality were marked by differences as well as similarities. The important role of big capital in Swedish modernisation has been pointed out in the comparison with Norway, which lacked a ‘Wallenberg’ family and where instead the petite bourgeoisie and state bureaucrats were more important (Sejersted, Citation1993). A similar point can be made in the comparison with Finland.
The development of Finnish inequality 1750–1900 contrasts with the mostly influential arguments in the historical inequality literature. This highlights the fact that, just as Alfani and Ammanati (Citation2017) point out in their recent study of the Florentine state 1300–1800, our stock of high-quality measurements of pre-1900 inequality actually is quite limited. We may for example point to the lack of long-run estimates of inequality in such an important state as Prussia. In an economy allegedly so dominated by nobles (the famous Junkers, Moore, Citation1966; Wehler, Citation1973), how did inequality develop during the nineteenth century as international market integration increased and industry spread? On the other end of the spectrum, there is no study of the peasant farmer-dominated economy of Norway, which we would expect to be especially equal. On the more unequal end of the spectrum, the Baltic states with their large estates and long duration of feudalism, and of course Russia with a similar model, would be fascinating cases for inequality analysis. To develop our understanding of and theories about historical inequality, we need studies of such nations and regions. Our paper also opens up for further investigation of how the poor country of Finland could be so unequal 1750–1850. This paper has focused on the wealth estimates themselves and situating the Finnish case in an international context, but we have not developed the analysis of the Finnish context. Such an approach would be highly interesting to further advance our understanding of long-run change in inequality.
Acknowledgements
This paper has been presented at Finland in Comparison V conference in Tampere, October 2016; the Nordic Historians’ Meeting in Aalborg, August 2017; the European Historical Economics Society conference in Tübingen, September 2017; and the Economic history seminar at the Paris School of Economics, October 2018. We are grateful to all participants for comments and criticisms. We have discussed the paper with Sofia Gustafsson, Valeria Lukkari, and Jarmo Peltola and are very grateful to them for their input. We are indebted to the editors and the two anonymous referees of the journal for constructive criticisms and suggestions which have helped to improve the paper.
Disclosure statement
No potential conflict of interest was reported by the authors.
ORCID
Erik Bengtsson http://orcid.org/0000-0003-1523-0565
Additional information
Funding
Notes
1 This according to the Maddison Project Database, available at https://www.rug.nl/ggdc/historicaldevelopment/maddison/ (cf. Bolt, Inklaar, de Jong, & van Zanden, Citation2018). Hemminki (Citation2014, p. 228) in her comparison of a district in southern Ostrobothnia in Finland and a district on the coast of the north of Sweden 1796–1830 finds that average wealth was about twice as high in the Swedish district. However, we do not know how representative these districts are. According to Nummela (Citation2017) the mean wealth was twice as high in the Swedish provinces compared to the Finnish provinces in 1800.
2 The same cannot be said about the second part of the Kuznets Curve, Kuznets’ (Citation1955) political economy argument that eventually, as urban lower-income groups organized for protective legislation, legislative interference and political decisions counteracted and decreased inequality.
3 Similarily, Eloranta, Ojala, Pehkonen, and Bruno (Citation2018, pp. 18–19) find that Finnish wages in the eighteenth and nineteenth centuries stagnated, as in Eastern European cities but in contrast to what happened in Stockholm and other Western European cities, where wages grew in this period.
4 There are also studies (Nummela, Citation1990b, Citation2011) based wholly or partly on a 1571 one off tax; since this is outside of our period, we do not discuss that here.
5 A marginal exception is that for the nobility, books, clothes and small things could be excluded from the inventories (Ilmakunnas, Citation2004, p. 133). This means that we slightly underestimate the wealth of the nobility and therefore also inequality.
6 As Finland is bilingual, we state the town names both in Finnish (first) and Swedish (second).
7 The precise districts included are Akaa, Hattula, Haukivuori, Hausjärvi, Jokioinen, Jämsä, Karstula, Keuruu, Korpilahti, Laukaa, Leppävirta, Längelmäki, Mikkeli, Muhos, Multia, Mäntyharju, Pieksämäki, Pihtipudas, Pirkkala, Pälkäne, Rautalampi, Saarijärvi, Sahalahti, Somero, Sääksmäki, Tammela, Viitasaari, and Vilppula. The number of probate inventories per district varies from 52 in Pihtipudas and 63 in Karstula to 1851 in Pieksämäki and 1901 in Rautalampi.
8 Cf. Klinge (Citation1996, pp. 187–192) on the effects on eastern Finland of the 1856 Saimaa canal and the 1870 S:t Petersburg railroad. Alapuro (Citation1988, p. 57, 74–77) stresses that Ostrobothnia was strongly integrated with the Swedish economy, not the least Stockholm, before 1809 and that it lagged the rest of Finland after the integration in the Russian empire.
9 Bengtsson et al. (Citation2018) in their study of Sweden 1750–1900 show in an Appendix that using a more fine-grained classification, with 11 or 16 social groups, does not change the overall results in terms of estimated wealth inequality.
10 The urban share in the sample in our four benchmarks is 35%, 23%, 26% and 53% while Finland as a whole had an urbanisation rate of 5%, 5.5%, 6.4% and 12.6%.
11 Even if there are differences in the sources used, our Finnish estimates are comparable to these international ones, as they all build on full wealth estimates for individuals. The French estimates by Piketty et al. (Citation2006) build on tax data and encompass all types of individual wealth, the US estimates adjusted by Shammas (Citation1993) and Swedish estimates by Bengtsson et al. (Citation2018) build on probate inventories which include all relevant types of wealth. Lindert (Citation1986) had to integrate several types of sources but did so to assure full coverage of wealth types.
12 It is also worth to mention that wealth inequality had increased during the early modern times: Gini coefficient for movables wealth was 0.49 in 1571, according to Nummela (Citation2011).
13 and the following tables also provide jackknife confidence intervals. The jackknife re-sampling procedure leaves out in each round one observation and re-calculates the gini coefficient with n-1 observations. The n-1 estimates obtained produce an estimate of the distribution of the Gini coefficient that is used to produce confidence intervals.
14 Markkanen (Citation1977, p. 191) has on the other hand stressed the decline between 1850 and 1910 in the proportion of the rural population who were poor. On his count, in 1850 there were 338 ‘poor’ persons for each rich one, while in 1910 it was ‘only’ 40 poor persons per rich one. This also indicates decreasing inequality, by a relative growth of the middle groups and decrease of the bottom groups.
15 One could point out that Finnish urbanisation is underestimated since new towns still were counted as countryside in the official statistics; one historian claims that if the new industrial towns are counted as urban, then 35% of the population was urban in 1910 rather than the 15% in the official statistics (Meinander, Citation2006, p. 134; also Eloranta & Ojala, Citation2018, pp. 162–165). However, there are similar issues in Sweden, and the general picture of later urbanisation would hold also with amended data.
16 This accords with Heikkinen et al.’s (Citation1987, p. 82) finding of a very rapid increase in gross wealth of probated farmers in Sääksmäki judicial district in south-central Finland from 1870 to about 1890. While they find little increase in wealth from 1750 to 1830, they find an increase after that and a very rapid rising trend 1870–1890. They explain the stagnation in wealth from 1750 to about 1830 with that Sääksmäki was a relatively peripheral area. Laurikkala (Citation1947) found rising living standard among farmers in the southwestern region of Finland Proper in the eighteenth century; this was the economic core of the country at the time, which can explain the differences between Sääksmäki and Finland Proper.
17 It should be noted here that in 1750 the average wealth of the bourgeoisie is higher than that of the nobility. This is a result that should be taken with a grain of salt because of the lack of direct estimates of the nobility in 1750.
18 In 1908 the Finnish government passed a law forbidding corporate purchases of land useful for farmers, and this law was renewed in 1925 (Meinander, Citation1999, p. 121). These laws were explicitly made to avoid corporation-dominated ownership of important resources, as was the case in other European countries.
19 That it was especially the very rich who opted for the silent taxation is shown by the fact that the divergence in estimate of the top percentile’s share between our estimate of 55% and Soltow’s of 34% is very large.
References
- Acemoglu, D., & Robinson, J. A. (2015). The rise and decline of general laws of capitalism. Journal of Economic Perspectives, 29(1), 3–28. doi: 10.1257/jep.29.1.3
- Ahvenainen, J. (1974). The competitive position of the Finnish paper industry in the inter-war years. Scandinavian Economic History Review, 22(1), 1–21. doi: 10.1080/03585522.1974.10407780
- Alapuro, R. (1988). State and revolution in Finland. Berkeley: University of California Press.
- Alapuro, R. (2004). What is western and what is eastern in Finland? Thesis Eleven, 77(1), 85–101.
- Alestalo, M., & Kuhnle, S. (1987). The scandinavian route: Economic, social, and political developments in Denmark, Finland, Norway, and Sweden. International Journal of Sociology, 16(3/4), 3–38.
- Alfani, G. (2010). Wealth inequalities and population dynamics in early modern northern Italy. Journal of Interdisciplinary History, 40(4), 513–549. doi: 10.1162/jinh.2010.40.4.513
- Alfani, G. (2015). Economic inequality in northwestern Italy: A long-term view (fourteenth to eighteenth centuries). The Journal of Economic History, 75(4), 1058–1096. doi: 10.1017/S0022050715001539
- Alfani, G., & Ammanati, F. (2017). Long-term trends in economic inequality: The case of the florentine state c. 1300–1800. The Economic History Review, 70(4), 1072–1102. doi: 10.1111/ehr.12471
- Åström, A.-M. (1993). ‘Sockenboarne’: herrgårdskultur i Savolax 1790–1850. Helsinki: Svenska litteratursällskapet i Finland.
- Bengtsson, E., Missiaia, A., Olsson, M., & Svensson, P. (2018). Wealth inequality in Sweden, 1750–1900. The Economic History Review, 71(3), 772–794. doi: 10.1111/ehr.12576
- Bolt, J., Inklaar, R., de Jong, H., & van Zanden, J. L. (2018). Rebasing ‘maddison’: New income comparisons and the shape of long-run economic development. Retrieved from http://www.ggdc.net/maddison/maddison-project/data.htm
- Dribe, M., Olsson, M., & Svensson, P. (2017). Famines in the Nordic countries, AD 536–1875. In G. Alfani & C. Ó Gráda (Eds.), Famines in European history (pp. 185–211). Cambridge: Cambridge University Press.
- Edvinsson, R. (2005). Growth, accumulation, crisis. Stockholm: Stockholm University.
- Eloranta, J., & Ojala, J. (2018). Suomi kansainvälisessä taloudessa 1600–2000. In P. Haapala (Ed.), Suomen rakennehistoria: Näkökulmia muutokseen ja jatkuvuuteen (1400–2000) (pp. 142–169). Tampere: Vastapaino.
- Eloranta, J., Ojala, J., Pehkonen, J., & Bruno, L. C. (2018). Equality and convergence in the Nordic societies in the long run: Europe and other comparative mirrors (unpublished manuscript).
- Enander, K.-G. (2007). Skogsbruk på samhällets villkor: Skogsskötsel och skogspolitik under 150 år. Umeå: Swedish University of Agricultural Sciences.
- Finland Statistiska Byrån. (1909–1917). Suomen virallinen tilasto: IV. Varallisuustilasto. A, Jäämistötilasto. Kuolimpesät ja testamentit sekä niistä kannettu leimavero vuosina 1914–15: Successions et testaments ainsique leur impôt de timbre. Helsinki: Keisarillisen senaatin kirjapaino.
- Fougstedt, G. (1953). Suomen väestön sääty- ja ammattiryhmitys vuosina 1751–1805. Helsinki: Unknown Publisher.
- Gary, K., & Olsson, M. (2017). Business as usual: Nobility and landed estates in Sweden. Essays in Economic & Business History, 35(1), 149–171.
- Haapala, P. (1987). How was the working class formed? The case of Finland, 1850–1920. Scandinavian Journal of History, 12(3), 179–197. doi: 10.1080/03468758708579115
- Haapala, P., & Lloyd, C. (2018). Johdanto: rakennehistoria ja historian rakenteet. In P. Haapala (Ed.), Suomen rakennehistoria: Näkökulmia muutokseen ja jatkuvuuteen (1400–2000) (pp. 6–30). Tampere: Vastapaino.
- Haapala, P., & Peltola, J. (2018). Elinkeinorakenne 1750–2000. In P. Haapala (Ed.), Suomen rakennehistoria: Näkökulmia muutokseen ja jatkuvuuteen (1400–2000) (pp. 170–209). Tampere: Vastapaino.
- Hanson Jones, A. (1980). The wealth of a nation to be: The American colonies on the eve of the revolution. New York: Columbia University Press.
- Harve, P. (1947). Puunjalostusteollisuutta ja puutavarakauppaa harjoittavien yhtiöiden maanhankinta Suomessa. Acta Forestalia Fennica 52. Helsinki: Suomen Metsätieteellinen Seura.
- Heikkinen, S., Hjerppe, R., Kaukiainen, Y., Markkanen, E., & Nummela, I. (1987). Förändringar i levnadsstandarden i Finland 1750–1913. In G. Karlsson (Ed.), Levestandarden i Norden 1750–1914 (pp. 67–94). Reykjavik: University of Iceland.
- Heikkinen, S., & Nummela, I. (2015). Economic growth in Finland and in Sweden, 1733–2014: Comparative estimates. Paper presented at the Eleventh Conference of the European Historical Economics Society, University of Pisa, 4–5 September 2015.
- Hemminki, T. (2014). Vauraus, luotto, luottamus: Talonpoikien lainasuhteet Pohjanlahden molemmin puolin 1796–1830 (Doctoral dissertation). University of Jyväskylä, Jyväskylä.
- Hjerppe, R. (1989). The Finnish economy 1860–1985: Growth and structural change. Helsinki: Bank of Finland.
- Hjerppe, R., & Jalava, J. (2006). Economic growth and structural change: A century and a half of catching up. In J. Ojala, J. Eloranta, & J. Jalava (Eds.), The road to prosperity: An economic history of Finland (pp. 33–63). Helsinki: Suomalaisen Kirjallisuuden Seura.
- Ilmakunnas, J. (2004). Adelsdamen som konsument på 1700-talet. Historisk Tidskrift för Finland, 89(2), 116–134.
- Jörberg, L. (1973). The industrial revolution in the Nordic countries. In C. Cipolla (Ed.), The fontana economic history of Europe (pp. 375–485). Fontana: London.
- Jutikkala, E. (1953). The distribution of wealth in Finland in 1800. Scandinavian Economic History Review, 1(1), 81–103. doi: 10.1080/03585522.1953.10409900
- Kaukiainen, Y. (2006). Foreign trade and transport. In J. Ojala, J. Eloranta, & J. Jalava (Eds.), The road to prosperity: An economic history of Finland (pp. 127–163). Helsinki: Suomalaisen Kirjallisuuden Seura.
- Kilpi, O. K. (1913). Suomen ammatissa toimiva väestö ja sen yhteiskunnalliset luokat vuosina 1815–75 (Vols. 1 & 2). Helsinki: Kansantaloudellinen yhdistys.
- Klinge, M. (1996). Finlands historia 3: Kejsartiden. Helsingfors: Schildts.
- Koivuniemi, J. (2018). Tehtaiden Suomi ja deindustrialisaatio 1900–2000. In P. Haapala (Ed.), Suomen rakennehistoria: Näkökulmia muutokseen ja jatkuvuuteen (1400–2000) (pp. 210–243). Tampere: Vastapaino.
- Koskinen, S. (2007). Suomen Väestö. Helsinki: Gaudeamus Helsinki University Press.
- Kuisma, M. (1993). Metsäteollisuuden maa: Suomi, metsät ja kansainvälinen järjestelmä 1620–1920. Helsinki: Suomen Historiallinen Seura.
- Kuuse, J. (1974). The probate inventory as a source for economic and social history. Scandinavian Economic History Review, 22(1), 22–31. doi: 10.1080/03585522.1974.10407781
- Kuznets, S. (1955). Economic growth and income inequality. American Economic Review, 45(1), 1–28.
- Laitinen, E. (2012). Luontoistaloudesta kaupalliseen metsätalouteen. In H. Roiko-Jokela (Ed.), Ihminen ja metsä – kohtaamisia arjen historiassa 2 (pp. 15–206). Helsinki: Metsäkustannus.
- Laurikkala, S. (1947). Varsinais-Suomen talonpoikain asumukset ja kotitalousvälineet 1700-luvulla: kulttuurihistoriallinen tutkimus (doctoral dissertation). University of Turku, Turku.
- Lindert, P. (1986). Unequal English wealth since 1670. Journal of Political Economy, 94(6), 1127–1162. doi: 10.1086/261427
- Lindert, P., & Williamson, J. G. (2016). Unequal gains. Princeton, NJ: Princeton University Press.
- Lindgren, H. (2002). The modernization of Swedish credit markets, 1840–1905: Evidence from probate records. The Journal of Economic History, 62(3), 810–832. doi: 10.1017/S0022050702001092
- Malinowski, M., & van Zanden, J. L. (2017). Income and its distribution in preindustrial Poland. Cliometrica, 11(3), 375–404. doi: 10.1007/s11698-016-0154-5
- Markkanen, E. (1977). Maaseutuväestön varallisuusolot ja luottosuhteet Sisä-Suomessa elinkeinoelämän murroskaudella v. 1850–1914. Jyväskylä: University of Jyväskylä.
- Markkanen, E. (1978). The use of probate inventories as indicators of personal wealth during the period of industrialization: The financial resources of the Finnish rural population 1850–1911. Scandinavian Economic History Review, 26(1), 66–83. doi: 10.1080/03585522.1978.10407896
- Meinander, H. (1999). Finlands historia 4. Helsingfors: Schildts.
- Meinander, H. (2006). Finlands historia: linjer, strukturer, vändpunkter. Helsinki: Söderströms.
- Milanovic, B. (2016). Global inequality. Cambridge, MA: Harvard University Press.
- Milanovic, B., Lindert, P., & Williamson, J. G. (2011). Pre-industrial inequality. The Economic Journal, 121, 255–272. doi: 10.1111/j.1468-0297.2010.02403.x
- Moore, B. (1966). Social origins of dictatorship and democracy: Lord and peasant in the making of the modern world. Boston: The Beacon Press.
- Moring, B. (2007). The standard of living of widows: Inventories as an indicator of the economic situation of widows. The History of the Family, 12(4), 233–249. doi: 10.1016/j.hisfam.2007.11.002
- Nicolini, E. A., & Palencia, F. (2016). Comparing income and wealth inequality in pre-industrial economies: Lessons from 18th-century Spain (EHES Working Paper, No. 95).
- Nummela, I. (1988). Förmögenhetsskillnaderna i Finland under slutet av 1700-talet. Historisk Tidskrift för Finland, 73(1), 27–39.
- Nummela, I. (1990a). Torpparista viis’ itsellisestä kaks’ … Taloudellinen eriarvoisuus Suomen maaseudulla vuosisadan vaihteessa. In Sitä kuusta kuuleminen, Jorma Ahvenaiselle omistettu juhlakirja (pp. 201–234). Studia Historica Jyväskyläensia 41. Jyväskylä: University of Jyväskylä.
- Nummela, I. (1990b). Savolaisten varallisuuserot historian valossa: vuoden 1571 hopeaveroluettelosta tämän vuosisadan alkuun. Kuopio: Kuopion kaupunki.
- Nummela, I. (1995). Keski-Suomen varallisuuskuva autonomian ajan lopulla. In H. Roiko-Jokela & T. Pitkänen (Eds.), Sisä-Suomen tuomiokirjat tutkimuslähteinä ja elämän kuvaajina (pp. 78–112). Jyväskylä: Jyväskylän Historiallinen Arkisto.
- Nummela, I. (2011). Regional inequality. In M. Hakanen, J. Haikari, & M. Lamberg (Eds.), Physical and cultural space in pre-industrial Europe. Lund: Nordic Academic Press.
- Nummela, I. (2013). Suomen aateliston varallisuudesta autonomian ajan alkupuolella. Historiallinen Aikakauskirja, 111(2), 164–184.
- Nummela, I. (2017). Suurvalta-ajan Ruotsi maailmantaloudessa (ja vähän Suomikin). Paper presented at Suomalaiset historiapäivät 2017.
- Nummela, I. (2018). Väestö, asutus ja elintaso ennen teollistumista 1500–1900. In P. Haapala (Ed.), Suomen rakennehistoria. Näkökulmia muutokseen ja jatkuvuuteen (1400–2000) (pp. 92–113). Tampere: Vastapaino.
- Ojala, J., & Nummela, I. (2006). Feeding economic growth: Agriculture. In J. Ojala, J. Eloranta, & J. Jalava (Eds.), The road to prosperity. An economic history of Finland (pp. 95–91). Helsinki: Suomalaisen Kirjallisuuden Seura.
- Peltonen, M. (1992a). Talolliset ja Torpparit: Vuosisadan vaihteen maatalouskysymys suomessa. Helsinki: Suomen Historiallinen Seura.
- Peltonen, M. (1992b). Finnish peasant farming in the age of agrarian crisis, 1880s–1910s. Review (Fernand Braudel Center), 16(3), 357–381.
- Piketty, T. (2014). Capital in the twenty-first century. Cambridge, MA: Harvard University Press.
- Piketty, T., Postel-Vinay, G., & Rosenthal, J.-L. (2006). Wealth concentration in a developing economy: Paris and France, 1807–1994. American Economic Review, 96(1), 236–256. doi: 10.1257/000282806776157614
- Reis, J. (2017). Deviant behaviour? Inequality in Portugal 1565–1770. Cliometrica, 11(3), 297–319. doi: 10.1007/s11698-016-0152-7
- Roine, J., & Waldenström, D. (2015). Long run trends in the distribution of income and wealth. In A. Atkinson & F. Bourguignon (Eds.), Handbook of income distribution (Vol. 2A, pp. 471–592). Amsterdam: Elsevier.
- Rosenlund Eriksson, T. (2010). Jacob Pacchaléns yrkeskarriär och nätverk: Från boddräng till handelsman i 1700-talets Helsingfors. Historisk Tidskrift för Finland, 95(4), 537–571.
- Rossi, N., Toniolo, G., & Vecchi, G. (2001). Is the kuznets curve still alive? Evidence from Italian household budgets, 1881–1961. Journal of Economic History, 61(4), 904–925. doi: 10.1017/S0022050701042024
- Scheidel, W. (2017). The great leveller. Princeton, NJ: Princeton University Press.
- Schön, L., & Krantz, O. (2012). Swedish historical national accounts 1560–2012. Lund Papers in Economic History No. 123.
- Sejersted, F. (1993). Den norske Sonderweg. Oslo: Universitetsforlaget.
- Shammas, C. (1993). A new look at long-term trends in wealth inequality in the United States. The American Historical Review, 98(2), 412–431. doi: 10.2307/2166841
- Soltow, L. (1981). Wealth distribution in Finland in 1800. Scandinavian Economic History Review, 29(1), 21–32. doi: 10.1080/03585522.1981.10407936
- Statistics Finland. (1905). Katsaus Suomen väkilukuun joulukuun 31. päivänä 1900 ynnä tietoja edellisistä yleisistä väenlaskuista maassa. Helsinki: Tilastollinen päätoimisto.
- Statistics Finland. (1930). Suomen Tilastollinen Vuosikirja 1930. Helsinki: Statistics Finland.
- Sundbärg, G. (1913). Tankar i utvandringsfrågan. Stockholm: Norstedts.
- Thompson, F. M. L. (1963). English landed society in the nineteenth century. London: Routledge & Kegan Paul.
- Van Zanden, J. L. (1995). Tracing the beginning of the Kuznets curve: Western Europe during the early modern period. The Economic History Review, 48(4), 643–664. doi: 10.2307/2598128
- Vennola, J. H. (1917). Maanomistus Suomen maalaiskunnissa. Tilattoman väestön alakomitea VI. Helsinki: Unknown Publisher.
- Voutilainen, M. (2016). Poverty, inequality and the Finnish 1860s Famine (doctoral dissertation). University of Jyväskylä, Jyväskylä.
- Wehler, H.-U. (1973). Das deutsche Kaiserreich 1871–1918. Göttingen: Vandenhoeck.
- Wirilander, K. (1982). Herrskapsfolk. Ståndspersoner i Finland 1721–1870. Stockholm: Nordiska muséet.