?Mathematical formulae have been encoded as MathML and are displayed in this HTML version using MathJax in order to improve their display. Uncheck the box to turn MathJax off. This feature requires Javascript. Click on a formula to zoom.
ABSTRACT
Reduced transport costs and income growth in industrialising European countries changed the market conditions for European farmers in the late nineteenth century. Grain prices fell while dairy prices rose. It has been claimed that these price changes hit large grain farmers with vested interests in grain trade particularly hard, while owner-occupiers and smallholders fared better and with help of developing cooperative associations, came out as successful commercial agriculturalists by switching to intensive branches, foremost dairying. Recent research on the Danish case, shows, however, that change was initiated on large elite estates with long-term dairy traditions. The literature on the Swedish case indicates, that larger farms switched to intensified fodder production quicker than smaller farms did, while in the early twentieth century smaller farms played an un-proportionally large role on the dairy market. Using individual farm data from two East-central Swedish parishes in 1878/80, 1895/96 and 1910/11, it is shown, that larger farms tended to modernise crop rotations and switch towards dairy production earlier than small farms did. Smaller farms caught up, and by 1910 their land use was about as strongly adapted to commercial dairy production as larger farms’ land use was.
JEL-CODES:
1. Introduction
The farmstead Råby no 3, in Vaksala parish right east of Uppsala and 80 km north of Stockholm, was cultivated in 1878 by Per Jacobsson, his wife Anna, a grown up son and a thirteen-year-old daughter, Anna Sofia. In the household, Per’s brother and a female servant were included, as well as Per’s father Jacob and his mother Greta Kajsa. The farm held 17 hectares of arable land and seven hectares of natural meadow. A two-field system was used and six hectares of the arable land were in fallow. Winter rye and barley were the most important crops, but the household also sowed some oats and mixed grain (oats/barley), some peas and potatoes. Two hectares of the arable land were used for sown ley. The farm held four horses, five cows, two young cattle, six sheep and two swine. 32 years later, the same farmstead was run by Per’s and Anna’s daughter Anna Sofia and her husband Karl Alfred Karlsson. The meadow had been ploughed up and the arable land amounted to 24 hectares; the two-field system was abandoned. No more than three hectares were in fallow. A third of the arable land was used for clover and timothy within a seven-year rotation system. Mixed grain, used for fodder, was by far the most important crop, followed by oats (also fodder) and rye. The household still kept two pigs but only two horses and no sheep, but eight cows, four young cattle and 16 hens. It is evident that increasing shares of the farm incomes came from milk.Footnote1
The story of this household is typical. Reduced transport costs and the following ‘grain invasion’ from America and Russia (Aparicio, Pinilla, & Serrano, Citation2009, pp. 53–54; O’Rourke, Citation1997), urbanisation and income growth for major strata of populations in industrialized/industrialising European countries changed the market conditions for European farmers in the late nineteenth century. In short, grain prices fell, while dairy prices rose. Many countries imposed tariffs to protect their grain farmers. A few, for example Denmark, stayed free trading and managed to transform the structure of the farm sector to specialise in dairy products and pork.Footnote2 Tariffs or not, such re-structuration happened, albeit more reluctantly, in most of the continental countries (Grigg, Citation1992, p. 69).
In Sweden grain surpluses, particularly oats had become a major export item by the 1850s (Fridlizius, Citation1957). The oats export culminated in the 1880s, but oats production, basically for domestic use increased into the twentieth century. Oats were increasingly used as input for milk, and indirectly butter production, i.e. as fodder for cows (Fridlizius, Citation1985; Kuuse, Citation1977). Swedish butter production more than tripled between the early 1870s and the outbreak of the First World War (Morell, Citation2011a, p. 186). Butter exports replaced the oats and peaked by the turn of the twentieth century, while more and more bread grain – on the eve of the First World War, circa 25% of domestic consumption – was imported (Morell, Citation2001, pp. 99–100). The fall of grain prices and the relative increase of prices of dairy products thus induced farmers to switch from commercial grain cultivation towards commercial dairy production. This affected land use. The area used for fodder crops, in particular sown ley, increased (Morell, Gadd, & Myrdal, Citation2011, p. 292).
The fodder (spring) grain exports mainly originated from western and southern Sweden, while east central Sweden, partly for climatic reasons, was more concentrated on winter rye. This rye was mainly sold in the nearby Mid-Swedish mining and iron industry area, and in the capital Stockholm. Commercial grain production for these markets had developed for centuries (Söderberg, Citation1984).
It has been suggested that the relative price changes, particularly due to the influx of cheap American grain, hit large European commercial grain farmers particularly hard, while small farmers and smallholders, fared better and – in some cases with help of cooperative associations – came out of the process as successful commercial agriculturalists (Djurfeldt, Citation1981; Friedmann, Citation1978; Gerschenkron, Citation1989; Morell, Citation2011a). Concerning Denmark, a traditional view held that the emancipated, well educated middle size yeoman farmers and smallholders laid behind much of the strong agricultural expansion in the mid-nineteenth century, and – through the cooperative organisations – the dairying breakthrough from the 1880s onwards. It has, however been pointed out that large estates normally switched to koppelwirtschaft a couple of decades before the middle size farmers, that there were considerable economies of scale in dairying, which before the cooperatives favoured the large estates and that by the 1860s advanced large dairy farms started to give concentrated fodder to milk cows (Dieckmann Rasmussen, Jensen, Bjørn, & Christensen, Citation1988, pp. 246–247, 348–349, 317). Recently it has been shown by Jensen, Lampe, Sharp, and Skovsgaard (Citation2018) that the dairy expansion, and even the localisation of the cooperative creameries emanated from ‘the introduction of proto-modern, dairies run by agricultural elites on estate farms’, indeed large Holstein-tradition estates which had been established already by the late eighteenth century and which also spearheaded the development of modern crop rotations (quote p. 6). The picture is not to be simplified for the Swedish case either, some large estates certainly managed to switch to dairying and take the lead in producing butter and consumption milk for urban centres.Footnote3 Early on, some of them built modern barns and introduced an industry-like work organisation with integrated processing units (Köll, Citation1983; Morell, Citation2001, p. 324; Niskanen, Citation1995). By investing in better cow breeds and improved winter-feeding, they also managed to increase milk yields per cow (reflected in higher values per cow according to probate inventory studies), a factor that has recently been shown crucial for the Danish dairy success, hitherto much attributed to new processing technology and the institutional innovation of cooperative processing (Köll, Citation1983, p. 163; Kuuse, Citation1970; Peterson, Citation1989, p. 64).Footnote4 In Sweden, as earlier in Denmark (see above), in the initial stages, large estates with integrated dairies dominated the scene. Later, private specialised dairies, which bought up milk from large number of local deliverers, expanded. Together with cooperative dairies (which in Sweden did not really dominate before well into the twentieth century) and small cream centrifuges, they provided the processing infrastructure the small scale farmers needed (Morell, Citation2001, pp. 101–103). At least for the Swedish case it has not, however, been specifically determined if there were systematic differences in how the market signals affected land use of different categories of farms.
While the story of switch towards commercial dairying on different types of farms has often been based on inter-regional comparisons, this article, in order to highlight the importance of farm size, investigates the change of land use in one specific region comprising two random parishes in the southern, relatively fertile part of the East-Swedish county of Uppsala, north and west of Stockholm. We use a data set which allows the study of land use changes on individual farms. The type of data used is, as far as have been observed available only for Uppsala County, and the total studied area has to be restricted since many of the farm units for all years studied has to be reconstructed from different fractions of cadastral land units used by the same farmer. Also, over time the farm units were unstable, through many subdivisions and mergers of units. The parishes are Vaksala, directly east of Uppsala and Weckholm southwest of Uppsala. Until the 1860s, farmers in this area were specialised in cultivating and selling barley and rye to the Stockholm, and close-by mining area markets. They were part of a region where a two-field system with much fallow was used, and where rye had been the most important crop. Winter fodder for the cattle foremost originated from natural meadows. In some cases, clover was grown on the fallow. A little timothy was also sown but all in all very little fodder crops was grown on the arable land. Generally, farmers in the area had been so concentrated on commercial rye (and barley) cultivation that much of the meadow had been ploughed up rather early.Footnote5 Contemporary observers complained about lack of fodder, lack of manure and, as a consequence, a threatening fall of yields (Sjöström Citation1916, p. 44). This system was, from circa 1870 to 1900, gradually replaced by a system of 6–8 year rotations with little fallow, much fodder cropping and with fodder grains and grasses as the foremost crops on the arable land (Lägnert, Citation1955; Sporrong, Citation1985). This change of rotation was connected to the draining and ploughing up of remaining large lowland meadows. The meadows more or less disappeared, and hay from sown ley fields and fodder roots from the fields replaced the meadow hay. While rye, and increasingly wheat, was still grown, dairy products and indirectly fodder crops, were by the early twentieth century – even in this previously bread-grain dominated area – commercially more important (Morell, Citation2001, p. 200).
The land use changes will be analysed both on aggregated parish level and individual farm level, in order to clarify whether farms of different size typically responded differently to the market signals. The two parishes are lumped together, since there is no indication of large systematic difference between them affecting the land use system. In the econometric analysis they are however treated separately, to account for the fact that Weckholm was located directly on the shore of lake Mälaren and there was some meadow land and pasture there which was not readily possible to transform into arable land.
Both parishes were well situated from a market point of view. Weckholm, close to a navigable bay of lake Mälaren had easy sailing access to Stockholm, and benefited from the Enköping-Stockholm railway, opened in 1873 (c. 80 km). The Uppsala-Stockholm rail connection (80 km) benefitting the Vaksala farmers, opened in 1866.Footnote6
This was an era of strong development of the regional milk market and the regional, national and international butter market. In the 1860s dairy companies were established in Uppsala County as in other parts of Sweden, and by the 1870s and early 1880s the County Agricultural Society supported the creation of new small dairies and milk collecting stations. In 1890 there were 61 dairies in the county, most of them run by large estates and exclusively using the milk from the estates and tenant farmers related to the estate. A few were commercial dairy companies with several branches which bought up milk from farmers in the area; one of them owned a farm holding in Vaksala parish where it bred pigs, using the residual milk after butter making. By 1910 the total number of dairies had fallen to 34 and by now a couple of them were cooperatives. Since 1890, the amount of milk processed by dairies in the county had close to tripled. The number of farmers delivering to dairies had risen from 482 in 1890 to 525 in 1900 and 939 in 1910. This was but a fraction of all milk producers: In the county, there was by 1910 roughly 3 600 farmers producing at least some milk. And while 36,237 tons of milk was delivered to dairies in 1900, total production amounted, according to one rough estimation in 1899, to 65,000 tons. About half was thus processed (and/or consumed) on farms. Many small farmers could, however, reach local markets with butter without selling via dairies. Following Laval innovations small hand driven cream separators came into common use among small holders by the 1890s. The production and marketing of farm/home-made butter was supported in various ways by the agricultural society (Arenander, Citation1916, pp. 194–198; Bring, Citation1915, pp. 179–180).Footnote7 To conclude: the possibilities for the farmers in the two parishes to take part in the expanding dairy market were good and improving.
In Section 2 of the paper the research question and a hypothesis is stated. The data used is presented in Section 3. In Section 4, we describe the methods used. Section 5 relates the relative price changes of the period. In Section 6, the land use changes in the two parishes taken together will be clarified and in Section 7, land use changes of farms of different size and the relation between farm size and land use changes are analysed. The results and conclusions are discussed and summarised in the final Section 8.
2. Research question – hypothesis
The aim is to clarify whether there occurred farm-size related differences in the timing and magnitude of land use changes induced by relative price changes in the studied area between 1858 and 1910.
There is a substantial literature on the price responsiveness of American farms in the late 19th and early twentieth century, and the general conclusion seems to be that farmers indeed were responsive as choices of crop mixes and technics were concerned (Cooley & DeCanio, Citation1977; Hayami & Ruttan, Citation1971). Sectorwise, it seems clear that Swedish farmers were responsive too, in the same period (although many did argue for grain tariffs).
Intuitively, one might argue that larger farms, would adapt quicker and fuller to market incentives than smaller farms. Large landowners or farm entrepreneurs typically had better financial resources, their farms were run more exclusively for commercial purposes in order to generate profits comparable to yields on alternative investments. For smallholders and small family farmer households, the alternative to farming was rather wage work than other types of capital investments and for them the balance between subsistence and commercial production was a bit more even (Chayanov, Citation1986; Morell, Citation1998, Citation2001, pp. 34–35). Large estates were able to employ better educated staff and acquire more adequate market information. In the specific situation, when there were reasons to switch from bread grain to dairying, a substantial reframing of farm practices was needed, it was not a matter only of switching from one crop to another. To be able to respond in this particular case, farmers needed access to processing infrastructure and development of a new market channel. It is reasonable that this, and the economies of scale in dairying, gave larger estates an initial advantage: they could integrate dairies and go in the new direction before a structure of private dairies or dairy cooperatives had developed.
On the other hand, the turn of the twentieth century was the era of smallholdings in much of northern Europe. There were agronomic battles going on about the pros and cons of land reforms and emergence of smallholdings (Hussain & Tribe, Citation1984; Morell, Citation2011b, pp. 466–471). Smallholdings and family farmers were by some observers thought to imply more labour intensive operations. It was generally concluded that the possibilities for commercial small-scale farming laid in animal husbandry, dairy, pork and perhaps even egg production. The smallholders’ movement was strong in Sweden too, and it has been observed that by the early twentieth century, smallholders and small family farms contributed un-proportionally much to market output when it came to dairy, meat and pork production (Morell, Citation1998, Citation2001). Moreover, it could possibly be argued that the large grain producers had more vested interest in commercial bread grain production than the smaller farms, and that this might have led them to stick to the old attested, assured ways of producing marketable grain for established market channels.
A study by Lägnert (Citation1955) on the spread of modern crop rotations in Southern and central Sweden throughout the nineteenth century states – for example as Uppsala County is concerned – that larger estates and large farms went ahead before the smaller farms in replacing the meadows with fodder cropping on the arable land, reducing the fallows and introducing multi-year crop rotations, reluctantly from 1840s and more generally from the 1860s onwards.Footnote8 Lägnert implies this from contemporary qualitative statements from hundreds officials and agricultural society leadership (Lägnert, Citation1955, pp. 8–9. Cf. Sjöström, Citation1916, pp. 55–62).
Following Morell (Citation2001), Jensen et al. (Citation2018), the above reasoning and for the specific area studied also Lägnert (Citation1955), the hypothesis embarked from here, is that larger farms adapted quicker and fuller to the market signals and ploughed up the meadows, introduced fodder cropping on the arable land and redirected their commercial attention towards dairy production. As it is already known that small farms in the early twentieth century played an un-proportionally important role in dairy production in Sweden in the early twentieth century (Morell, Citation1998, Citation2001, p. 326), it must also be part of the hypothesis that smallholders and ‘yeomen’ caught up the large farms lead in modernised land use, by the turn of the century.
3. Data
This article uses the published agricultural statistics series in BiSOS N Agricultural and animal husbandry, started by the Statistics Sweden in 1865 and continued into 1911. It provides, on parish and county level, annual information on acreages, land use, seed- and harvest volumes and the keeping of farm animals. The quality of the data has, however, been shown to be problematic (Svensson, Citation1965). The collecting of data, carried out by the local branches of the county-wise agricultural societies, was much improved in the mid-1870s in many counties. This meant that factual changes were mixed up with statistical fiction. Moreover, new, improved data was not collected for any entire county every year. Instead, each year new data was collected for a number of parishes, then in the next year data, for another set of parishes, etc., so that ‘new’ data for the whole county took a number of years to collect. After some years, when all parishes had been covered once, a new round of detailed surveys commenced, and new data was again collected for the same sequence of parishes. In the years between, the old data was used. For example, for Vaksala parish, detailed surveys were carried out in 1878, 1895 and 1910 and for Weckholm in 1880, 1883, 1896 and 1911. For the years 1879 (Vaksala) and 1880 (Weckholm), the detailed data collected in 1878 (Vaksala) and 1880 (Weckholm) was used. For the years in between 1879 and 1895, the Vaksala data from 1878 was still used, the data from 1895 was used until 1910. Similarly, for Weckholm the data from 1880 was used until 1883, the 1883 data to 1896 and the 1896 data up to 1911. Therefore, aggregations for any particular year became distorted. However, the parish data, for the years the improved collections were made are realistic, for these particular years.
From the years of the detailed surveys, the primary material, with notations on all recorded variables specified for individual farm holdings is available in the Uppsala district archive.Footnote9 For those years, there is thus detailed data on land use on both parish and farm level.
This primary material was used by Carin Israelsson (now Carin Martin). Israelsson studied the keeping of milk cows in a number of parishes around Uppsala on parish and farm level. By comparing with probate inventories and accounts from large estates, she concluded that the total number of cows in the parishes was correctly stated in the detailed survey used for the statistical publication, but that the number of cows on large units was overstated, while it was understated as smallholdings was concerned (Israelsson, Citation2005, pp. 81–87, 90–92). This was, because most of the smallest units were not independent farms but torp. A torp was a smallholding leased out from a large mother farm to a tenant/worker, who paid the rent by working on the large mother farm and sometimes also paid part of the rent by delivering milk (or cash).Footnote10 Often (but according to the material used here, far from always) the statistical surveyor, reckoned the cows (and other animals) held by the tenant/worker, as belonging to the mother farm.Footnote11 The agricultural land, the arable land and the meadows used by the torp is, however, always reckoned as belonging to the mother farm. Therefore, it is, impossible to state whether the land use on the individual torp, was more or less geared towards fodder or grain production, than the land use on larger units. Therefore, these dependent smallholders, with no land registered, are excluded from the analysis. Whether their cows were separately registered or registered for the demesne does not matter much for the present research question about land use on small or large farms (and considering the very small number of cows they held, it does not matter much when judging the sizes of the large estates’ cattle stocks either).
Prior to the years of the first detailed studies for the chosen parishes, there exist no statistical primary material from them in the archives. There is, however, parish level data from 1858 in the archive of the 1858 national financial committee. Local committees within each parish in the entire country collected data and in many cases these committees had access to enclosure maps. Therefore, the 1858 material should be of reasonable quality. Like the BiSOS material it gives information on the land use, sowings, harvests and number of animals within each parish. It does not, however, provide any farm level data.Footnote12
Finally, regional market price scales for grains and butter (Jörberg, Citation1972) aggregated annually from local prices, and earlier shown to represent real market prices, will be used to detect market signals. Shorter term time price variations need not be detected. Price data on cows (deflated with rye prices) are used to detect the quality changes of cows since the dairy product expansion did not rest so much on increasing number of cows, but on increased milk yields from cows,Footnote13 chiefly dependent on improved feeding and breeding.
4. Method
The land use changes will be indicated by a series of 7 concepts to be measured.
To indicate to what extent the two-field system had been replaced by a multi-year rotation with fodder cropping, the proportion of meadow to arable land (hectare of meadow per 100 hectares of arable land) is calculated. A full acceptance of ‘modern’ crop rotations, would be indicated by the (more or less) total disappearance of meadowland.
Another indication of the degree to which multi-year crop rotations was accepted is the proportion of arable land registered as fallow, and also the proportion of arable land used for growing grass for hay (ley) and fodder roots. In an archetypical two-field system half the arable land was fallow and there was (practically) no fodder cropping on the arable land. In a fully established seven-year rotation (which was by the early twentieth century most common in the area), 1/7 of the arable land was in fallow, while 3/7 was used for sown ley. The proportion of land used for rye and barley, is expected to have fallen, while the proportion of wheat to rye may have increased so much that the total percentage of land used for wheat actually increased (see below, Section 5).
A switch to a land use following from increased relative demand for dairy products rather than bread grain, can be indicated by the percentage of all land used for grain (wheat, rye, barley, oats and mixed grain), which was used for fodder grains (oats and mixed grain).
Another, more comprehensive indicator of this land use change is the percentage of the arable land that was used for fodder production (fodder grains, wetch, fodder roots, grasses).
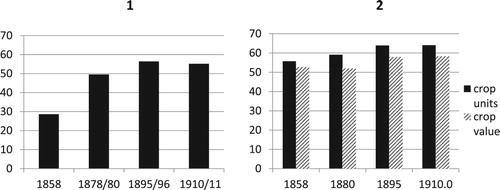
Even more inclusively, we calculate how much fodder was produced (fodder roots, fodder grains, wetch, hay from meadow and arable land spring grain straw), by the use of all kinds of meadow and arable land land (except permanent pasture), in comparison to total harvest including both fodder and crops intended for human consumption (wheat, rye, barley, peas, potatoes). This ‘fodder proportion’ can be indexed using prices for each item but also by employing a concept widely used in early twentieth century Swedish agricultural statistics: crop units.Footnote14 The crop unit was an approximation based on the nutritional content of different products. The following scale has been used: 1 crop unit is made up of 1 kg of wheat, rye, barley, peas or wetch, 1.2 kg of oats, 1.1 kg of mixed grain, 10 kg of fodder roots, 2.5 kg of hay, 3 kg of straw, 3.5 kg of straw from wetch and peas and 4 kg of potatoes.
The number of milk cows per hectare of arable land is counted. The number is expected to rise over time, indicating increased importance of dairy production. Moreover, the quality of cows, in terms of milk yield capacity (and living weight of cows) may be supposed to rise over time. This rise in cow quality ought to be expressed in the price of cows. By multiplying the number of cows with current price of cows (thus supposedly reflecting the average quality of cows a particular year) expressed in rye, the quality of cows is acknowledged and we can talk of an index of ‘cow value’ per hectare of arable land.
The number of draught animals (horses and oxen) is related to the number of milk cows. This is done using the cattle unit concept, according to which one horse is reckoned as 1.5 units, one oxen or cow is reckoned as 1 unit (Gadd, Citation1983, p. 114; Hannerberg, Citation1971, p. 97).Footnote15 The draught animal proportion of the total animal stock is supposed to have been reduced, because of increasing concentration on dairy farming.
In Section 6, these seven measures are calculated and presented on combined parish level for the years 1858, 1878/1880, 1895/96 and 1910/11. Data from Vaksala and Weckholm are merged. In Section 7, the analysis of land use among farms of different size is carried out. In Section 7.1, the above mentioned seven measures are calculated for farms in different size classes within the two parishes in 1878, 1895/96 and 1910/11. ‘Size’ is not an uncontroversial concept, but we follow the tradition within Swedish agricultural statistics and divide the farms into classes based on their acreage of arable land. Naturally the borders between the classes are approximate, but as demonstrated by earlier studies, they are not arbitrary (Djurfeldt, Citation1994, Citation1996; Kuuse, Citation1970; Morell, Citation1997, Citation1998).
We work with four classes: (a) ‘Smallholdings’ of 2–10 hectares of arable land land, signifying farm households which got substantial parts of their incomes from independent farming, but on the one hand had to let members work off-farm to get supplementary incomes and on the other rarely could fully employ its labour force capacity on their own farm; (b) ‘Small peasant farms’ of 10–30 hectares of arable land, signifying farm households which more or less fully relied on farming incomes and were dependent primarily on family (or household) labour,Footnote16; (c) ‘Large peasant farms’, of 30–100 hectares of arable land land, farms of peasant origin, but so large that they regularly had to employ wage labour from outside the family and household to run the farm; and (d) ‘large estates’ with more than 100 hectares of arable land land, fully based on wage labour and with a high degree of internal division of labour. Extreme smallholdings, farms with less than 2 hectares of arable land, ‘cottage units’ run by households, which probably received the major part of their subsistence from other sources than independent farming, have been excluded. On average, farmers in this group held about a third of a hectare of arable land and practically no meadowland. They grew no other grain than rye and very little fodder on their arable land (potato was important here). They had no draught animals and maximum one cow. Often they had a pig, sometimes a couple of sheep. They did not change their market output as a response to price changes, simply because they had nothing to sell (but their own labour). They stand out as semi-subsistence producers, who most likely received their cash income almost exclusively through wage labour. Having clarified that, we leave them out from the further analysis.
In Section 7.2, we test the hypothesis that larger farms introduced fodder cropping on the arable land and redirected their commercial attention towards dairy production earlier than smaller farms, while smaller farms caught up the difference by the early twentieth century, using an OLS model and letting go of the size-classification of farms. Here we also analyse the development in the two parishes separately.
No farm or parish was a closed system. Market integration not only implied that more of output was marketed, but also that more of inputs were bought on markets. A farm could potentially feed many cows, without resorting entirely to home-grown fodder from large acreages. Fodder could be bought from neighbours, from other parishes or from other regions. By the 1880s considerable amounts of fodder were imported, and by the early 1900s there was considerable net imports rather than net exports of oats (cf. ). Fodder imports foremost concerned oil cakes, which were particularly important for dairy production, due to their high content of usable proteins.
Table 1. Net imports to Sweden of oats, maize and oil cakes (ton), number of cows, and imported oil cakes per cow (kg), 1858, 1880, 1895 and 1910.
5. Relative price changes of farm products in Uppsala county 1850–1914
The prices of the major grain types were well correlated. Year-to year fluctuations tended to be large but between 1850 and 1910 the relative price of wheat (more expensive) to rye tended to fall, while the relative price of oats (the most important fodder grain) to rye (the yet most important bread grain) rose (). Therefore, it made sense for farmers to grow more oats (and mixed grain, with oats and barley as the main ingredients) and less rye. The more so, as oats was the least demanding and easiest cultivated grain, thriving well on newly cleared arable land, which tended to be made up of previously wet and probably often insufficiently drained meadows.
Figure 1. Uppsala County 1850–1910. Relative price of wheat and rye and oats and rye. Five year averages, index 1850–54 = 100. Source: Jörberg (Citation1972, p. 2, 358).
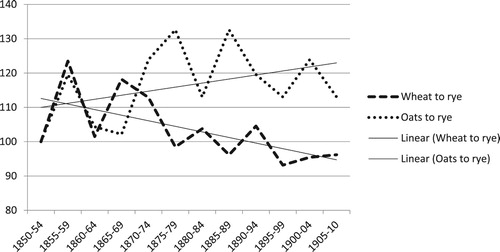
Uppsala County was on the northern limit for wheat and it was riskier to grow wheat than other grains. Nationally and regionally, cultivation of wheat increased at the expense of rye, despite reduced price difference.Footnote17 This was probably thanks to the introduction of higher yielding wheat breeds (Sjöström, 1916). Therefore, the remaining price differentials stemming from increased relative demand for wheat tempted more and more farmers to cultivate more wheat and less rye.
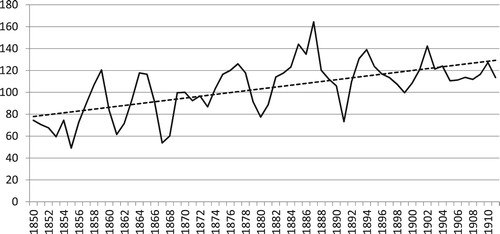
shows a marked increase of the price of butter in relation to the price of rye. In value, one kg of butter corresponded to roughly 50% more rye in the early 1900s, than in the 1850s. This should have induced the farmers to produce more milk, by increasing and improving the cow stocks and by feeding their cows better.
Figure 2. Uppsala County 1850–1911, relative price of butter and rye (butter price per kg/rye price per hl), index, 1870 = 100. Source: Jörberg (Citation1972, p. 1, 143, 146, 333, 336).
6. Land use changes in Vaksala and Weckholm parishes: aggregated parish level
In both parishes the acreage of permanent meadow, was in 1858 about half the acreage of the arable land. By the late 1870s most of this meadowland had been drained, ploughed up and transformed into arable land ((A)). In Vaksala the natural meadow disappeared, while some farmers in Weckholm kept wet meadows on the shore of the lake Mälaren.
Figure 3. Vaksala and Weckholm 1858, 1878/80, 1895/96, 1910/11. hectares of meadows per 100 hectares of arable (A) and percentage of arable used for fallow or grass (hay) (B). Source: Riksarkivet, Äldre kommittébetänkanden 496 Finanskommittén (RA, ÄK 496, FK) vol. 18; Uppsala landsarkiv, Uppsala hushållningssällskap (ULA, ULHS) H1 a, vol. 2.; BiSOS N 1895, 1896, 1910, 1911.
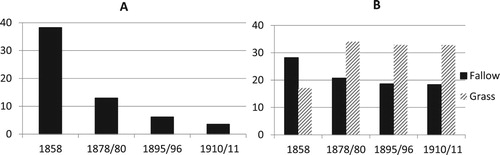
In the material from the financial committee of 1858, it is claimed that 50% of the arable land in Vaksala was in 7-year rotation and 50% in two-field system, while corresponding figures were 27% convertible and 73% two-field in the Weckholm case. For the later years no such information is provided. (B) shows the extent to which the arable land was fallowed and used for sown ley (grass for hay making). If a strict two-field system had been followed generally in the parishes, the amount of fallow should have been 50% of the arable land, while there should have been no ley. With a fully extended seven-year rotation, the amount of fallow should have been 14% (one of seven fields in fallow annually) and the acreage devoted to sown ley should have been 43% (three year leys, or three field out of seven with ley annually). As is shown the percentage of fallow fell from close to 30 in 1858 to below 20 by the end of the period, while the proportion of arable land under grass increased from around 15% of the arable land to close to 35%. More and more land was used in the seven-year rotations while the two-field system was disappearing. Most of the change appeared between 1858 and 1878/80.
The acreage used for grain crops increased by around 20% over the five decades, as the arable land increased (at the cost of the meadow, and as the fallow was reduced). The share of the grain acreage used for the traditional bread grain rye decreased, while the share used for wheat grew. The share used for barley (also basically intended for human consumption) decreased, while the share used for fodder grains, oats and mixed grain (usually a blend of barley, oats and wetch) increased. Most of the changes occurred between 1858 and 1880. After the mid-90s, the situation seems to have stabilised. See appendix, figure A1–A2 and appendix table A1–A3.
Compared to the national average the combined proportion of rye and wheat was larger here. Nationally only 30% of the arable land was devoted to rye and/or wheat in 1910 (Morell, Citation2001, p. 207).
The proportion of arable land used for fodder crops (oats, mixed grain, wetch, fodder roots, and sown grass for hay) grew from circa 30% in 1858, 50% in 1878/80 and around 55% in 1895/96 and 1910/11 (see figure appendix, figure A2 and appendix, table A1–A3). Compared to the national averages it remained low. Nationally about 70% of the arable land was devoted to fodder grain and other fodder crops in 1910 (Morell et al., Citation2011, p. 292).
The amount of potential harvests from all land (arable land and meadow), which resulted in fodder, as percentage of total crop harvests also grew somewhat (see appendix, figure A2). For 1858 the harvest estimated in the investigation by the Financial committee is used. For all other years, the potential harvest is calculated from the proportional land use each year and the hectare yields for each parish in 1895 and 1896 respectively.Footnote18 The fodder share of the total (potential) harvest has been calculated in two alternative ways. Firstly, the fodder harvest’s share of the total (potentially) harvested crop units based on the nutritional contents of each crop (see Section 4 above) has been calculated, secondly the value of each crop measured at current prices is used. As we – apart from 1858, when we realistically count with somewhat smaller hectare yields – use the same yield figures for all years, the variations in the shares from one year to another depend solely on the variation in the proportions of land used for each crops (and in the price based variation of course also on the relative price movements).
As is evident from figure A2 in the appendix, the changes in the proportion of harvest, however measured, are small. Still it is clear than both more nutritional content and crop value from the fields was attributed to fodder crops. This can be interpreted as an (anticipated) switch in land use towards creating input fodder for dairy production.
This shift of concern, cannot, however, be fully made clear from the land use alone. The individual farm could use increasing proportions of labour time on fodder production and animal maintenance. During this very era lots of horse driven field machinery was introduced and spread, foremost perhaps reapers, mowers and threshers (Morell, Citation1997). Obviously the labour productivity of mowing grass for hay was increasing. Yet some surviving farm accounts, show that despite introduction of this labour saving technology, no less labour time was used for haymaking, instead more hay was harvested and it was more carefully dried and stored and thus its quality improved (Morell, Citation2001). Moreover, commercial farmers had, by the late nineteenth century, already started to use imported concentrated fodder, foremost oil cakes. The average amount of oil cakes served per cow in Sweden in 1910 was, according to , 76 kg. It was most certainly surpassed in this quite commercialised farm district close to Stockholm. And while the in-parish produced crop harvest per year and cow did not change much and remained around 2000 crop units per cow, and even tended to fall in the early twentieth century, the adding of say 100 kg of oil cakes per cow, plus molasses and other commercial concentrated fodder elements, would have made a huge difference.
The clearest illustration of the shift of emphasis may be the size and composition of the animal stocks. (A) gives the number of milk cows per hectare of arable land. As the real value of milk cows tended to increase as they were better bred, better fed and gave more milk, the number of cows does not properly indicate the increased importance of the dairy cows. Therefore, the number of cows is weighed by their value as expressed by the current cow price expressed in hectolitres of rye. The weight is transformed to 1 for 1858, and indexed in this way, the value of a milk cow expressed in hectolitres of rye was 1.4 times higher in 1878/80, 1.7 times higher in 1895/96 and 2.3 times higher in 1910/11. Admittedly, using rye as a kind of ‘deflator’ for cow values might exaggerate the increase in cow values, as the relative price of rye tended to fall (cf. above) but comparing cows and rye pinpoint a commercial choice farmers had to make by either marketing bread grain or milk. Furthermore, even in relation to butter prices, the price of cows increased substantially. In 1858 the Uppsala price of a regular cow equalled the value of 32 kg butter. In 1910 it equalled the value of 54 kg butter. This expressed the increasing productivity of cows (Jörberg, Citation1972, p. 1, 245, 247, 333, 336).
Figure 4. Vaksala and Weckholm 1858, 1878/80, 1895/96, 1910/11, milk cows per 100 hectares of arable land, milk cow values per hectare of arable land (A) and draught animal units per 100 milk cows (B). Source: RA ÄK 496, FK vol. 18; ULA, ULHS, H1 a, vol. 2, BiSOS N 1895, 1896, 1910, 1911. Jörberg (Citation1972, p. 1, p. 143, 146, 245, 247).
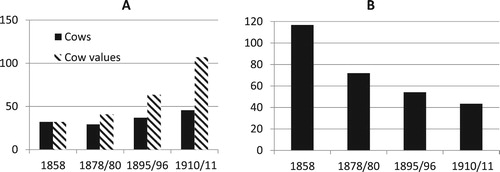
(B), finally, shows the number of draught animal units (1 horse is 1.5 unit, 1 ox is 1 unit) per 100 milk cows.
Presupposing that the quality of draught animals and cows developed similarly, it is clear that the proportion and value of draught animals to cows fell. This underlines the conclusion, that the emphasis of farming and land use in the area shifted from grain production towards dairy production in the late nineteenth century and early twentieth century. It is not clear from the evidence whether the bulk of the change occurred before 1880 or as late as around the turn of the century.
The results so far can be interpreted in three ways. Possibly all (or most) farms had already partly switched to modern crop rotations by 1858 and under influence of the market signals all (or most) farms increasingly fulfilled that switch and a change towards using more land for fodder production by 1880, 1895 and 1910. More likely, however, is perhaps that some farms had switched fully to modern crop rotations by 1858 and that, due to the adaptation to market signals, increasingly many farms did so over the years and also increasing proportions of farms switched to higher emphasis of fodder production. The most realistic alternative is, however, a combination of these two effects: that some farms had partly switched to modern rotations already in 1858, that more farms did so over the years and that many farms increasingly ‘fulfilled’ the switch.Footnote19 It appears likely that there were differences in the strength of the tendency towards shift of land use, between farms.
We shall turn now to see how farmers with varying land resources adapted to the market changes and altered their land use. Are there systematic differences between farms of different size?
7. Land use changes in Vaksala and Weckholm parishes: farms of different size
The farms in Vaksala and Weckholm were, at the three points of time, (1878/80, 1895/96 and 1910/11) classified by size of their arable land acreage as explained in Section 4. In Section 7.1, we will do the analysis of the land use changes of farms of different size year by year rather than by one variable at a time in order to highlight, for each year, the difference between the size groups. In Section 7.2, we will test the hypothesis that larger farms entered animal production before smaller farms, while the smaller later on caught up, using a cross-sectional OLS-model with time-dummies. The reason behind choosing a cross-sectional strategy rather than a traditional panel approach has to do with the historical and geographic context. A majority of the farms in our dataset changed size and/or ownership during the period of study; this circumstance makes it almost impossible to observe the production of a single farm during the period in a meaningful way. Instead we focus on the sizes of farms and estimate the effect of farm size on the dependent variables (percentage of arable land used for fodder, percentage fodder crop units and cows per hectare). Throughout, the very small units of less than 2 hectares of arable land (19 in 1878/80, 12 in 1895/96, 29 in 1910/11) have been disregarded, for reasons discussed in Section 4. Their values are, however, included in the rightmost ‘All units’ column of tables A1–A3 in appendix.
7.1. Land use indicators 1878/80–1910/11
According to the analysis in Section 6 above, the major changes of many variables – suggesting introduction of multi-year crop rotations and switch towards fodder and dairy production – had occurred by 1878/80. Was there a difference between size groups in this respect? We will refer here to table A1–A3 in the appendix, which shows the number of farms, total arable land acreages and average values of a number of land use variables in different size groups (farms of 2–10, 10–30, 30–100 and > 100 ha of arable land) for the three cross sections 1878/80, 1895/96 and 1910/11. The land use indicators used are: ha of meadow per 100 ha of arable land, per cent fallow of arable land, per cent of arable land with sown ley, per cent wheat of all grain, per cent rye of all grain, per cent fodder grain of all grain, fodder harvest as percentage of all harvest, number of cows per 100 ha of arable land, draught animal units per 100 cows, fodder crop units per cattle unit, and percentage of arable land used for fodder. The coefficient of variation around the size group average for the most important variable, the percentage of arable land used for fodder, is also given.
Practically all land use variables suggest that larger farms, had, by 1880, gone further towards modern crop rotations than the smaller farms, and thus indicate that the larger farms had adapted further than the smaller to the market signals, and increased fodder production at the expense of bread grain production. The average proportion of meadow per 100 hectares of arable land and the percentage of fallow was lower in the groups of larger farms than among groups with smaller farms. The larger farms had higher proportions of sown ley and their proportion of fodder grain was higher. All in all, the percentage of their arable land used for fodder production was higher than that of the smaller farms. The larger the farms it seems, the larger the proportions of the total harvests consisted of fodder crops (in this case this is indicated only by the proportion of crop units, not by use of values). The number of cows per hectares of arable land was higher for smaller units, but only for farms up to 10 hectares.Footnote20 Moreover, it is not very clear that the number of draught animals per milk cows differs systematically between size groups. Further, it can be noticed that the amount of fodder (measured in fodder crop units) per cattle unit (or cow) increases as we move from groups of smaller farms to groups of large farms. The proportion of wheat and rye was similar across size groups.
By 1895/ things seem to have evened out somewhat. The proportion of meadows was insignificant now, only a couple of large farms, particularly one large estate in Weckholm, had any substantial meadows. The acreage devoted to fallow had decreased in all size groups and was rather similar between size groups, while the average percentage of sown ley was still distinctly higher among the largest farms. In fact, on average, the proportion of fodder grain was higher in the group with smaller farms. Still, however, the fodder proportion of all crops and the percentage of arable land devoted to fodder was higher on the larger farms.
By 1910/11 no distinct differences in land use related to the size of farms appears.
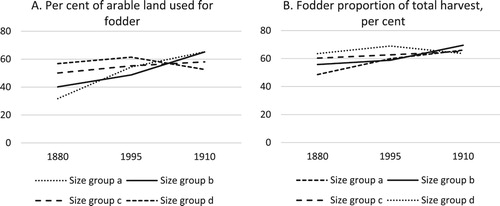
The results, as regards the four most crucial land use indicators, related to farm size are summarised in and . Overall it is indicated that farms in size groups with larger farms, had by 1878/1880, on average, switched to a land use directed to fodder production in much higher degree than farms in size groups with smaller farms had. By 1895/96 and 1910/11 the differences between the average values of the land use indicators in the different size groups were successively evened out.
Figure 5. Change in use of fallow (A) and sown ley (B) by farms in different size groups, Vaksala and Weckholm 1878/80, 1895/96 and 1910/11. Source: ULA, ULHS, H1 a, vol. 2, 19, 20, 33, 34.
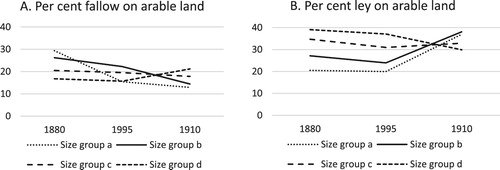
Figure 6. Change in percentage of arable used for fodder (A) and proportion of fodder production (B) by farms in different size groups, Vaksala and Weckholm 1878/80, 1895/96 and 1910/11. Source: ULA, ULHS, H1 a, vol. 2, 19, 20, 33, 34.
The number of farms in some of the size groups are small, however, and as shown by the Coefficients of variation given in the tables A1–A3 in the appendix, the variation around the size group averages of the most principal measure (the proportion of arable land devoted to fodder) is considerable. This makes the conclusions shaky, and calls for more rigorous testing.
7.2. The effects of farm size on land use 1878/80–1910/11 – cross sectional models
The results presented in Section 7.1 indicates that the differences in land use between small and large farms were greatest in 1878/80, which is the reference cross section, and then declined during the later part of the nineteenth century. To estimate the relationship between farm size and share of land used for fodder production and the fodder proportion of all vegetable output, and whether the relationship changed during the period of study we use the following model.Where
is the dependent variable (percentage of arable land used for fodder production or percentage of fodder crop units) for farm i.
is the size of the farm measured in hectares,
is a vector consisting of dummies for each year.
is a dummy variable indicating the parish a farm is located in. Of interest are the coefficients
and the interaction between
and
, since those indicate the effect of farm size on fodder production in the years studied. All coefficients have been estimated using OLS. Farms with no arable land used for fodder production have been excluded from all estimations. The results of the models are presented in below. Interaction plots of the effects are presented in and .Footnote21
Figure 7. The effect of farm size on fodder production (% arable land) in 1878/80, 1895 and 1910/11.
Note: In this and the following figures the shadowed areas depict the confidence intervals.
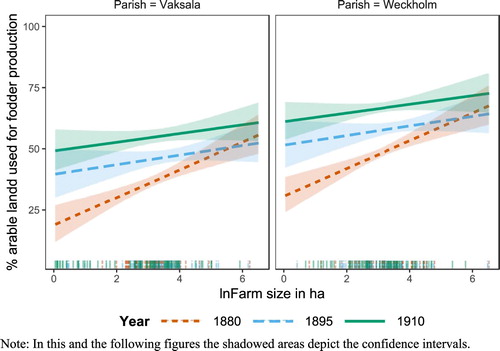
Figure 8. The effect of farm size on fodder production (% fodder producing units) in 1878/80, 1895 and 1910/11
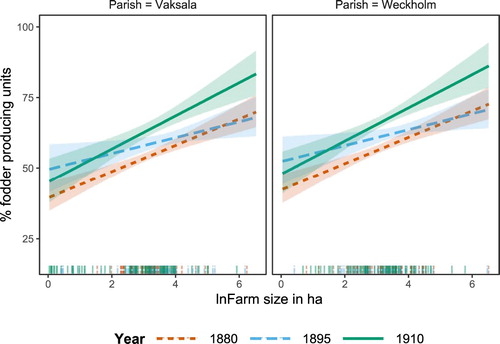
Table 2. OLS estimates of the effect of farm size on fodder production 1878/80–1910/11.
The interpretation is quite straightforward and suggests that a 1% increase in farm size leads to a 0.06 increase in the percentage of land used for fodder production in 1878/80, in 1895 the effect is smaller since a 1% increase in farm size leads to a 0.02 increase in the percentage of land used for fodder production. The effect in 1910/11 is a 0.025 increase in the percentage of land used for fodder production. If the dependent variable is instead measured as percentage fodder units (of total crop units), there seems to be no statistically significant difference in effect size between the years studied. However, in all specifications the coefficient of interest is statistically significant and of approximately the same size. Worth noting is also that Weckholm parish seems to have a slightly higher ratio of land used for fodder production compared with Vaksala parish.
We also tested – using the same model – the relationship between farm size and number of cows per 100 ha of arable land. The relationship, however, looked almost the same in each year observed, with no difference over time. There was a slightly negative slope which suggests that farm size had a negative effect on the number of cows per 100 ha of arable land. This is probably mainly due the inclusion of farms with less than 10 hectares of arable and the indivisibility of cows (Cf. tables A1–A3 in appendix). But it could also indicate the importance of commercial fodder, which could have made dairy farmers less dependent on fodder from their own arable land.
7.3. Land use on small and large farms 1858–1910/11 – summarised results
For 1858, we do not know if land use differed between farms of different size. If quicker and more consistent adaption to market changes was the factor causing larger farms to switch land use system earlier than small farms, the fact that the relevant market change had not yet occurred, might suggest that there was only random difference in land use between farms of different size, or that other factors (topography, soil quality, exact location etc.) caused differences regardless of farm sizes. The clear differences in central aspects of land use between small and large farms in 1878/80, with more fodder cropping, less fallow and more fodder grain on the large farms can be interpreted as indicating that the large farms had already changed rotation system and introduced more fodder cropping, presumably because of the price trends, which were clear by then.
The fact that the differences in these respects remained (with a few exceptions) in 1895/96 but were much evened out, may be interpreted as indicating that some of the smaller farms had by then followed suit, changed rotation, introduced fodder cropping on the arable and engaged in dairy market production. By 1910/11, the differences were totally erased according the classification tables, but remained weakened according to the OLS-testing. The catch up of the smaller farms (within the entire period) mainly occurred in the last two decades of the nineteenth century.
8. Discussion
In the area, two parishes in the vicinity of Uppsala, north of Stockholm, commercial agriculture was until the mid-nineteenth century directed towards sales of grain, foremost rye and barley. Basically a two-field system was used, and most of the winter fodder was collected from separate, permanent natural meadows. By around 1880 this cultivation system was partly replaced by a 6–8-year rotation, dominated by 3–4 years of sown ley, with much fodder grain (oats and mixes of oats, wetch and barley) and much reduced use of fallow. The number of cows per hectare of arable land increased. The quality of cows, in terms of milk yields (indicated by current prices of cows, deflated by the price of rye) increased strongly. By 1895 this change had gone further and by 1910 it was more or less complete. It seems clear that this shift of land use was directly related to the changed market conditions, i.e. the rise of prices of dairy products in relation to grain (although this relation is not formally tested). This development is in no way atypical, it occurred both on county and national level.
With farm level data from the two parishes, it has been possible to determine that there was a difference in tempo of restructuring land use – and consequently adapting to the market changes – between smaller and larger farms. The hypothesis discussed in Section 4 was that larger farms went ahead in changing their land use before smaller peasant farms did so and that smaller farms gradually caught up. Both parts of the hypothesis are supported
Results are fairly evident. The reduction of fallow, the increase of the proportion of the arable land used to produce fodder and fodder’s proportion of all crop production, had by 1878/80 gone much further on large farms than on smaller ones. This is evident from analysis based on a classification of farms in size groups (based on acreages of arable land) and checking for group wise averages of several important variables (or indicators). Regression analysis shows that both the percentage of potential harvests that consisted of fodder and the percentage of the arable land used for fodder cultivation was in each cross section higher, the larger the farm, albeit less in the two later cross sections. The relationship was significant.
By 1895/96 and 1910/11, the differences in land use between the size groups had largely been evened out, the positive relationship between farm size and land use for fodder production was much weakened and remained weak in 1910/11. This goes well with earlier research: For smaller farms to emerge as commercial producers, intensity in operations had to be high. Therefore, it comes as no surprise that the number of cows per hectare is inversely related to farm size. In the Swedish case as in many other cases, commercial smallholders concentrated on intensive dairy and pork production. But in the early twentieth century, these branches of agriculture were the most rewarding ones also for larger enterprises. By 1910/11 dairy production was probably the commercially most important agricultural branch for most farmers in the area, small or large. Improved access to commercial concentrated fodder, a built up network of modern (also cooperative) dairies, expanding nearby towns and cities and access to new technology for initial on-farm processing of milk in moderate scale of operations, probably provided particular opportunities for smaller farmers. It is also possible that while large estates had earlier on been able to invest in high yielding cow breeds, the smaller farmers could have caught up in this respect by around 1910.
Acknowledgements
Thanks for valuable comments are due to Marja Erikson, to participants at the session ‘Specialisation or Diversification? Income strategies of farmers in times of economic downturn’ at the European Social Science History Conference, Belfast, April 2018, organised by Pieter de Graef and chaired by Tim Soens, and to three anonymous referees.
Disclosure statement
No potential conflict of interest was reported by the authors.
Additional information
Funding
Notes
1 Data on the Råby farmstead from primary material to the Vaksala parish Agricultural statistics 1878 and 1910 Uppsala landsarkiv, Uppsala läns hushållningssällskap (ULA, ULHS, H1 a, vol. 2, 33), and from catechetical registers from Vaksala parish (ULA, Vaksala kyrkoarkiv, A I vol. 18, A II a vol. 3), partially used in Morell (Citation2001, p. 322).
2 A classic is Gerschenkron (Citation1989). For Denmark see Henriksen (Citation1993, pp. 153–156); Henriksen (Citation2009, p. 117, 127). Henriksen, Lampe, and Sharp (Citation2012) challenges the view of Denmark as a total free trade exception and points to the importance of early protection for the dairy industry, the growth of which also started earlier than commonly held. Cf. regarding the other major West European exporter, Netherlands, Smits (Citation2009, p. 103).
3 For the Swedish case: Morell (Citation2001, pp. 101–108, 324–331). Cf. Fridlizius (Citation1985); Staffansson (Citation1995).
4 For Denmark Lampe and Sharp (Citation2015) strongly emphasizes the importance of increasing milk yields and also shows larger estates being more efficient than smaller in this respects, although ‘ … this was due to the practices they employed rather than their size per se’ (p. 1146–1147).
5 This was true for a large region around lake Mälaren, particularly in Uppsala County (Sporrong, Citation1985). Cf. for a neighbouring parish, Erikson (Citation2018).
6 BiSOS L, 1862–1910.
7 On the spread of the separator, see Morell (Citation1997) and Kuuse (Citation1970).
8 Lägnert (Citation1955, pp. 27–43) was able to map the spread of different rotations by parish, but he could not map them for individual farms or villages.
9 ULA, Uppsala läns hushållningssällskaps arkiv, H 1 a.
10 Cf. Niskanen (Citation1992).
11 For example in Vaksala parish 1878 (ULA, Uppsala läns hushållningssällskaps arkiv, H 1 a, vol. 2).
12 It would be possible to use individual hamlet enclosure acts form the area from the 1840s and 1850 to pinpoint the proportion of meadow to arable for individual farms. Fodder cropping or choices of grain would however not be visible.
13 Nationally the yield per cow increased from c. 1000 kg per year in 1870, to 1500 kg in 1900 and 2000 kg at the outbreak of the First World War. The number of milk cows increased from c. 1.5 to 1.9 million in the same period, while the production of milk increased from 1.3 to 3.7 million tons. (Morell, Citation2001, p. 259; Morell et al., Citation2011, pp. 297–299).
14 SOS Jordbruk och boskapsskötsel 1913, pp. 30–31 Crop unit (sv. skördeenhet) is a generalisation of what was accepted in 1915 as the Scandinavian fodder unit (Dieckman Rasmussen et al., pp. 314–315), emanating from the nutritional value of 1 kg of barley. In the Swedish statistics it was used as a weight for all kind of vegetable agricultural output, in order to be able to arrive at a common figure for the total harvest.
15 One could also consider the amount of draught animals, expressed in cattle units in proportion to ‘production animals’ (sheep, cows, swine etc.) expressed in cattle units, but we concentrate on the dairy cows.
16 This is Djurfeldt’s ’notional family farm’ (Djurfeldt, Citation1996).
17 National figures are available in Morell et al. (Citation2011, p. 292). While in the late 1860s 2.3 % of arable land (excluding fallow) was used for wheat and 16.8 % for rye, the proportions were 4.0 and 10.5 % at the outbreak of the First World War and 8.2 and 6.4 % by the early 1930s.
18 For meadow hay and hay from arable, the harvest of which varied wildly for one year to another, the average Uppsala County hectare yields from 1894–1900 is used.
19 The shift to modern rotations could well be gradual also on individual farms. For example, a farm might use the old two field rotation on the old arable used mostly for rye (wheat) and barley, but a more complex one on newly ploughed up meadows, where fodder grain could be alternated by multiple years of ley. For a brief period then, individual farms could use different crop rotations on different parts of their land. Eventually, however, these multiple rotations ‘melted’ together into one system. See Morell (Citation2001, p. 200).
20 We do not use the calculated ‘cow values’ here, as we have no clear indication of how the quality of cows varied among farms. It is likely, however, that large estates, with large financial resources and educated staff, systematically held cows with higher milk yields, than smaller farms.
21 All farms cultivation less than 2 hectares of arable has been excluded. Further, all farms with no fodder production has been excluded and finally one class 2 unit have a missing value for proportion of fodder to crop units, so that the number of observations is one less when using that variable.
References
- Aparicio, G., Pinilla, V., & Serrano, R. (2009). Europe and the international trade in agricultural and food products, 1870–2000. In P. Lains & V. Pinilla (Eds.), Agriculture and economic development in Europe since 1870 (pp. 52–75). Abingdon: Routledge.
- Arenander, E. O. (1916). Nötboskapsskötseln. In S. Bring & A. Sjöström (Eds.), Uppsala Kungl. Hushållningssällskap 1815–1915, II. De särskilda näringsgrenarnas utveckling och nuvarande ståndpunkt (pp. 139–222). Uppsala: Almqvist & Wiksell.
- Bring, S. (1915). Uppsala läns hushållningssällskap 1815–1915, I. Uppsala: Almqvist & Wiksell.
- Chayanov, A. V. (1986). The theory of the peasant economy. Madison: University of Wisconsin Press.
- Cooley, T. F., & DeCanio, S. J. (1977). Rational expectations in American agriculture, 1867–1914. The Review of Economics and Statistics, 59(1), 9–17. doi: 10.2307/1924899
- Dieckmann Rasmussen, J., Jensen, S. P., Bjørn, C., & Christensen, J. (1988). 1860–1914. In C. Bjørn (Ed.), Det danske landbrugs historie III (pp. 193–410). Odense: Landbohistorisk Selskab.
- Djurfeldt, G. (1981). What happened to the Agrarian Bourgeoisie and rural proletariat under monopoly capitalism? Some hypotheses derived from the classics of Marxism on the Agrarian question. Acta Sociologica, 24(3), 167–191. doi: 10.1177/000169938102400303
- Djurfeldt, G. (1994). Gods och gårdar. Jordbruket ur sociologiskt perspektiv. Lund: Arkiv.
- Djurfeldt, G. (1996). Defining and operationalizing family farming from a sociological perspective. Sociologia Ruralis, 36(3), 340–351. doi: 10.1111/j.1467-9523.1996.tb00026.x
- Erikson, M. (2018). Krediter i nöd och lust. Skattebönder i Torstuna härad, västmanlands län, 1770–1870. Uppsala: Uppsala University Library.
- Fridlizius, G. (1957). Swedish corn export in the free trade era: Patterns in the oats trade 1850–1880. Lund: Gleerup.
- Fridlizius, G. (1985). Från spannmålstunnor till smördrittlar. In O. Bjurling (Ed.), Malmö stads historia, IV (1870–1914) (pp. 395–522). Malmö: Malmö stad.
- Friedmann, H. (1978). World market, state and family farm: Social bases of household production in the era of wage labour. Comparative Studies in Society and History, 20(4), 545–586. doi: 10.1017/S001041750001255X
- Gadd, C.-J. (1983). Järn och potatis. Jordbruk, teknik och social omvandling i Skaraborgs län 1750–1860. Göteborg: Göteborgs universitet.
- Gerschenkron, A. (1989 [1943]). Bread and democracy in Germany. Ithaca and London: Cornell University Press.
- Grigg, D. (1992). The transformation of agriculture in the west. Oxford: Blackwell.
- Hannerberg, D. (1971). Svenskt agrarsamhälle under 1200 år. Stockholm: Läromedelsförlaget.
- Hayami, Y., & Ruttan, V. W. (1971). Agricultural development: An international perspective. Baltimore: The John Hopkins Press.
- Henriksen, I. (1993). The transformation of Danish agriculture 1870–1914. In K. G. Persson (Ed.), The economic development of Denmark and Norway since 1870 (pp. 153–178). Aldershot: Edward Elgar.
- Henriksen, I. (2009). The contribution of agriculture to economic growth in Denmark, 1870–1939. In P. Lains & V. Pinilla (Eds.), Agriculture and economic development in Europe since 1870 (pp. 117–147). Abingdon: Routledge.
- Henriksen, I., Lampe, M., & Sharp, P. (2012). The strange birth of liberal Denmark: Danish trade protection and the growth of the dairy industry since the mid-nineteenth century. The Economic History Review, 65(2), 770–788. doi: 10.1111/j.1468-0289.2010.00595.x
- Hussain, A., & Tribe, K. (Eds.). (1984). Paths of development in capitalist agriculture: Readings from German social democracy, 1891–99. London: Palgrave Macmillan.
- Israelsson, C. (2005). Kor och människor: Nötkreatursskötsel och besättningsstorlekar på torp och herrgårdar 1850–1914. Hedemora: Gidlund.
- Jensen, P. S., Lampe, M., Sharp, P., & Skovsgaard, C. V. (2018). “Getting to Denmark”: The role of elites for development. EHES Working Paper in Economic History, 125, 1–46.
- Jörberg, L. (1972). A history of prices in Sweden 1732–1914 1-2. Lund: Gleerup.
- Köll, A.-M. (1983). Tradition och reform in västra Södermanlands jordbruk 1810–1890. Agrar teknik i kapitalismens inledningsskede. Stockholm: Almqvist & Wiksell.
- Kuuse, J. (1970). Från redskap till maskiner. Mekaniseringsspridning och kommersialisering inom svenskt jordbruk 1860–1910. Göteborg: Göteborgs universitet.
- Kuuse, J. (1977). Havrens inre avsättning 1880–1915. In Ekonomisk-historiska studier tillägnade Artur Attman (pp. 69–94). Göteborg: Ekonomisk-historiska institutionen, Göteborgs universitet.
- Lägnert, F. (1955). Syd- och mellansvenska växtföljder I. De äldre brukningssystemens upplösning under 1800-talet. Lund: Gleerup.
- Lampe, M., & Sharp, P. (2015). Just add milk: A productivity analysis of the revolutionary changes in nineteenth-century Danish dairying. The Economic History Review, 68(4), 1132–1153. doi: 10.1111/ehr.12093
- Morell, M. (1997). Family farms and Agrarian mechanization in Sweden before World War II. In L. Jonung & R. Olsson (Eds.), The economic development of Sweden since 1870 (pp. 67–86). Aldershot: Edward Elgar.
- Morell, M. (1998). Småbruken och deras jordbruksproduktion under 1910-talet och Mellankrigstiden. Bebyggelsehistorisk tidskrift, 35, 75–90.
- Morell, M. (2001). Jordbruket i industrisamhället 1870–1945. Det svenska jordbrukets historia IV. Stockholm: Natur & Kultur/LT.
- Morell, M. (2011a). Agriculture in industrial society, 1870–1945. In J. Myrdal & M. Morell (Eds.), The agrarian history of Sweden from 4000 BC to AD 2000 (pp. 165–213). Lund: Nordic Academic Press.
- Morell, M. (2011b). Den agrara ingenjörskonsten. In A. Björnsson, & L. Magnusson (Eds.), Jordpäron, Ekonomihistorisk läsebok (pp. 445–471). Stockholm: Atlantis.
- Morell, M., Gadd, C.-J., & Myrdal, J. (2011). Statistical appendix. In J. Myrdal, & M. Morell (Eds.), The agrarian history of Sweden from 4000 BC to AD 2000 (pp. 285–301). Lund: Nordic Academic Press.
- Myrdal, G. (1933). The cost of living in Sweden 1830–1930. London: P. S. King & son.
- Niskanen, K. (1992). Då mjölken blev lönsam – ett agrart hantverk växer till en industri. Exemplet Södermanland. In B. Larsson (Ed.), Bonden i dikt och verklighet (pp. 37–61). Stockholm: KSLA/Nordiska museet.
- Niskanen, K. (1995). Godsägare, småbrukare och jordbrukets modernisering. Södermanlands län 1875–1935. Stockholm: Almqvist & Wiksell.
- O’Rourke, K. H. (1997). The European grain invasion, 1870–1913. The Journal of Economic History, 57(4), 775–801. doi: 10.1017/S0022050700019537
- Peterson, G. (1989). Jordbrukets omvandling i västra Östergötland 1810–1890. Stockholm: Almqvist & Wiksell.
- Sjöström, A. (1916). Det egentliga jordbruket. In S. Bring & A. Sjöström (Eds.), Uppsala Kungl. Hushållningssällskap 1815-1915, II. De särskilda näringsgrenarnas utveckling och nuvarande ståndpunkt (pp. 30–110). Uppsala: Almqvist &Wiksell.
- Smits, J.-P. (2009). Technological change, institutional development and economic growth in Dutch agriculture, 1870–1939. In P. Lains, & V. Pinilla (Eds.), Agriculture and economic development in Europe since 1870 (pp. 97–116). Abingdon: Routledge.
- Söderberg, J. (1984). A long term perspective of regional economic development in Sweden, Ca. 1550–1914. Scandinavian Economic History Review, 32(1), 1–16. doi: 10.1080/03585522.1984.10408020
- Sporrong, U. (1985). Mälarbygd. Agrar bebyggelse och odling ur ett historiskt-geografiskt perspektiv. Stockholm: Kulturgeografiska institutionen, Stockholms universitet.
- Staffansson, J-Å. (1995). Svenskt smör. Produktion, konsumtion, utrikeshandel 1861–1913. Lund: Lund University Press.
- Svensson, J. (1965). Jordbruk och depression 1870–1900. En kritik av statistikens utvecklingsbild. Lund: Cavefors.
Appendix
Figure A1. Vaksala and Weckholm, 1858, 1878/80, 1895/96, 1910/11, percentage of grain acreage used for different grains (1) and hectares of arable land used for fodder grain per 100 hectares of arable land used for bread grain (2). Source: RA ÄK 496, FK vol. 18; ULA, ULHS, H1 a, vol. 2; BiSOS N 1895, 1896, 1910, 1911.
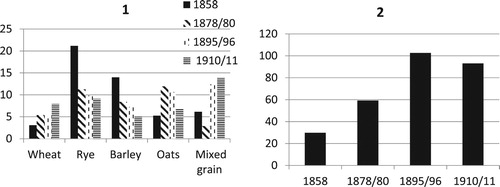
Figure A2. Vaksala and Weckholm 1858, 1878/80, 1895/96, 1910/11, share of arable land used for fodder crops (1) and fodder proportion of harvested crops (2), per cent. Source: RA ÄK 496, FK vol. 18; ULA, ULHS, H 1 a, vol. 2, BiSOS N 1895, 1896, 1910, 1911. Prices from Myrdal (Citation1933), (potatoes, peas) and Jörberg (Citation1972, p. 1) (all other crop prices).