
 ?Mathematical formulae have been encoded as MathML and are displayed in this HTML version using MathJax in order to improve their display. Uncheck the box to turn MathJax off. This feature requires Javascript. Click on a formula to zoom.
ABSTRACT
In 2020, The COVID-19 crisis has put great pressure on the economy worldwide. Only time can tell whether the COVID-19 crisis will have permanent effects on corporate and household behaviour and how it will affect society at large. This article examines historical experiences of how households managed the financial consequences of rising mortality during the 1918 influenza pandemic. We find that the previous pandemic led to an immediate and major increase in primarily small-sum industrial life insurance policies designed for blue-collar workers. The increase in new policies did not, however, have a lasting effect. By the time the pandemic had faded, the number of policies had dropped to below pre-pandemic conditions. This historical experience underlines the fact that there are limits to the extent to which even a major shock, such as a pandemic, can lead to behavioural change among households as currently being predicted in relation to COVID-19.
1. Introduction
In spring 2020, COVID-19 caused high mortality rates and put great pressure on the economy worldwide as a result of societal lockdowns. Directives such as social distancing and travel restrictions have led to changes in households’ consumption behaviour, resulting in rising unemployment rates, even in sectors previously characterised by high labour demand. In Sweden, changes in perceived risk have led, among other things, to a change in insurance behaviour and increased demand for, e.g. unemployment insurance among groups that previously have not prioritised insurance. Questions have been raised as to whether or not this changed behaviour of individuals and households will be permanent. Will the COVID-19 crisis have, or not have, an enduring effect on people’s risk strategies?
The present paper seeks to see the current situation in an historical perspective by investigating household insurance behaviour during the 1918 global influenza pandemic, asking whether new risk strategies had an enduring effect even after the pandemic had faded. The influenza was being transmitted around the world in the end of WWI, it is therefore hard to isolate the effects of the pandemic on household risk strategies from other war-related events, especially for countries heavily affected by the war. For this purpose, the focus of this paper is Sweden, which was neutral during WWI and less affected by the war compared to many other countries at the time of the influenza pandemic.
Historians and economic historians have scrutinised different aspects of the influenza, such as witness accounts (Arnold, Citation2018), global perspectives and the effect of the influenza on world events (Spinney, Citation2017). Others have explained different mortality patterns (Almond, Citation2006; Barry, Citation2004a; Bengtsson, Dribe, & Eriksson, Citation2018; Brown, Citation2018; Kolata, Citation2000; Clay, Lewis, & Severnini, Citation2018). Concerning the economic impact of the 1918 influenza, most previous studies have found short-term aggregated effects (Barro, Ursúa, & Weng, Citation2020; Brainerd & Siegler, Citation2003; Dahl, Hansen, & Jensen, Citation2020; Garrett, Citation2009; Velde, Citation2020). A few studies looking at more disaggregated data have shown persistent effects on health, educational attainment and productivity (Almond, Citation2006; Almond & Mazumder, Citation2005; Guimbeau, Menon, & Musacchio, Citation2019).
Previous Swedish research on the 1918 pandemic has investigated how politics and demography affected the impact of the pandemic in a Swedish context (Åman, Citation1990). More recent research has shown that the pandemic contributed to increased poverty expenditure and reduced capital income, but left wages unaffected (Karlsson, Nilsson, & Pichler, Citation2014). Demographic research has further demonstrated that the pandemic had not only short-, but also long-term effects on longevity (Helgertz & Bengtsson, Citation2019). Despite the contributions of previous research in illuminating different aspects of the 1918 pandemic, few studies have focused on how households responded to the increased risk and the costs related to the premature death of a family member or/and breadwinner following the influenza outbreak.
To insure the financial consequences of the premature death of especially breadwinners became a growing industry in Sweden already during the second half of the nineteenth century. At the time of the 1918 influenza pandemic, life insurance had evolved to become one of the most diffused financial vehicles used to compensate for the unexpected loss of wage labour income, amounting to close to 1 million policies in 1918 among a population (16–65 years of age) of 3.5 million (Andersson, Eriksson, & Lindmark, Citation2010). The Swedish insurance industry refers to the period of the pandemic as the worst the industry had ever encountered due to the increase in claims. Today, as regards grading catastrophic risks, pandemics arising from influenza are still claimed to be the most substantial threat to the life insurance industry, owing to their ability to cause a major increase in claims (Huynh, Bruhn, & Browne, Citation2013). Despite this, there are few studies on the impact of pandemics on the supply and demand of life insurance.
In the present article, we investigate how the 1918 pandemic affected the financial aspects of households’ risk strategies by examining life insurance savings based on the following three questions; (i) Did the number of life insurance policies increase during the pandemic? (ii) Did the composition of life insurance policies change during the pandemic? (iii) If the pandemic affected life insurance savings, were the effects permanent or temporary? As households’ insurance behaviour was dependent on the business practices adopted by the industry, we additionally ask: Did the life insurers impose new restrictions, new tariffs or other new business practices to influence household insurance behaviour during the pandemic? In addressing these issues, we start out with a brief account of the 1918 pandemic in Sweden in Section 2. Sections 3 and 4 outline the development of the life insurance business before and in response to the pandemic. Household responses are outlined in Section 5 and analysed in Sections 6 and 7. Section 8 concludes the article.
2. The 1918 pandemic and providing for dependents
Almost exactly 100 years ago, people in Sweden and around the world began to see the end of a flu that was significantly more deadly than COVID-19. In only 4 months, the 1918 pandemic had spread across the world, harvesting an estimated 50–100 million lives (Arnold, Citation2018). In Sweden, more than 37,000 people died. The age profile of mortality during the pandemic was W-shaped – i.e. it claimed masses of lives among the very young, young adults, and the very old. The greatest increase in mortality rate (excess mortality) was concentrated among young adults between 20 and 40 years of age (Åman, Citation1990). The age-specific mortality patterns and the high incidence of severe pneumonias characterising the 1918 influenza are still not entirely understood (Taubenberger & Morens, Citation2019).
The first report of a new influenza, which was attributed to the 1918 pandemic, came from the US, but the origin of the virus has been debated in the medical and historical research. Several sites of pandemic origin have been suggested, including Étaples, France (Oxford et al., Citation2002), China (Shortridge, Citation1999), and Camp Funston/Haskell Kansas (Barry, Citation2004b). Researchers do agree, however, that the disease spread effectively throughout the world because of the crowded living situation of soldiers and troop movements at the end of the First World War (Arnold, Citation2018). Censorship of the war meant that reports on the progress of the 1918 pandemic were delayed, and initially there were both reassuring and alarming media reports on influenza mortality. In July 1918, the influenza began to spread in southern Sweden, and in only a few weeks the disease was found in many areas. During the summer, newspapers had been able to report on each individual death, but in the fall, only figures were presented. In her dissertation, Margareta Åman (Citation1990) further shows that the media reporting on the 1918 pandemic disappeared among the reporting on other political events related to the First World War, such as food shortages and riots. The period was also characterised by demands for universal suffrage and the threat of a socialist revolution. This, and the general lack of readiness for a pandemic such as the 1918 influenza, meant that measures to reduce the spread of infection were not put in place until high mortality figures had been reached. Only then was access to public institutions such as schools, cinemas and restaurants restricted. In the fall, more specifically in October and November, the disaster peaked in Sweden and other parts of the world (Arnold, Citation2018; Åman, Citation1990). It is believed that the virus spread to all major populations of the world within 10 months; however, this pattern was not general among all countries. For example, Australia postponed the outbreak until early 1919 and experienced a single, although longer, wave of infection (Johnson & Mueller, Citation2002).
Witness accounts describe the 1918 influenza as more terrifying than the First World War, as the course of death meant that individuals in the prime of their life were dying within only a few days (Arnold, Citation2018; Åman, Citation1990). The 1918 pandemic implied severe consequences for many families. The increase in mortality rate was especially high in the age range 20–40 years, a time in life when many had started a family and had small children to support (Johnson & Mueller, Citation2002). According to the aggregated excess mortality figure, the pandemic caused (1918–1920) an estimated excess mortality of 37,537 deceased or 6.4 deaths per 1000 inhabitants (Åman, Citation1990). Defined by age, more than 20,000 individuals in that age range (20–40) died during the influenza between 1918 and 1921. Many of them (80%) died during the peak in the fall of 1918 (Statistics Sweden, [SCB], Citation1923). However, many rural areas of Sweden were undeveloped and lacked proper communication, which is why the spread of the virus travelled relatively slowly and the pandemic threatened the Swedish population into the 1920s. One of the last outbreaks also became one of the most severe. In 1920, a municipality in northernmost Sweden (Arjeplog) was hit by the pandemic, and 3 per cent of the population succumbed to the virus, indicating that the pandemic still was a real threat (Åman, Citation1990).
shows excess mortality by age, cause and insurer from January 1918 to December 1920. For the entire population, the monthly death figure (due to the influenza) peaked at 183 dead per 100,000 inhabitants in October 1918 (SCB, Citation1923). Present-day figures on COVID-19 mortality show a total in Sweden, accumulated, amount of 60 dead per 100,000 by September 2020 (Roser, Ritchie, Ortiz-Ospina, & Hasell, Citation2020).
Figure 1. Excess mortality and growth in mortality rate during the 1918 pandemic. Source: Statistiska Centralbyrån (SCB) Citation1922, Citation1923, Citation1924, Citation1925) and Gjallarhornet (Citation1919).
Note: Excess mortality is defined as the above pre-pandemic (1917) monthly mortality rate per 100 000 inhabitants. The cause defined includes excess mortality in influenza and respiratory diseases. The estimate equal in total 39,910 deceased. The age defined included the excess mortality from previous years including the age group with 15% higher excess mortality rate. The estimate equal in total 37,384 deceased. The company defined includes 17 life insurance companies reporting specifically on mortality by causes during the pandemic. The figures show the average excess mortality per 100 000 policy holders due to the pandemic in 1918. The growth in mortality rate is the monthly mortality rate per 100 000 divided by same month in 1917. The ‘low’ risk group is all age-classes below 100% increase at maximum, the ‘medium’ below 500%, and the ‘high’ above 500%.
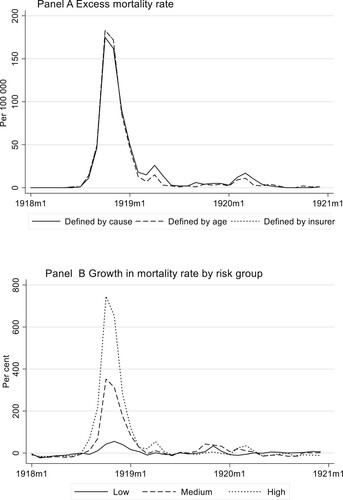
The risk exposure for the 1918 Pandemic H1N1 virus differed substantially by age. For age groups most risk exposed (15–45), the growth in monthly mortality rate peaked at 700 per cent (compared to the pre-pandemic mortality rate). For younger individuals (2–15) and the middle aged (45–50), the increase in mortality rate peaked at some 370 per cent. Among the older, who seemingly stood a better chance of avoiding infection, the mortality rate went up by 50 per cent compared to the monthly pre-pandemic rate (SCB, Citation1922, Citation1923). Recent demographic research on mortality patterns in the Swedish context shows fairly similar figures for men and women (on average), but relatively higher excess mortality among low-skilled male manual workers, especially compared to (the least affected) farmers (Bengtsson et al., Citation2018).
At the beginning of the twentieth century, the absence of a breadwinner could have drastic consequences for dependents without social protection networks. Moreover, the sudden death of any family member incurred a cost for funeral expenses to assure the diseased a proper funeral (Eriksson, Citation2010). Turning to the community for poor relief was perceived as stigmatising (Junestav, Citation2004). This implied that life insurance became one of the most important financial services, not least for working-class households in the growing cities during the period. Concerning the working population, it was even more common to purchase life insurance than to be a member of a sickness insurance fund (Sociala meddeladen, Citation1919; Försäkringsinspektionen, Citation1919). In 1917, close to one million life insurance policies were in force in Sweden.
The dominance of life insurance as a form of savings in the early 1900s indicates that the working population considered it more essential to insure against the economic consequences of premature death than against illness. Given that, as a result of the 1918 influenza, the mortality risk increased especially in younger people of working age, one could expect a stronger demand for life insurance among this group. Because the death of a breadwinner, in particular, resulted in social and economic vulnerability for dependents, higher mortality risk created stronger incentives to get insurance.
The argument goes back to the life-cycle hypothesis, which holds that individuals seek to smooth out consumption over their lifetime, to ensure that their standard of living is reasonably levelled out across the different stages of life (Attanasio, Banks, Meghir, & Weber, Citation1999). For dependents provided for by breadwinners, life insurance serves as a protection by levelling out the standard of living reasonably well, even in the event of a breadwinner’s premature death. In that regard, life insurance is required by the dependents if they are to realise a steady income flow throughout life despite the breadwinner’s demise. In line with Lewis’ (Citation1989) argument that life insurance should be viewed from the perspective of the beneficiaries, where life insurance is purchased to maximise the dependents’ utility, we consider dependents increased financial vulnerability during the pandemic to be an incentive to insure.
An additional incentive to insure would emerge if the pricing of age-specific risk remained unchanged in the insurance contract, at the same time as the risk of premature death increased during the pandemic. Unless the insurers adjust the pricing of risk, the immediate effect of the increased mortality rate would not only lower the cost of purchasing life insurance in relation to perceived risk, but also reduce the bonus/dividends for incumbents/owners, as returns on investments would be needed to cover for excess mortality. Considering the distribution of costs and risk, the most beneficial would be that of male breadwinners aged 20–35 performing low-skilled manual work, insured their lives (see Bengtsson et al., Citation2018). If priced for the average risk of pre-pandemic tariffs, the entry of a young individual as a life insurance policyholder would allow a substantial redistribution of the accumulated savings from the incumbents. Hence, the under-pricing of excess mortality risk, as such, would create an incentive to insure, especially among young adults.
3. The development of life insurance
In Sweden, life insurance developed in the second half of the nineteenth century as a financial protection vehicle for the middle- and upper classes, in the event of a breadwinner’s or other family member’s premature death. The first domestic life insurance company, Skandia, was established in 1855. Skandia was a stock company that underwrote both fire and life insurance to high actuarial standards at the time. Skandia was followed by other joint-stock companies that supplied life insurance policies sufficient to protect the standards of living of households more affluent than ordinary working-class families (Bergander, Citation1967, p. 302). All policies were issued with a medical examination and quarterly or annual payments, not always suitable for the working classes who primarily were paid weekly.
At the turn of the twentieth century, the market for life insurance underwent massive changes. The industrialisation process changed the social and economic structures for insuring. The growing wages of the working classes occupied in the manufacturing and service sectors demanded broader and more inclusive financial protection. As a latecomer, Sweden was largely influenced by the financial development already underway among its forerunners. Life insurance companies whose aim was to insure the working classes, so-called industrial life insurance companies, first emerged in Britain (Prudential) and the US (Prudential Friendly Society) in the second half of the nineteenth century. Industrial life insurance companies issued smaller policies than did ordinary life insurance companies, without medical examination and with premiums payable weekly, collected at the policyholder’s place of residence by a life insurance agent. This system facilitated both the purchase of insurance and the premium payment for groups living in rural areas as well (Eriksson, Citation2010).
Massive growth in the supply of domestic industrial life insurers took off during the first decades of the twentieth century. The first Swedish life insurance company to successfully insure the wage working class was Trygg (Safe), established in 1899, followed by three other companies: De Förenade (The United) in 1902, Framtiden (The Future) in 1911 and Folket (The People) in 1914. Swedish industrial life insurance modelled its canvassing organisation on its British forerunner, Prudential.
By the time of the influenza pandemic in 1918, the life insurance business was based on the underwriting of 22 companies, of which 5 were industrial life insurers. Accounts on the insurance stock show that industrial life kept 56 per cent of all policies in force, but only 27 per cent of the amount (value) of the sum insured (Försäkringsinspektionen, Citation1920). One of the reasons for the large stock of policies (in numbers) was the many small policies required by the growing wage working class (Andersson et al., Citation2010). Another was the business practices.
The collection of weekly premiums and selling of policies required a comprehensive agent organisation. The agents worked on commission and made a profit on every sale as well as on the collection of premiums. The growth of Swedish life insurance, as measured by the number of policies sold, increased rapidly with the establishment of industrial life insurance companies at the turn of the twentieth century, and Trygg became the largest insurance company both in terms of number of policies issued and sums assured. In contrast to ordinary life insurance companies, women came to be as frequent policyholders as men (Eriksson, Citation2014).
Life insurers had to consider the issue of information asymmetry. In industrial life insurance that practised without formal medical examinations, there was a risk that unhealthy individuals, by virtue of their shorter life expectancy, would be more likely to get insurance. To mitigate the risk of adverse selection, industrial insurers commonly stipulated an up to two-year waiting period for suicides and chronic diseases in the policy contract to avoid adverse selection (Eriksson, Citation2011). By underwriting standardised contracts, policies could be widely diffused and within reach even for the less well-to-do households.
Industrial life insurance was initially criticised. Many workers had small and fluctuating incomes that made it hard to maintain premium payments in times of economic hardship, which led to high policy lapse rates (voluntarily cancelling a policy before the contract had terminated). The administration surrounding the canvassing system also invoked higher administrative costs in relation to ordinary life insurance, leading to more costly insurance (Adams et al., Citation2020). However, because previous attempts made by ordinary life insurance companies to reach the working classes had failed, representatives of the insurance industry viewed the costs related to industrial life insurance as inevitable and as a condition for insuring the working population. Hence, the choice was between a cheap insurance that few would buy and an expensive insurance that would be widely diffused (Försäkringsföreningens tidskrift, Citation1911, p. 114).
Against this backdrop, the 1918 influenza pandemic imposed a number of conflicting targets. On the one hand, insurers for obvious reasons had fewer incentives to underwrite excess risks above actuarial fair prices. To counteract the negative financial consequences of excess mortality during the pandemic, life insurers could respond by charging a higher premium rate to compensate for excessive mortality during the pandemic or, more easily, impose quantitative restrictions, either by restricting entry as such or by limiting benefits to new policyholders using measures such as a waiting time, an exception for specific causes of death, etc. On the other hand, one could argue that life insurers might perceive the loss due to excess mortality during the pandemic as acceptable if a permanent increase in life insurance savings followed the pandemic. For industrial insurers, with a large stock of potential new policyholders among the many uninsured blue-collar workers, a short-term loss could potentially provide a long-term return with a larger stock of insured.
To address the commercial aspects faced by the industry during the pandemic, the following section will trace the responses of the insurance companies during a pandemic. In focus here are the potential changes in business practices, such as imposing new restrictions, new tariffs or other measures to influence purchases of insurance during the pandemic.
4. The life insurance industry during the pandemic
In 1919, Svenska Försäkringsföreningen (FFT) [The Swedish Insurance Association]Footnote1 presented experiences regarding the effect of the pandemic so far. One of the chapters in their annual journal was called: ‘Some data on the ravages caused by the influenza pandemic among those with life insurance in Sweden’ (FFT, Citation2011, pp. 30–40). The chapter started out by describing the pandemic as ‘[…] the most strenuous and severe strain the life insurance industry had ever encountered’ (FFT, Citation2011, p. 30). The journal reported that the death rates among the insured in the largest life insurance company Trygg revealed a fivefold increase in October 1918 compared to October the previous year. The industry’s own calculations showed that the loss due to pandemic deaths during one-third of 1918 constituted the profit of an ordinarily year’s operation. Svenska Försäkringsföreningen calculated that if the worst of the pandemic mortality was over, the life insurance industry would be capable of handling the loss. It should be noted that, at this point in time, the business representative recognised that the pandemic was far from over. Svenska Försäkringsföreningen predicted that the forthcoming year would be strenuous as well. They had noticed that the pandemic came in waves, and that it was therefore difficult to assess whether the influenza outbreaks had come to an end.
Age-specific mortality was also discussed. A Danish study showed that excess mortality declined with age and was practically zero at 60 and above. The investigation further showed that the highest death rates were among the age group 20–29, hence, ‘[…] the pandemic harvested lives among the group that were usually viewed as a good risk’ (FFT, Citation2011, p. 32). Although this picture had been verified by other observations, the industry still argued that more information was needed to truly verify these accounts.
In 1919, Svenska Försäkringsföreningen noted that the life insurance companies had managed to fulfil their duties despite the thousands and thousands of claims due to what was named the ‘Spanish flu’. Although it was hazardous from an economic point of view, the life insurance companies had held their doors wide open for and welcomed the seemingly endless stream of new policyholders. From a strictly economic point of view, it would have been wiser to wait out the pandemic before issuing new policies. With that in mind, Svenska Försäkringsföreningen noted that the life insurance companies had a long-term view on their business and wrote: ‘Thankfully, our life insurance companies have focused not only on the next couple of years; their goal is to fulfil the justified demands of the insured and the public’s demand for insurance’ (FFT, 1919, p. 39). To tackle the high mortality among policyholders, Svenska Försäkringsföreningen instead recommended that the life insurance companies largely reduce or totally cancel the dividends and bonuses to the owners and the policyholders. The largest insurer, the industrial life insurance company Trygg, cancelled dividends entirely. Trygg was most severely affected financially by the excess mortality, but at the same time also by the company that had issued most life insurance policies during the pandemic (Gjallarhornet, Citation1919). Hence, the life insurance industry reacted to the consequences of the influenza, but not by deteriorating policyholders’ contract terms.Footnote2 After scrutinising the business press and insurance prospects, we find no compelling evidence that life insurers adjusted price or contract terms during the 1918 influenza pandemic (FFT, 1919; Gjallarhornet, Citation1919; Sjöberg, Citation1925; Viktoria Minnesskrift, Citation1972).
Given the rather limited data on new policies issued that was available at the time, contemporaries perceived that the industrial life insurance companies benefited most from the increase in insurance demand. In response to this perception, the insurance trade magazine, Gjallarhornet, put high expectations on the potentially signalling effect of the pandemic. It was though that the pandemic could open people’s eyes to the benefit of life insurance and that the effect would be persistent post-pandemic (Gjallarhornet, Citation1918/1919).
In another issue of the insurance business journal, Gjallarhornet, the insurance industry used the 1918 pandemic as a banner in its propaganda for life insurance even after 1919, stating that: […] ‘rapidly increasing mortality strongly increased the demand for life insurance’ Gjallarhornet (Citation1920, p. 1). The pandemic became a great motivation for purchasing life insurance and in Gjallarhornet (Citation1919), the 1918 pandemic was portrayed as a reason for taking life insurance, and heavily used as a sales argument by life insurance agents. Industrial life insurance companies also marketed their business by informing newspaper readers of how many people had received compensation as a result of deaths during the pandemic (Göteborgs dagblad, Citation1922, no. 22, February 4).
In a wider perspective, we find that the Swedish life insurance industry faced a similar course of events as life insurance companies abroad. On the US life insurance market, the heavy increase in demand was noted by the industry and also here the pandemic was used to motivate people to buy life insurance. In a more systematic survey on the developments, Tarbell (Citation1919) suggests an estimated increase in policies issued equal to 79 per cent during the first six months of 1919, relative to the first six months of 1918. Bell (Citation1997) shows how the life insurers faced an increase in claims close to 60 per cent between 1917 and 1918 (Prudential 57.3%; Kansas City Life 56.8%). However, old (unrealistically high) mortality tables protected solvency, but many life insurance companies still cancelled dividends and only a few life insurers failed. Tarbell (Citation1919) reports that three of 31 Connecticut life insurers raised premiums in 1919, and an additional seven reduced dividends. Most US commercial life insurers held contract terms constant or increased them slightly in 1919 and 1920 (Bell, Citation1997).
In the Swedish life insurance industry, the excess mortality during the pandemic did not result in any restrictions on benefits schemes, although there were cases reported where almost newly issued life insurance policies were due for (death) benefit payment. While the pandemic was expected to lead to a deterioration in the financial position of the life companies in the short term, Svenska Försäkringsföreningen hoped it would be offset by the longer-term positive effects of corporate responsibility.
However, although the life insurance industry both in Sweden and in the US regarded the pandemic as a driver for life insurance demand, it was argued that it probably was not the only reason for the increase in new policies. Regarding the US, Tarbell (Citation1919) puts forward three explanatory factors for the increase in demand for life insurance: (i) General economic prosperity, (ii) The Influenza and (iii) Government insurance for sailors and soldiers. In relation to the drivers put forward in the US, in the case of Sweden we observe – based on wage data from Socialstyrelsen (Citation1919, Citation1920, Citation1921b, Citation1922), deflated by the consumer price index (SCB, Citation2020) – that the most rapid real (annual) wage growth materialised in the years 1919 (16.3%), followed by high growth in 1920 (11.5%) and 1921 (13.5%). Higher real wages among blue-collar workers made purchasing life insurance more affordable. In the US, in areas most affected by the pandemic, manufacturing real wages rose in response to a labour supply shortage (Garrett, Citation2009). A previous study on Sweden, however, does not show any associations between real wage growth and the pandemic (Karlsson et al., Citation2014).
In both the Swedish and the US life insurance industry, the type of policies that increased the most were small industrial policies. This was viewed as problematic, as industrial life insurance policyholders tended to laps their policies in times of economic hardship. The question raised was whether the economic prosperity and experiences from a deadly pandemic would result in a permanent higher level of demand for insurance or whether the increase would be only temporary.
To provide an overview of insurance demand during the pandemic, the following section will provide a descriptive account of developments on the life insurance market during the pandemic. In the subsequent sections, the impact of the pandemic on life insurance savings will be examined.
5. Insurance demand during the pandemic
During the time of the influenza, individuals began demanding life insurance to a considerably higher degree than they had during the years before the pandemic. This was true in Sweden but also elsewhere, such as in the US (Spinney, Citation2017). Although many households came to experience the premature death of a breadwinner, the terminated insurances policies were largely offset by the number of new life insurance policies issued. In the years 1918 and 1919, over 200,000 new life insurance policies were purchased each year, which contributed to an increase in the number of insurance policies by 65 per cent, compared to the previous two years. However, during the years to come, policyholders would voluntarily cancel their policies before the contract had terminated (lapse). Together with a slower growth in policies issued, the net growth in the stock of policies decreased. During the 1920s crisis, the net increase in the stock of life insurance policies decreased to 50,000 per year only. After the crisis, in the years between 1923 and 1925, the net increase went up to an average of 90,000 policies per year. The figure was somewhat lower than the net growth of the policy stock immediately prior to the pandemic.
The growth in the volume of policies came with a substantial shift in the structure of the policies issued. During the pandemic, the demand was for fairly small policies. Close to 60 per cent of all new policies issued between 1918 and 1919 had an insurance sum no more than 600 SEK, at the 1915-year price level. In the pre-pandemic years (1915–1917), only 10 per cent of the policies were that small, and in the subsequent years (1920–1925) only 7 per cent were so small. Normalised by the average wage income of blue-collar workers, 60 per cent of the new policies issued during the pandemic were at half the average wage income level, while only 10 per cent were equally small before and even fewer after the pandemic (Socialstyrelsen, Citation1923; Försäkringsinspektionen; SCB, Citation2020).
In contrast to the Anglo-Saxon experiences, most industrial life insurance policies in Sweden included a savings component (pension plan). A benchmark from 1914 shows that 87 per cent of all issued industrial life policies included a savings component in Sweden (Andersson & Eriksson, Citation2015). During the pandemic, the idea of a pension plan seemed to have been less in focus for the new policyholders, instead the new policyholders sought to cover the immediate cost of a premature death. In that regard, policies issued during the pandemic became more similar to industrial life insurance in the Anglo-Saxon context. Life insurance was to cover funeral expenses and provide for dependents in the short term.
The growth in demand for the smallest policies reflected a shift towards less life insurance protected working-class households. Previous studies on the demand structure among working-class households have shown that, in the Swedish context, both insurance coverage and spending vary substantially by income (Andersson et al., Citation2010). An estimate by Andersson and Eriksson (1915) shows that life insurance spending increased by 4 SEK for every 100 SEK in income-increase among urban working-class households in 1913/14. Descriptives from the same cost-of-living survey (CLS) show that insurance coverage was 80 per cent in the highest income decile (p90), but only 55 per cent in the lowest income decile (p. 10) (Socialstyrelsen, Citation1921a). Yet, because the CLS reflects rather well-off working-class households, there are reasons to believe in even lower insurance protection at the lower end of the income distribution for the entire population of blue-collar workers. According to wage statistics, the adult (>18 years) male annual wage among all blue-collar workers was similar to the lowest male wage income decile in the CLS (Socialstyrelsen, Citation1919, Citation1921a).
To meet the demand at the lower end of the wage distribution, the life insurance premium payment had to be affordable even for less well-to-do households. When looking at the demand structure during the pandemic, we find that the highest demand for life insurance policies (60%) was at a premium of less than 20 SEK annually. Compared with blue-collar workers’ wage level during the pandemic, this shows that most life insurance policies were affordable at a less than 2 per cent expenditure share of an adult male worker’s income on average – a share lower (–.4%) than reported in the CLS (Socialstyrelsen, Citation1921b). The demand structure by premium size shows that, at the lowest decile (p. 10) in the distribution of policies in descending order by size, the expenditure share would equal 1.25 per cent of the average blue-collar worker’s annual wage. A 2 per cent expenditure share at the lowest percentile of premium spending would equal an annual wage income 40 per cent lower than the average adult male worker’s annual income. The small premiums would make insurance purchase equal to a 2 per cent expenditure share for the average female wage income earner (Försäkringsinspektionen, Citation1920, Citation1921; Socialstyrelsen, Citation1919, Citation1920, Citation1921b).
The diffusion of life insurers towards the lower tail of the income distribution was an attractive target for expanding the stock of policyholders for commercial reasons, as many were previously uninsured. For the longer term, as previously mentioned, there were however reasons to question how persistent the sudden shift in the structure of policyholders would be, with regard to the high number of lapsed policies, which was common among industrial life insurance policyholders (Adams, Andersson, Lindmark, Eriksson, & Veprauskaite, Citation2020).
As previously shown in , the number of lapsed policies increased a few years after the influenza pandemic. Although the economy was in a recovering phase with rising real wages (5.9% annually 1923–1925), the number of lapsed policies increased between 1923 and 1925 (See and ). Furthermore, the distribution of lapsed policies by size seems to have shifted before and after the 1918 pandemic (). As shown in , the number of lapsed policies increased the most among policies on the smallest amount. Close to 45 per cent of all lapsed policies were the smallest in size (smallest out of 30 size groups/bins) during the post pandemic period 1923–1925. As a contrast, the proportion of the smallest policies lapsed before the pandemic, was only 10%. There are reasons to believe that workers purchasing the smallest policies during the pandemic later lapsed the policies when the situation normalised after the pandemic. Without a saving component in the smallest policies, the reason for keeping such a life insurance policy became less strong when the mortality rate went back to pre-pandemic level.
Figure 2. Developments of life policies in force, by net change, issuing and lapse in Sweden, 1915–1925. Source: Försäkringsinspektionen (Citation1917–Citation1927).
Note: Net change includes all issued and terminated policies, i.e. lapsed and claimed.
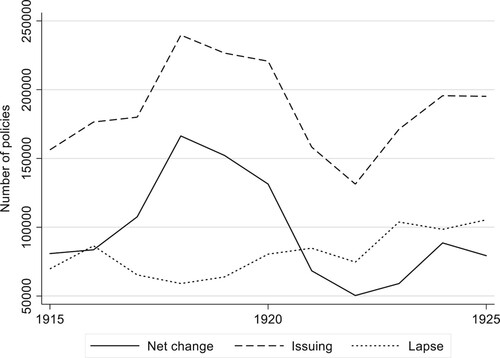
Figure 3. Real life insurance sum at new policies issued (1915-year price level) during World War I, 1918 pandemic and the first half of the 1920s. Source: Försäkringsinspektionen (Citation1917–Citation1927); SCB (Citation2020).
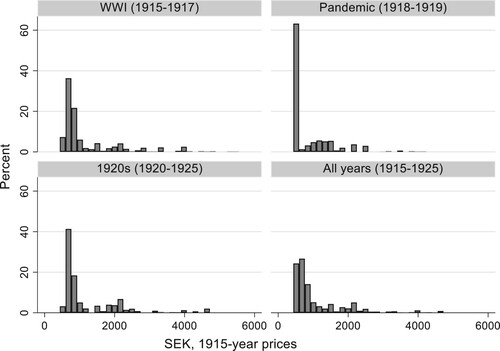
Figure 4. Distribution of lapsed policies by size (sum insured/ nominal wage*) before and after the 1918 influenza pandemic.
Note: *Nominal average wage of adult male workers in manufacturing industry. Source: Försäkringsinspektionen (Citation1917–Citation1927), Socialstyrelsen (Citation1919, 1921 , Citation1922, Citation1924, Citation1925, Citation1926)
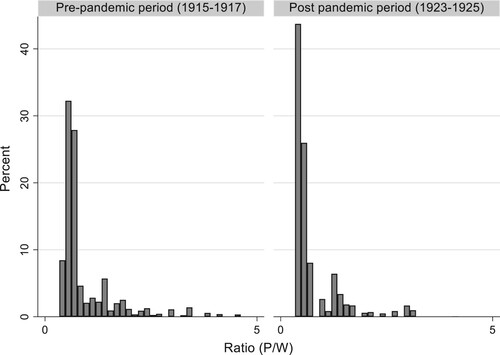
Table 1. Summary statistics of issuing, lapse, policy, real wage, real interest and insurance cover in full sample and by period*, 1915–1925.
To examine more systematically the impact of the 1918 pandemic in the short term – on new policies – and on persistency in the longer term – on lapsed policies – the following section will outline our empirical strategy for examining household responses to the pandemic.
6. Empirical tests of issuing and lapsing of life insurance policies
The descriptive statistics in the previous section give indications that the 1918 pandemic contributed to an increase in life insurance purchases in the short term. Although the growth in policies is seemingly related to the pandemic, there are at the same time a number of other events that may, or may not, have affected the numbers of issued and lapsed policies during the turbulent years between 1915 and 1925. Nonetheless, we can only use descriptives to talk about the potential long-term effects of the pandemic.
In an overview of developments on the insurance market between 1914 and 1923, Karin Kock (Citation1924) argues that the large ups-and-downs on the life insurance market in nominal terms were related to price movements. She shows that, after deflating with the cost-of-living index, the new purchases in terms of real insurance sum were no higher during the influenza years, than before (1914 as reference year) or after (1923 as reference year) the pandemic. Thus, if the 1918 pandemic had no impact on real life insurance spending on the aggregate, as Kock argues, there are reasons to expect a shift in life insurance demand reflected in the structure of policies issued and lapsed, if indeed any response to the pandemic among households occurred.
Such a shift could be consistent with a take-up spike during the pandemic and a later decline to baseline if the shift in demand reflect workers purchasing/terminating only small policies (without a saving component). One of the reasons why an influenza pandemic may impact on the purchase of life insurance policies among uninsured workers, is the finding in the economic literature that individuals appear to overreact to the occurrence of a disaster (Kunreuther et al., Citation1978; Slovic, Kunreuther, & White, Citation1974). Kahneman (Citation2011) furthermore recognises evidence of an availability bias on individuals’ judgement during exogenous chock, such as a natural disaster.Footnote3 A major shift in belief following a disaster could also be consistent with a Bayesian learning model (Davis, Citation2004).
In a study of flood insurance, Gallagher (Citation2014) finds how U.S. homeowner’s insurance take-up increased rapidly when flooding occurred, but return back to baseline only a few years later. Such a behaviour is consistent with availability bias, where people assess the probability of an event by the occurrence that can be brought to mind. Based on that line of reasoning, we expect that the influenza pandemic will affect how people assess the probability of a fatal event. A simple life insurance model would imply that the demand for life insurance increase as the expected probability of a fatal outcome increases. The aforementioned reasoning, therefore, leads us to hypothesis that:
H1: All else equal, the issuing of small life insurance policies is likely to be higher during the pandemic than that before and after the pandemic.
Given that the pandemic caused a take-up spike during the pandemic, we expect a return to baseline in the years following the pandemic. The aforementioned reasoning, therefore, leads us to hypothesis that:
H2: All else equal, the lapse of small life insurance policies is likely to be higher during the years following the pandemic years than before and during the pandemic.
As the industry did neither change pricing or contractual terms aforementioned, the excess mortality effectively lowered the cost of purchasing life insurance in relation to the expected probability of a fatal outcome. Most apparently that would incentivise uninsured individuals facing the highest excess mortality (20–35 years of age) that had breadwinner responsibilities. Given that breadwinners with above average income were largely insured already before the pandemic as aforementioned, the pandemic would predominantly affect demand among previously uninsured low-wage blue-collar workers that afforded only small life policies, predominantly supplied by industrial life insurance companies.
To more closely examine the impact of the 1918 pandemic on these aspects, we have carried out a multivariate analysis based on changes in the stock of life insurance policies, gathered from Försäkringsinspektionen’s (fi) [Swedish Insurance Agency] annual reports for the years 1915–1925. Their statistical reports include both purchases of new/issued policies and voluntary terminations of existing policies (lapses) in number and nominal value by insurance company for each year. To capture the potential shift in insurance demand, we estimate the impact of the difference in the number of issued and lapsed policies, respectively, between policies of different size before, during and after the pandemic.
We expect the strongest impact of the pandemic on the issuance of policies to occur in 1918 and 1919, when the annual mortality rate almost doubled. We have therefore designated the years 1918 and 1919 as a pandemic intervention period for the issuance of new policies. For the lapse of policies, we believe that the small subsequent outbreaks after 1919 and 1920 would have played down the number of lapses, and that the pandemic effect on lapsing was delayed until the perceived risk was normalised. To examine the effect of less perceived risk associated with the influenza outbreak, we have waited until the economy recovered between 1923 and 1925 to estimate the impact of the pandemic on the number of lapses. We have therefore designated the years 1923–1925 as a ‘treatment period’ for lapse of policies.
The impact of the pandemic on policies issued and policies lapsed is expected to occur in the segment of smaller policies, but less so in segments of larger policies. There are two main reasons for this. First, the pandemic is expected to have less impact on the issuance and lapse of larger policies with a significant savings component for the policyholder than on policies that mitigate the immediate cost of a premature death. Second, insurance coverage before the pandemic was high in the upper and middle classes as well as among wealthier working-class families, but low among less well-to-do working-class households. Any major change in the number of policies would take place in the lower tail of the income distribution, i.e. in small life policies offered to low-income workers. Therefore, we have designated real policy size as a ‘treatment intensity’, where insurers offer policies different in size (For treatment intensity see Angrist & Imbens, Citation1995). The interaction with the treatment period is thought to measure the ‘bite’ of the real policy size. Despite the continuous nature of the treatment, the interaction resembles the basic features of a DID-design.
In our empirical analysis, we use company-level data (see ) to conduct a DID analysis on the number of life insurance policies issued and lapsed before, during and after the 1918 influenza. We believe that the company data is useful in distinguishing between smaller and larger policies, where the former targeted the working classes and the latter the middle and upper classes. The company data offers a total count of all policies issued and lapsed on the market, which is an advantage compared to sample data on households or insurers. Given that a DID analysis demands access to longitudinal data, the full-count repeated observations of variables by the company are advantageous. One limitation of our data is that we lack the possibility to take into consideration individual characteristics as covariates. But as will be explained in greater detail below (along with details concerning the data), we use a panel data design to control for omitted variable bias due to unobserved heterogeneity.
To conduct the DID analysis, we take into consideration the difference in the size of policies offered by life insurance providers, where pre-pandemic (1915–1917) real policy size is a measure of ‘treatment intensity’. The test rest on the assumption that a reasonably clean identification is possible given that the market is fairly segmented between companies during our period of study. We use the pandemic as an intervention, split by two periods to reflect the issuance (1918–1919) and lapse (1923–1925) of life insurance policies. Beyond capturing a potential structural shift in the issuance and lapse of policies, the design helps in controlling for other external factors that may affect life insurance demand more generally during the period, such as wage developments, unemployment, interest rates, inflation, etc.
To capture the impact of the pandemic on the life insurance market, we have applied the following DID model, where: the outcome variable is Yit in company i and year t (i.e. the number of policies issued and lapsed by company i in year t), αi is a company-fixed effect, Wit is our treatment indicator, λt is a year-fixed effect, and ϵit is a residual disturbance. It is straightforward to show that an OLS estimate of β will capture the treatment effect if the assumptions of the DID analysis are satisfied.
(1)
(1) Given that the treatment indicator is truly exogenous, including covariates should lead to robust results. In our analysis, we include controls for macro-economic developments in wages and interest rate, which previous studies have identified as being exogenous to the pandemic (Karlsson et al., Citation2014). We also take this analysis a step further by considering covariates that are potentially endogenous and by testing whether the results are robust to the inclusion of confounders, including the growing insurance coverage over time. Although this may incur a ‘bad control problem’ (Angrist & Pischke, Citation2008), it offers an opportunity to check the robustness of our results.
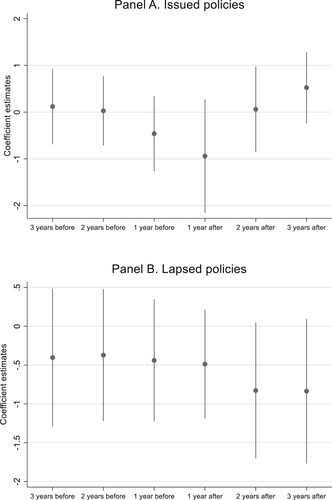
Since we are interested in estimating the causal effect of the influenza pandemic on the issuing and lapse of life insurance policies, we are concerned that the strict exogeneity of the pandemic may fail in the presence of time-varying unobservable effects. To control if there were any of the latter effects on the outcomes immediately before or after the pandemic, we have run a test that allows for leads and lags of the pandemic. We use three leads, three lags, and the same company panel data as used to estimate Equation (1), to identify all these coefficients. For this ‘event study’, we estimate:
(2)
(2) Where we instead of a single treatment effect, now also include m leads of the treatment effect and q lags of the treatment effect.
is the coefficient of the jth lead or lag. A test of the DID assumption is
, i.e that the coefficients on all leads of the treatment should be zero. plots of the βj coefficients.
Figure 5. Coefficient estimate of pre-trend and post-trend before and after the 1918 infuenza pandemic by issued and lapsed policies.
Note: See Appendix 1, for details. Source: See Table 1.
7. The impact of the pandemic on household risk strategies
The company data from the insurance inspectorate (‘sample data’) include an annual average of 22 life insurance companies, of which 5 were industrial life insurers and 17 ordinary life insurers (number rounded to unity). The data originate from the mandatory reports submitted by life insurance companies to the insurance inspectorate. The data include all financial accounting data, including policies in force, the issuance and termination of policies (where lapse is voluntary) by number and value for each company annually (Försäkringsinspektionen, Citation1917–Citation1927). During our period of study, between 1915 and 1925, there were 2 entries and 3 exits among the life insurance companies.
In , summary statistics of issuing, lapse, real policy, and contextual variables are shown for the full sample and by sub-periods. The annual average of policies issued per company amounted to 8393 per year during the period 1915–1925. During the pandemic years (1918 and 1919), the number of issued insurances policies equalled 10,361 per year. Using a simple OLS regression on the same company data, with a dummy for the pandemic years, shows a significant coefficient equal to 2288 policies (see , panel A, column 1). The figure largely reflects the face value difference (2411) between the pandemic and the non-pandemic years.
Table 2. The impact of the 1918 pandemic on issued and lapsed policies.
Although the descriptive statistics indicate a surge in the demand for life insurance in general, and small policies in particular, we cannot rule out that omitted factors, other than the exogenous shock of the pandemic, were behind the developments. The turbulent years at end of the First World War and the crises of the early 1920s caused major fluctuations in wages, unemployment, interest rates, and consumer prices, with potential implications for the ups-and-downs observed in the number of policies issued.
To isolate the effect of the pandemic on the issuance of policies, we move to the regression model outlined in EquationEquation 1(1)
(1) , where we essentially estimate the difference in response to real size of policy during the pandemic years (in relation to the non-pandemic years). The estimated interaction coefficient (I (Year = 1918–1919) × Real policy size 1915–1917) shows a significant negative relation to size, i.e. larger policies was in less demand than small policies during the pandemic. As shown in (Panel A, column 2 and 3), basically the same estimate (I (Year = 1918–1919) × Real policy size 1915–1917) arises when adding controls for economic fluctuations during the period, along with the size of the policies. There is an expected positive relation to real wage growth and negative relation between real interest and issuing (Adams et al., Citation2020).
Given that the substantial leap in the number of policies issued was overrepresented by a previously uninsured, less well-to-do group of policyholders, we would expect an increased risk of lapses a few years later, when the perceived risk of premature death vanished. Previous findings have put forward economic hardship as a factor that can explain the rise in lapses, as temporary loss of income – in, e.g. the event of unemployment – makes insurance less affordable (Adams et al., Citation2020). With that in mind, one might expect, on the one hand, that the lapses would increase with the economic crises of the early 1920s and decrease again with the later economic recovery. On the other hand, one might expect that perceived risk associated with the pandemic would postpone the lapse response until the situation normalised after the crises.
As can be seen in , which shows policies lapsed based on the company data from Försäkringsinspektionen, the yearly average of policies lapsed per company was 3739 between 1915 and 1925. Between 1923 and 1925, the number of lapsed policies equalled 4732 annually. A simple OLS, including a dummy for the intervention/post-pandemic years (1923–1925), shows a significant coefficient equal to 1599 lapsed policies (see , panel B, column 4). The face value of difference between pre-intervention and intervention equals 1360 lapsed policies.
To isolate how the increase in the new industrial policies issued during the pandemic years impacted lapses during the post-pandemic years, we have applied the DID regression model outlined in Equation (1), with number of lapses policies as the dependent variable. In contrast to the DID model on the number of issued policies, we use the post-pandemic years (1923–1925) as the treatment period, interacted with real policy size (of lapsed policies). Although there are difficulties in completely separating the effect of the 1920s crises and relaxed risk perception after the last pandemic outbreak in 1920, we believe that estimating the impact when the economy recovers gives a clearer and more robust test of the postponement argument.
When examining lapse behaviour in relation to the differences in real policy size during the post-pandemic period (1923–1925), The estimated interaction coefficient (I (Year = 1923–1925) × Real policy size 1915–1917) shows a significant negative relation to size, i.e. larger policies was more commonly lapsed then small policies during the post-pandemic years. As shown in , (Panel B, Column 5 and 6), the estimated changes only slightly when adding controllers. We find an expected negative association with real wage, and a positive association with real interest (Adams et al., Citation2020).
As an extension, we have removed the pre-pandemic restriction on average policy size in our treatment intensity variable, and examined if the pandemic caused a shift in (real) policy size or not. When the model defined in eq 1. is re-run with the alternative measure on treatment intensity, we find only a slight change in the estimated coefficients in the full model on issued (from −1.203** to −1.061**) and lapsed (from −0.522**to −0.384**), see and Appendix 2, .
The causal interpretation of the influenza pandemic on the issuing and lapse of particular small policies rests on the aforementioned identification assumption. To check for the validity of that assumption, we have included leads and lags of the pandemic, as in Equation (2). The coefficient estimates for this regression are shown in and reported in in Appendix 1. The estimated ‘effect’ of three pre-pandemic years on the issuing and the lapse of policies are insignificant, and close to zero. The estimated ‘effect’ of three post-pandemic years for the same variables is insignificant at the ≤5% level of significance, and close to zero. We find only a weak impact at the 10% level of significance a few years after the pandemic. One potential reason for the latter is the turbulent macro-economic situation. Taken together our event study is consistent with the causal interpretation; the influenza pandemic spurred the demand for small life insurance policies, but led to a subsequent increase in lapse rate a few years after the pandemic.
8. Concluding remarks
In managing the financial consequences of the 1918 influenza pandemic, households’ risk strategies changed drastically. Our DID analyses show a significant shift in the structure of life insurance demand during the pandemic. The shift was driven by a surge for small-sum life insurance policies, which were offered primarily to low-paid workers, mostly by industrial life insurance companies. The many small policies issued during the pandemic met workers’ need to cover the immediate, short-term financial losses connected to the premature death of a breadwinner or family member.
Despite economic hardship during the crises of the early 1920s, most households still prioritised keeping policies they had purchased during the pandemic. However, when the perceived risk returned to that of the pre-pandemic situation, a massive increase in policy lapses took off, even though the economy was booming.
The life insurance industry perceived the increase in the issuance of new small policies to be an effect of the pandemic, but it was unclear whether the rise in real wages also played a role. The excess mortality incentivised many uninsured less well-to-do workers to insure themselves, but also caused major financial pressure due to the claims following the many cases of premature death. Although insurers’ economic hardship put constraints on dividends, the inclusive policy was considered beneficial in the long run, and insurance representatives anticipated an enduring effect on insurance demand. Our study shows, however, that the expectation of a continuously high demand for insurance was not realised. The rise in life insurance policies issued during the pandemic was offset by the rise in policies lapsed a few years later.
The historical experience of the 1918 influenza pandemic shows that households responded strongly to the excess mortality by demanding a financial vehicle that could mitigate the consequences. However, when things returned to normal, households also returned to the same risk strategies they had before the influenza outbreak. In that regard, the 1918 influenza pandemic had no enduring effects on households’ risk assessment strategies and did not contribute to improved financial readiness in the face of possible future influenza pandemics.
In relation to previous studies on the economic impact of the influenza pandemic, our findings provide some new evidence and insights concerning household behaviour. The short-term response demonstrates that households’ trade-off between consumption and savings was not effectively altered more than temporarily with respect to the 1918 influenza pandemic. The pandemic put only enough pressure to cause households to cede some of their consumption for life insurance savings, as long as they perceived a considerable above-average mortality risk.
In the current debate on the impact of the COVID-19 crisis, one related question is whether the pandemic will lead to temporary or enduring changes in risk and insurance strategies. Based on the historical experiences of the 1918 influenza pandemic, there is reason to believe more in a temporary than in an enduring effect.
Acknowledgements
The paper benefits by comments from; (i) Paul Nystedt, University of Jönköping, Sweden, (ii) Professor Bernard Harris, Strathclyde University, (iii) Participants at the seminar held at Centre for Demographic and Ageing Research in spring 2020 and, (vi) Two anonymous referees. However, the normal disclaimer applies.
Disclosure statement
No potential conflict of interest was reported by the author(s).
Additional information
Funding
Notes
1 FFT was an organization that gathered Swedish insurance companies. The organization was represented by members of parliament and prominent scientists who were commonly the executives of life insurance companies. The aim of the organization was to work for the solidity and trustworthiness of the business. The organization collected and presented statistics from the companies and was also deeply involved in the regulation of the insurance industry (Larsson, Lönnborg, & Svärd, Citation2005).
2 This is in line with sources of individual life insurance companies, showing no changes in contract terms or restrictions in the business due to the pandemic. See, e.g. Famtiden livförsäkringsaktiebolag De Förenade - Framtiden – Viktoria Minnesskrift (Citation1972. p. 105) and for industrial life insurance company Trygg: Sjöberg (Citation1925).
3 Tversky and Kahneman (Citation1982, p. 11) describe availability bias as ‘situations in which people assess the frequency of a class or the probability of an event by the ease with which instances or occurrences can be brought to mind’.
References
- Adams, M., Andersson, L. F., Lindmark, M., Eriksson, L., & Veprauskaite, E. (2020). Managing policy lapse risk in Sweden’s life insurance market between 1915 and 1947. Business History, 62(2), 222–239.
- Almond, D. (2006). Is the 1918 influenza pandemic over? Long-term effects of in utero influenza exposure in the post-1940 U.S. population. Journal of Political Economy, 114(4), 672–712.
- Almond, D., & Mazumber, B. (2005). The 1918 influenza pandemic and subsequent health outcomes: An analysis of SIPP data. The American Economic Review, 95(2), 258–262.
- Åman, M. (1990). Spanska sjukan. Den Svenska epidemin 1918–1920 och dess internationella bakgrund (Doctoral thesis in History). Uppsala universitet, Studia Historica Upsaliensia 160.
- Andersson, L. F., & Eriksson, L. (2015). The compulsory public pension and the demand for life insurance: The case of Sweden, 1884–1914. The Economic History Review, 68(1), 244–263.
- Andersson, L. F., Eriksson, L., & Lindmark, M. (2010). Life insurance and income growth: The case of Sweden 1830–1950. Scandinavian Economic History Review, 58(3), 203–219.
- Angrist, J. D., & Imbens, G. W. (1995). Two-Stage least squares estimation of average causal effects in models with variable treatment intensity. Journal of the American Statistical Association, 90(430), 431–442.
- Angrist, J. D., & Pischke, J. S. (2008). Mostly harmless econometrics: An empiricist’s companion. Princeton: Princeton University Press.
- Arnold, C. (2018). Pandemic: 1918. New York, NY: St Martin’s Press.
- Attanasio, O. P., Banks, J., Meghir, C., & Weber, G. (1999). Humps and bumps in lifetime consumption. NBER Working Paper 5350, in Journal of Economic and Business Statistics.
- Barro, R. J., Ursúa, J. F., & Weng, J. (2020). The coronavirus and the great influenza pandemic: Lessons from the ‘Spanish flu’ for the coronavirus’s potential effects on mortality and economic activity. Working Paper 26866, National Bureau of Economic Research.
- Barry, J. M. (2004a). The great influenza: The epic story of the deadliest plague in history. New York, NY: Viking.
- Barry, J. M. (2004b). The site of origin of the 1918 influenza pandemic and its public health implications. Journal of Translational Medicine, 2(1), 3.
- Bell, A. (1997, March 31). Flu pandemic hit insurers hard. National Underwriter, Life & Health, 46–47.
- Bengtsson, T., Dribe, M., & Eriksson, B. (2018). Social class and excess mortality in Sweden during the 1918 influenza pandemic. American Journal of Epidemiology, 187(12), 2568–2576.
- Bergander. (1967). Försäkringsväsendet i Sverige 1814–1914, Wesmanns skandinaviske forsikringsfond, Försäkringsinspektionen, Stockholm.
- Brainerd, E., & Siegler, M. (2003). The economic effects of the 1918 influenza epidemic. Working Paper 3791. Centre for Economic Policy Research.
- Brown, J. (2018). Influenza: The hundred-year hunt to cure the deadliest disease in history. New York, NY: Touchstone.
- Clay, K., Lewis, J., & Severnini, E. (2018). Pollution, infectious disease, and mortality: Evidence from the 1918 Spanish influenza pandemic. The Journal of Economic History, 78(4), 1179–1209.
- Dahl, C. M., Hansen, C. W., & Jensen, P. S. (2020). The 1918 epidemic and a v-shaped recession: Evidence from municipal income data. Working Paper.
- Davis, L. W. (2004). The effect of health risk on housing values: Evidence from a cancer cluster. American Economic Review, 94(5), 1693–1704.
- Eriksson, L. (2010). Industrial life insurance and the cost of dying: The role of endowment and whole life insurance in Anglo-Saxon and European countries during the late nineteenth and early twentieth centuries. In R. Pearson (Ed.), The development of international insurance (1st ed., pp. 117–132). London: Pickering & Chatto.
- Eriksson, L. (2011). Life after death: The diffusion of Swedish Life insurance - dynamics of financial and social modernization 1830-1950, diss. Umeå university.
- Eriksson, L. (2014). Beneficiaries or policyholders? The role of women in Swedish life insurance 1900–1950. Business History, 56, 1335–1360.
- Försäkringsinspektionen. (1919). Enskilda försäkringsanstalter år 1917, Stockholm.
- Försäkringsinspektionen. (1920). Enskilda försäkringsanstalter år 1918, Stockholm.
- Försäkringsinspektionen. (1921). Enskilda försäkringsanstalter år 1919, Stockholm.
- Försäkringsföreningens tidskrift. (2011). Svenska försäkringsföreningen, Stockholm.
- Försäkringsinspektionen. (1917–1927). Enskilda försäkringsanstalter, 1915–1925, Sveriges officiella statistik, Stockholm.
- Framtiden Livförsäkringsbolag. De Förenade, Framtiden, Victoria. Minnesskrift. (1972). Uppsala: Almqvist och Wiksells.
- Garrett, T. (2009). War and pestilence as labor market shocks: US manufacturing wage growth 1914–1919. Economic Inquiry, 47(4), 711–725.
- Gallagher, J. (2014). Learning about an infrequent event: Evidence from flood insurance take-up in the United states. American Economic Journal: Applied Economics, 6(3), 206–233.
- Gjallarhornet: Nordisk försäkringstidskrift. (1918/1919). Göteborg: Zachrissons boktryckeri.
- Gjallarhornet. Nordisk Försäkrings-Tidning. (1919). Stockholm: Gjallarhornets förlag.
- Gjallarhornet. Nordisk Försäkrings-Tidning. (1920). Stockholm: Gjallarhornets förlag.
- Göteborgs dagblad. (1922). Livförsäkringens giltighet vid dödsfall i spanska sjukan. nr. 22, 4 February, 1922.
- Guimbeau, A., Menon, N. M., & Musacchio, A. (2019). The Brazilian bombshell? The long-term impact of the 1918 influenza pandemic the South American way.
- Helgertz, J., & Bengtsson, T. (2019). The long-lasting influenza: The impact of fetal stress during the 1918 influenza pandemic on socioeconomic attainment and Health in Sweden, 1968–2012. Demography, 56(4), 1389–1425.
- Huynh, A., Bruhn, A., & Browne, B. (2013). A review of catastrophic risks for life insurers. Risk Management & Insurance Review, 16(2), 233–266.
- Johnson, N. P., & Mueller, J. (2002). Updating the accounts: Global mortality of the 1918–1920 ‘Spanish’ influenza pandemic. Bulletin of the History of Medicine, 76, 105–115.
- Junestav, M. (2004). Arbetslinjer i svensk socialpolitisk debatt och lagstiftning 1930–2001 (Doctoral thesis in Economic History). Uppsala: Uppsala University.
- Kahneman, D. (2011). Thinking, fast and slow. New York, NY: Farrar, Straus and Giroux.
- Karlsson, M., Nilsson, T., & Pichler, S. (2014). The impact of the 1918 Spanish flu epidemic on economic performance in Sweden. An investigation into the consequences of an extraordinary mortality shock. Journal of Health Economics, 36, 1–19.
- Kock, K. (1924). Konjunkturutvecklingen och försäkringsrörelse under åren 1914–1923. Svensk försäkrings årsbok, 11–31.
- Kolata, G. B. (2000). Flu: The story of the great influenza pandemic of 1918 and the search for the virus that caused it. London: Macmillan.
- Kunreuther, H. C., Ginsberg, R., Miller, L., Sagi, P., Slovic, P., Borkan, B., & Katz, N. (1978). Disaster insurance protection: Public policy lessons. New York, NY: Wiley.
- Larsson, M., Lönnborg, M., & Svärd, S.-E. (2005). Den svenska försäkringsmodellens uppgång och fall. Stockholm: Svenska försäkringsföreningen.
- Lewis, F. (1989). Dependents and the demand for life insurance. The American Economic Review, 79(3), 452–467.
- Oxford, J. S., Sefton, A., Jackson, R., Innes, W., Daniels, R. S., & Johnson, N. P. (2002). World War I may have allowed the emergence of ‘Spanish’ influenza. The Lancet Infectious Diseases, 2, 111–114. doi:10.1016/S1473-3099(02)00185-8
- Roser, M., Ritchie, H., Ortiz-Ospina, E., & Hasell, J. (2020). Coronavirus pandemic (COVID-19). Published online at OurWorldInData.org. Retrieved from https://ourworldindata.org/coronavirus [Online Resource]
- Shortridge, K. (1999). The 1918 ‘Spanish’ flu: Pearls from swine? Nature Medicine, 5(4), 384–385.
- Sjöberg, S. (1925). Svenska lifförsäkringsanstalten Trygg 1899–1924 : kort återblick på anstaltens 25-åriga verksamhet. Svenska lifförsäkringsanstalten Trygg.
- Slovic, P., Kunreuther, H., & White, G. F. (1974). Decision processes, rationality, and adjustments to natural hazards: A review of some hypotheses. In G. White (Ed.), Natural hazards: Local, national and global (pp. 187–205). New York, NY: Oxford University Press.
- Socialstyrelsen. (1919). Sociala meddelanden: Löneinkomster för arbetare efter näringsgrenar. Häften 1–6, Socialstyrelsen, Stockholm.
- Socialstyrelsen. (1920). Sociala meddelanden: Löneinkomster för arbetare efter näringsgrenar.
- Socialstyrelsen. (1921a). Levnadskostnaderna i Sverige 1913–1914. Stockholm.
- Socialstyrelsen. (1921b). Sociala meddelanden: Löneinkomster för arbetare efter näringsgrenar.
- Socialstyrelsen. (1922). Sociala meddelanden: Löneinkomster för arbetare efter näringsgrenar.
- Socialstyrelsen. (1923). Sociala meddelanden: Löneinkomster för arbetare efter näringsgrenar, Sveriges Offentliga Statistik, Stockholm.
- Socialstyrelsen. (1924). Sociala meddelanden: Löneinkomster för arbetare efter näringsgrenar.
- Socialstyrelsen. (1925). Sociala meddelanden: Löneinkomster för arbetare efter näringsgrenar.
- Socialstyrelsen. (1926). Sociala meddelanden: Löneinkomster för arbetare efter näringsgrenar.
- Spinney, L. (2017). Pale rider: The Spanish flu of 1918 and how it changed the world. New York, NY: Public Affairs.
- Statistiska centralbyrån (SCB). (1922). Dödsorsaker år 1917, Folkmängden och dess förändringar, Sveriges Officiella statistic, Stockholm.
- Statistiska centralbyrån (SCB). (1923). Dödsorsaker år 1918, Folkmängden och dess förändringar, Sveriges Officiella statistic, Stockholm.
- Statistiska centralbyrån (SCB). (1924). Dödsorsaker år 1919, Folkmängden och dess förändringar, Sveriges Officiella statistic, Stockholm.
- Statistiska centralbyrån (SCB). (1925). Dödsorsaker år 1920, Folkmängden och dess förändringar, Sveriges Officiella statistic, Stockholm.
- Statistiska Centralbyrån (SCB) Statistikdatabasen. (2020). Konsumentprisindex (KPI)/Levnadskostnadsindex utan direkta skatter och sociala förmåner, juli 1914=100. År 1914–2019, 2020.
- Tarbell, T. F. (1919). The Effect of Influenza on Insurance. In Proceedings of the National Convention of Insurance Commissioners, September 9–12, 1919. Hartford, CT, 302–311.
- Taubenberger, J. K., & Morens, D. M. (2019). The 1918 influenza pandemic and its legacy. Cold Spring Harbor Perspectives in Medicine, 10, a038695.
- Tversky, A., & Kahneman, D. (1982). Judgment under uncertainty: Heuristics and biases. In D. Kahneman, P. Slovic, & A. Tversky (Eds.), Judgment under uncertainty: Heuristics and biases (pp. 3–22). Cambridge, UK: Cambridge University Press.
- Velde, F. (2020). What happened to the US economy during the 1918 influenza pandemic? A view through high-frequency data. Federal Reserve Bank of Chicago Working Paper, No. 2020-11.
- Waldenström, D. (2014). Swedish stock and bond returns, 1856–2012. In R. Edvinsson, t. Jacobson, & D. Waldenström (Eds.), Volume II: House prices, stock returns, National accounts, and the Riksbank balance sheet, 1620–2012 (pp. 223–292). Stockholm: Sveriges Riksbank, Ekerlids förlag.
Appendices
Appendix 1
Table A1. Tests for the parallel trend assumption by years before and after the 1918 influenza pandemic.
Appendix 2
Table A2. The impact of the 1918 pandemic on issued and lapsed policies, alternative specification 1*.