
ABSTRACT
This paper contributes to the debate on historical income inequality, and especially on the decrease in inequality found in industrialised countries during the first half of the twentieth century. We use new archival individual – and household-level data for taxpayers in Sweden's third-largest city, Malmö, from 1900 to 1950. Previous research has established that Sweden had a distinctive downturn in income inequality during the first half of the twentieth century, and explanations have not the least focused on capital incomes and taxes. With our original data we shed light on what happened to working-class and middle-class incomes, and show the importance of job upgrading of the working-class, the decline of domestic service and women's enhanced position on the labour market, and declining market incomes for top income earners in changing Malmö’s income distribution. We compare pre-tax and post-tax distributions, and the distribution on the individual level and the household level. With the new micro data, a richer account of income growth and income distribution in twentieth century Sweden is provided.
1. Introduction
This paper builds on two new micro datasets of income-taxpayers in the industrial city of Malmö in southern Sweden from 1900 to 1950. First, a random sample of the city’s inhabitants in 1900, 1920 and 1950 gives the incomes, job titles, gender, and civil status of about 11 000 taxpayers. Second, and a strategic sample of two working-class areas and two affluent areas in 1905, 1920, 1935 and 1950 gives the same information and more – location and household composition – for another 2,100 taxpayers, with a special representation of low-income earners and the affluent. We use the detailed income data to address one of the big issues in economic history today: the evolution of inequality in the long run (cf. Piketty, Citation2014, Citation2020; Williamson, Citation2015).
Sweden is an especially interesting country to study during the great levelling because it went from one of the most unequal income distributions among the industrialised countries to one of the most equal, and that in the era before the establishment of the modern welfare state (Roine & Waldenström, Citation2008). The Swedish case disproves the hypothesis that inequality reductions mainly come from destruction and disorder (Scheidel, Citation2017) seeing it did not experience destruction of capital during the world wars, did not see a particularly harsh downturn during the great depression, or experience decolonialization in the mid-twentieth century (cf. Piketty, Citation2020). Previous literature studying Sweden has pointed to falling capital incomes and increasing taxation as drivers for the equalisation (Gustafsson & Johansson, Citation2003; Roine & Waldenström, Citation2008). With our micro data we go back to an older tradition of micro data studies on Swedish income inequality (Järnek, Citation1971; Olsson, Citation1972) and focus on the role of composition of the work force, the labour force participation of women, taxation and the household structure, for the striking decline in inequality.
Malmö provides a promising setting for studying incomes and income inequality in this period as it was an industrialising, rapidly growing city. The city’s population grew from 26,000 inhabitants in 1870–200,000 by the 1950s, consolidating its position as Sweden’s third-largest city, as production in textile, tobacco and engineering firms took off, followed by shipbuilding and other engineering industries (Bjurling, Citation1985, pp. 158–161; Ohlsson, Citation1994, pp. 13–14). Already by 1910 54.7 percent of Malmö’s male population was employed in industry, and the corresponding share for women was 38.2 percent (Ohlsson, Citation1994, p. 33).
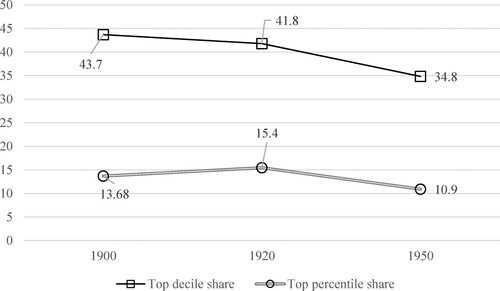
summarises the big picture of inequality development by measuring the share of market income captured by the top 1 percent and top 10 percent of taxpayers in Malmö in 1900, 1920 and 1950, building on our random sample. Measured by the top decile, inequality falls for each benchmark, from 44 percent in 1900–35 percent in 1950; the top 1 percent on the other hand benefitted even more in 1920 (15%) than in 1900 (14%) after which there was a decline to 1950 (11 percent).
Figure 1. Top income shares in Malmö, 1900, 1920 and 1950. Note. Individual-level calculation. Based on Bengtsson, Molinder and Prado’s (Citation2022) national dataset, which includes a random sample of taxpayers in Malmö. The calculations for 1900 and 1920 include imputing an income of 400 kr for non-taxpayers.
The rest of the paper will explore the dynamics of the evolution of incomes and income inequality in Malmö during the first 50 years of the twentieth century.
2. Research design and data
We utilise two samples, one random sample of taxpayers in 1900, 1920 and 1950, and one strategic sample of 1905, 1920, 1935 and 1950. The samples build on the original tax records (taxeringslängder), stored at the National Archives (Riksarkivet) in Stockholm and the Malmö city archive. The bevillning income tax was imposed with the 1862 municipal reform, when poor relief and schooling were transferred from the parishes’ domain to the newly formed municipalities (Fridh & Dahlberg, Citation1962, pp. 449–454). This source enables us to track every taxed individual's income and several other essential variables, such as profession.Footnote1 The income tax was very low in this period: 1 percent from the beginning and in 1950 only 8 percent (Malmsten, Citation1994, p. 227) so the incentive to shirk taxes was weak.Footnote2
The first dataset is a random sample of 1 percent of taxpayers in 1900 and 1920 and 0.5 per cent in 1950, collected from the National Archives. This includes 843 Malmö taxpayers in 1900; 3,103 taxpayers in 1920; and 7,266 taxpayers in 1950.Footnote3 The advantage with this sample is that it is a random sample of all Malmö taxpayers provide the basis for generalisations about the Malmö population overall. However, it lacks geographic information and information about the household structure, which we have in the strategic sample, which additionally wilfully oversamples top income earners.
The strategic sample, collected from the Malmö city archive, focuses on four areasFootnote4 of the city: two high-income areas, the Old town around Stortorget and Grönvången, and two working-class areas, Möllevången and Södervärn. Such sampling is important since it seems that much of income inequality is driven by top groups (cf. Piketty, Citation2014), such as residents of the Old Town and Grönevången, but also because the lower groups are largely missing from previous long-run inequality studies due to the nature of the data used.Footnote5 Grönvången has by Malmö historians been described as containing the ‘money-aristocracy’s splendid villas’ (Häger, Citation1989, p. 424; see also Bjurling, Citation1985, p. 209), while Södervärn and Möllevången were working-class districts in the southeast corner of the city, located in and around Möllevångstorget, a primary area of settlement for the growing rural population as it continued to migrate to find work in the growing industrial urban centres (Bjurling, Citation1985, p. 160). In each of the four areas we sampled 130 taxpayers each year, from the same city blocks (kvarter) every time.Footnote6 With 130 taxpayers for each area, each year yields in total a sample of 520 individuals. This is a sample large enough to conduct a further educated enquiry into income disparities in the town. To ascertain that our strategic sample are not subject to fluctuations because of the sample size, we have also experimented with enlarging the sample. For 1935 we sampled one extra kvarter for Stortorget (118 taxpayers) and one for Södervärn (97 taxpayers). The estimated median incomes fluctuated only in a minor way (see the discussion in Appendix A, especially ).
An important issue when using tax data for estimating inequality is to consider who did and did not pay income tax. In the early twentieth century, the proportion who paid income tax was rather limited. Atkinson (Citation2007, pp. 27–32) discusses the statistical sources of the early top incomes studies and shows that typically, inequality estimates for the three or four first decades of the 1900s build on tax data where less than 10 percent of the adult population paid income tax. In our case, to 1919 the threshold to pay income tax was an annual income of 600 kronor, which in 1919 was raised to 800kr. How large a share of the Malmö population were below the threshold, and so excluded from the tax sources? We know that the shares of the employed who paid tax were very high by the 1930s,Footnote7 but for the benchmark years 1905 and 1920 we go into the church books, which list all residents regardless of income (the church books were the basis of the census) to count the number of residents in our working class areas Möllevången and Södervärn. A comparison of the number of people in the church books and the number who paid income tax, provides an estimate of the share of adults who paid tax. The results are shown in . As we can see, for such an early period, the coverage for adults in the working-class districts are quite good (compared to the international data situation as discussed by Atkinson, Citation2007): 59 percent in 1905, 71 percent in 1920. However, there is a very strong gender pattern. Among women in the working-class areas in 1905, only 28 percent earned enough to pay the municipal income tax.
Table 1. Share of coverage in the tax records for Södervärn and Möllevången in 1905 and 1920.
We want to emphasise that the investigation in explicitly concerns working-class areas with low incomes, so the share who earned too little to pay income tax is likely to be higher here than in the city overall. In any case, it is not reasonable to assume that the 41 percent in these two areas who did not pay income tax in 1905, or the 29 percent in 1920, had no income at all. Instead, the standard in the literature is to impute an income for those below the threshold. The standard (see discussion in Atkinson, Citation2007) is to assume that the income of non-filers is at a certain share of the cut-off for paying taxes. For example, Roine and Waldenström (Citation2010) in their study of Sweden impute an income of 480 kr, i.e. 80 percent of the cutoff point of 600 kr, for men and 380 kr for women.Footnote8 Similar approaches of assuming incomes below the tax threshold were employed when estimating inequality in Norway (Aaberge, Atkinson, & Modalsli, Citation2020) and Denmark (Atkinson & Søgaard, Citation2016). We will impute a homogenous income of 400 kr for those not paying tax in the random sample because no gender information is available, while the strategic sample with its gender info enable us to impute income of 480 for men and 380 for women among the non-taxpayers. In the random sample, we have no independent estimate of the share who paid tax, such as the comparison between church books and taxation lists in , so there we also assume a certain level of non-filers. For 1900, we assume that 70 percent of Malmö adults’ paid income tax, and for 1920, 80 percent. For 1950 we make no adjustment at all.
3. Results: incomes in Malmö, 1900–1950
3.1. Overall evolution of income and the differences between social groups
shows the evolution of incomes in Malmö, using the random sample of taxpayers from 1900, 1920 and 1950, adjusted for non-payment of taxes. The table shows that the average income in real terms shrank slightly from 1900 to 1920, from 1 176 kr in 1900–1 086 kr in 1920, after which it grew significantly to 1 723 kr in 1950. Piketty (Citation2014, p. 252, 281) argued that ‘in every society, even the most egalitarian, the upper decile is truly a world unto itself’; He divided it into the top 1 percent, labelled ‘the dominant class’, and the next 9 percent as the ‘wealthy class’. We follow the focus on the top decile and the split (as in Piketty, Saez, & Zucman, Citation2018) of the rest of the population into a group of percentiles from 50 to 89, labelled the middle 40 or the ‘middle class’, and the bottom 50 percent. Income growth was not equally distributed across the income spectrum: nominal incomes of the top 10 percent was 3.4 times higher in 1950 than in 1900 but those of the middle class (percentiles 50–90) were 6.0 times higher and those of the bottom 50 percent were 5.1 times higher. This indicates a pro-working and pro-middle-class pattern of growth over the period as a whole.
Table 2. Mean incomes of the top 10, middle 40 and bottom 50 in 1900, 1920 and 1950.
Observing real incomes instead of nominal ones, we see a striking pattern of slightly falling incomes for the top 10 percent throughout the period which would seem peculiar considering the substantial real per capita growth in the Swedish economy of about 220 percent from 1900 to 1950 (Schön & Krantz, Citation2015). But similar results are found by Gustafsson and Johansson (Citation2003) for Gothenburg in which the top decile sees stagnant real incomes throughout the period 1925–1958, and Bengtsson and Molinder (Citation2022) find that the annual growth of the top percentile's income in Stockholm was negative from 1920 to 1950. This study's results thereby reinforce the notion that the very top, which had relatively exceptionally high incomes in the early twentieth century, experienced not only a stagnation in living standards but a drop in their purchasing power, in line with what Piketty (Citation2020, p. 29, 486) has labelled the collapse of ‘ownership societies’. While the incomes of the top decile stagnated in Malmö, real income gains from 1920 to 1950 were substantial for both the middle groups, whose real incomes grew 51 percent, and for the bottom half, whose real incomes grew by 109 percent. The following sections provide a decomposition of the mechanisms of this pattern of pro-working – and middle-class income growth.
We begin the decomposition by dividing the taxpayers in three broad social groups, following the classification used by Statistics Sweden at this time (see Haldorson, Citation2016; Smedberg, Citation2022). Social group I includes entrepreneurs and leading officials and professionals. Social group II comprises lower officials and minor business owners. Social group III consists of manual workers. shows the development of real incomes, i.e. when adjusted for the growth of the consumer price index, in our benchmark years. We see that the real incomes of social group I stagnate over time: the average as well as the median falls from 1900 to 1920 and is rather stable to 1950, at a level 10–29 percent lower than in 1900. The average for social group II is stable but the median improves and is about 50% higher in 1950 compared to 1900, which indicates a significant improvement as well as a within-group equalisation. Incomes of the manual workers in group III stagnates between 1900 and 1920 but more than doubles from 1920 to 1950, in real terms. (For the equivalent calculations for the strategic sample, see Appendix B.)
Table 3. Income per social group, 1900–1950.
Income differences between the social groups (especially between groups I and III) are considerable in every benchmark year, but that they taper during the period. In median terms, the advantage of the local society elite in social group I compared to the manual workers in social group III decreases from a multiple of 7.8 – the median person in group I earned 7.8 times as much as the median person in group III – to 5.9 in 1920 and ‘only’ 2.2 in 1950. We know that 1920 was during a tough period in Swedish economic history, a time of high price increases which harmed not the least working-class consumers (cf. Häger, Citation1989, p. 270) and benefitted merchants; Häger (Citation1989, p. 416) quotes the saying that, in times of inflation, wages go by the stairs while prices take the elevator. Given this background, it is not surprising to see a weak income growth from 1900 to 1920 (In the strategic sample it looks even worse: see Appendix B).
After 1920 on the other hand, income growth was very good, especially for workers. In the strategic sample, the real median income of social group III grew by more than 70 percent 1920–1935 and grew further, by 60 percent, from 1935 to 1950. The development in Malmö also corresponds to Olsson’s (Citation1972, p. 61) investigation of Gothenburg, where he showed that low paid groups, such as female textile workers, saw a 350 percent increase to their market income from 1918 to 1960, while high income groups such as engineers and teachers saw only 75 and 45 percent wage increases respectively. The strong income growth – as evidenced in the strategic sample – from 1920 to the mid-1930s fits in with the notion that the 1930s and especially the Great Depression did not hit Sweden very hard, and that the country swiftly recovered (Schön, Citation2010, pp. 299–308). The GDP growth rate was 3.5 percent annually throughout the 1920s and 2.2 percent throughout the 1930s (Schön & Krantz, Citation2015), and it seems that at least on the urban level, most of the income growth was obtained by social groups II and III.
A final noteworthy trend in is the decline in the median real income development of social group I. This is especially interesting considering that Sweden did not take part in the world wars, which have been presented as a significant explanation for the drop in the top income share of national income throughout Europe, due to the destruction of capital (Piketty, Citation2020, pp. 477–479). Apparently, something else must account for the Malmö case of rapidly declining mean real incomes for social group I. The growth rate was not at all low in the 1930s and 1940s, and the other income segments saw substantial gains between 1935 and 1950, indicating that something specific affected the top income earners. The expansion of Swedish higher education was later than 1950 and hence cannot be the explanation for the fall in top incomes from 1935 to 1950 in terms of human capital (cf. Bengtsson & Molinder, Citation2021). Another factor often stressed in the decline of the top 10 has been the role of growing marginal taxes (Gustafsson & Johansson, Citation2003; Piketty, Citation2014; Roine & Waldenström, Citation2008), but all the tables so far have used the gross (before tax) incomes. We will get to the issue of taxes, but first we will use the strategic sample to break down further the incomes growth for the lower social groups in Malmö.
3.2. Occupational composition and incomes among the working class
The main driving forces of this decrease are in no way easy to dissect and pin down precisely for the four benchmark years, and we have no intention to provide a strictly causal analysis. However, aspects of the data can still generate some ideas about plausible mechanisms by which the changes in inequality proceeded. In and we have seen that income inequality in Malmö tapered significantly over the first half of the twentieth century, both in terms of the share of incomes accruing to various segments of the income distribution, and by social group. Simply put, the working class in social group III experienced a much better income growth than the local elites – professionals, entrepreneurs – in social group I. This begs the question: did social group III do so well as incomes per profession improved significantly, or rather because there was an upgrading of the employment structure within the group, from less qualified and lower paid jobs to more qualified and better paid jobs?
With the micro data we can indeed distinguish between these two forces, pay growth within a sector and an upgrading of the jobs structure. We will begin by describing and analyzing the composition of occupations. shows the composition of social group III, broadly speaking the working class, in our random sample (that is, representative of the city at large) in 1920 and 1950. We have divided social group III into 7 occupational groups, following the sector of work, but also a division between unskilled and skilled workers in industry (see Appendix B for a 12 group division). The tables also show the incomes for each group, but let us begin with the sheer numbers. There are three important compositional shifts in the Malmö working class from 1920 to 1950. One is that the share domestic workers fell (from 7.1 to 4.5%), and as we will see, this was even more important before 1920. Another is that within manufacturing, unskilled jobs were replaced by skilled jobs: the former category’s share decreased from 32.9 to 21.9 and the latter’s grew from 8.0 to 10.7 percent. A third trend is that relatively better paying occupations within construction and transport grew in importance. All three of these compositional shifts imply rising average incomes for social group III as a whole. Järnek (Citation1971) and Olsson (Citation1972) have shown the importance of growing wages for working-class jobs in Sweden in this period, but as we can see, the compositional shift is also very important (cf. Bengtsson & Molinder, Citation2022 on Stockholm.)
Table 4. The incomes of the working class in Malmö, 1920 and 1950, real terms.
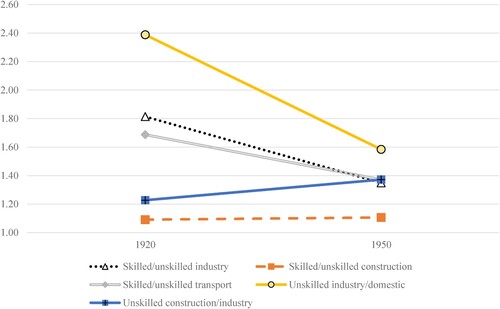
Let us further inspect the income differentials between sector among social group III. shows the key income differentials from . The graph shows that the single largest difference is that between the unskilled manufacturing worker, who is the one privileged in this comparison, and the domestic worker. The advantage of the manufacturing worker was 140 percent in 1920 and 60 percent in 1950. That is, the domestics’ share of employment fell, and their relative wages improved (from very low levels). Within manufacturing and within transport, skill differentials fell. Within construction, the skill differential was stable, which was unique among the differentials examined here. The 1920s, 1930s and 1940s were years of growing trade unionism and, in the 1930s, growing ambitions of solidaristic wage policies (Lundh, Citation2004, pp. 116–120; Molinder, Karlsson, & Enflo, Citation2021).
Figure 2. Income differentials by worker group, 1920 and 1950. Note. Calculations based on random sample; see . 1900 is not included since domestic workers and low-paid workers more generally rarely paid tax in this year.
Moving from the random to the strategic sample, the role of decreasing share in domestic work is further highlighted. shows that in 1920 and 1935, about one-fifth of social group III in the strategic sample consists of workers in other people’s homes. In 1905, these groups earned too little to pay income tax, and therefore show up in the row unknown, which in 1905 contains 41% of social group III, but only 30% in 1920 and 12–15% in 1935 and 1950. Due to the high share not paying tax in 1905 only 3 percent of social group III is registered as domestic service workers. The reason for the domestic service workers not being included are there very low incomes, excluding them from paying tax in 1905 and even if they show up in the 1920s tax records, they still do not pay income tax (only minor fixed sum taxes such as mantalstax). Because of the lack of data for service workers and the group unknown we have chosen to omit the income results for these groups in 1905 and 1920 as the lack of tax observations makes the numbers questionable in terms of how representative they are for the group at large. From 1920 and onwards the domestic service workers share decreased from 23 to 16 percent in 1935 and further declining to 5 percent by 1950. Thus, the results with the strategic sample reinforce the point made with : the upgrading of the workforce was an important driver of the growth in working class earnings, given the overall low incomes in the sector of domestic work. Similar evidence of working-class occupational upgrading resulting in overall lowered inequality is found in Stockholm (Bengtsson & Molinder, Citation2022) and Gothenburg (Olsson, Citation1972) strengthening that this phenomenon was occurring throughout Sweden's larger cities.
Table 5. The real incomes of the working class in Malmö, 1905, 1920, 1935 and 1950 from the strategic sample.
3.3. Women’s labour and household composition
One important driver of decreasing differences, as also pointed out by Järnek (Citation1971) and Olsson (Citation1972), is the growth in women workers’ wages in the interwar period. In the 1920s and 1930s it seems that changes in norms and technology both opened up more jobs for women. New machinery made physical strength in the industry less relevant; and women enjoyed improved levels of educational attainment (Stanfors, Citation2007, pp. 92–94; Svensson, Citation2003). Importantly in an urban setting as ours, clerk jobs expanded significantly and were often open for women. Compared to the domestic services where many women had worked before, this constituted a major upgrading of women’s’ work. shows the share who were women in the various occupational groups within social group III, that we used in and , but now also with a consideration of the skill differentials within each sector. As we can see, women were about 98 percent of domestic workers, about half of the unskilled industrial workers, and also roughly half of the service sector workers. Jobs as nurses’ aides, secretaries and clerks expanded significantly and paid better than domestic service or precarious work in the informal sector.
Table 6. Share of women in worker groups, 1920 and 1950 (random sample).
As a result, the gender wage gap decreased. In the strategic sample, the ratio of median male income to median female income decreased from 3.1 in 1905–1.9 in 1950. In the random sample, the multiple was 2.1 in 1920 and 1.9 in 1950. If we only look within social group III, in the random sample the gender differential was 2.1 in 1920 and 1.8 in 1950. In other words, the within-class gender differentials shifted at the same pace as overall gender differences.
The upgrading of women’s jobs came about at the same time as female labour participation increased overall (Järnek, Citation1971; Stanfors, Citation2007). We might then wonder how these changes affected the income distribution on the individual level – which so far is the only level we have looked at – but also on the household level (on the importance of the unit of analysis for results in studies of inequality, cf. Galbraith, Citation2019). Many researchers argue that the household level is more interesting than the individual level for judging inequality, since the household resources are pooled and the joint incomes of the household members taken together determine the consumption opportunities of those in the household. Järnek (Citation1971, p. 179) found that the increased female labour force participation in the interwar period equalised incomes on the individual level, but increased inequality on the household level, since only some households experienced increased female labour market participation. Can we find the same pattern in our data, or rather an equalising effect on the household level? show the results.
Table 7. Incomes and income differences per social group on the household level.
The overall picture is slightly different on the household level then the individual level. Inequality between social group I and III continues to grow up until 1935 on the household level, while the individual level sees decreasing inequality from 1905 and onwards. The differing trend on the household level can to a large extent be explained by the increased female labour participation among social group I, as these women had much lower incomes than their husbands, thereby dragging down the individual level average of social group I’s incomes in 1935 and 1950. Compared to the household level in which the male incomes make the per person within each household income much larger subsequently increasing the differences between social group I and III.
Another difference is how the average inequality measured trough the income ratio between social group I and III is lower with the household level in 1905 and 1920 at 6.2 and 10.5 compared to the individual level at 14.5 in 1905 and 13.7 in 1920. This is indicative of social group I having larger families and therefore the top income was distributed among a larger poll of less affluent family members, such as grandparents or young adults (above 15). However, by 1935 and 1950 family size (members older than 15) between the social group had reversed, social group I family size had diminished compared to social group III, subsequently providing higher inequality from the household level analysis in 1935 and 1950.
3.4. Taxation
So far, we have only discussed income distribution before taxes, but we know that taxes were an important mechanism of equalisation during the twentieth century (Gustafsson & Johansson, Citation2003; Piketty, Citation2014; Roine & Waldenström, Citation2008). For this reason, shows the impact of taxation on the income ratios between the social groups from 1905 to 1950. In 1905 and 1920, income tax was very low even for top income earners, thereby taxes had almost no impact on income inequality, and by 1920 social group I’s effective taxes had not changed. On average social group I paid 6 percent of total income in 1905–1920 while effective average taxes for social group II and III corresponded to 1–2 percent. However, by 1935 progressivity in the taxation system had risen, now the average effective tax rate was 14 percent for social group I compared to 3 percent for social group II and still below 2 percent for social group III. For the entire sample the after-tax incomes were 15 percent more equal between social group I and III in 1935. This was more than doubling the inequality decrease from taxes as the income ratio between social group I and III only decreased by about 6 percent from taxation in 1905 and 1920. This fits well with the findings of Henrekson and Stenkula (Citation2015) who argue that by the late 1920s and early 1930s taxation had become considerably more progressive in Sweden. In the following decades the welfare state and miliary expansions effect on inequality made a further dent, by 1950 effective marginal taxes had taken a jump as social group I obtained an effective tax rate of 38 percent compared to 22 percent for social group II and 14 percent for social group III. Resulting in progressive taxation lowering the income ratio between social group I and III by as much as 39 percent in the strategic sample in 1950.
Table 8. Income ratios before and after tax.
Nevertheless, even if taxes reduced inequality it only explains a minor part of the total income equalisation between 1905 and 1950. Between 1920 and 1935 increased progressive taxation account for only 8.4 percent of the total equalisation between social group I and III. Between 1935 and 1950 taxation constituted 19 percent of the total reduction in inequality. However, by 1935 75 percent of the entire equalisation for the period 1905–1950 had already occurred in the strategic sample. Meaning that the mechanisms of the 1935–1950 change are substantially less important for the big picture change in inequality in Malmö. These findings reinforce the view that taxes played a role for the Swedish income equalisation as suggested by Gustafsson and Johansson (Citation2003). Nevertheless, market incomes were much more important for explaining the equalisation in Malmö and Sweden; a conclusion also reached by Järnek (Citation1971) and Olsson (Citation1972), and Roine and Waldenström (Citation2008), who find that most of the reduction in the top 10 percent occurred before the emergence of the modern welfare state and high marginal tax rates.
3.5. Changing occupations among the elite
Finally, we will have another look at the income elite. As we have seen in , the real incomes of social group I had a slight negative trend between 1900 and 1950. Let us then look at the sources of the top incomes in Malmö during this period. If social group III’s growing incomes to a high degree was driven by an upgrading of their employment, is there any such change of employment structure also at the very top explaining their decline? shows the occupational composition of the top 25 incomes in our strategic sample, which oversampled the very rich, for each year. Merchants were important in 1905 and 1920 but not during the two latter years, while executives were an important share throughout the period analyzed. In 1950, the income elite was dominated by engineers and executives. Other occupations such as financiers had all but vanished from the very top by 1935, coinciding with the great depression. This might be indicative of how changing economic structures in the interwar and post-world war era benefit highly educated skilled personal over, for example, traders and company owners who had benefited from the high price inflation – and return to capital during the first decades of the twentieth century– but now struggled to keep up with new emerging elite occupations.
Table 9. Professional composition of the top 25 incomes every year
The results in indicate how engineering and management by the 1950s had become increasingly important skills while holding capital diminished as a decisive factor for yearly declared incomes. These findings indicate that typically capital-owning groups were replaced by highly skilled elite employees and managers at the very top of Malmö's income hierarchy. Seemingly the demise of merchants and manufacturers contributed to the overall fall of social group I/top 10 percent seeing that the new elites of engineers and managers were not as successful in obtaining incomes sustaining the gap between them and other income/social groups (observed in and Appendix B). To what degree this demise of the old groups of merchants and industry owners were the result of creative destruction or more politically/institutional oriented explanations will be critical topics for future research into the dynamics of the relative decline of the economic elite during the great levelling.
4. Conclusions
Our results for the city of Malmö indicate that inequality was very high in the early twentieth century, as our benchmark for 1905 and 1900 both shows and as suggested for Sweden overall by Roine and Waldenström (Citation2008), Bengtsson, Missiaia, Olsson, and Svensson (Citation2018) and others. The high level of inequality was sustained during the 1910s and early 1920s. Roine and Waldenström (Citation2008) seminal work demonstrate high levels during World War I, and given the above study of top incomes, it seems that the levels of those years were driven by the super profits of merchants and executives as inflation soared.
Inequality declined during the 1920s, the 1930s and the 1940s as the real incomes of the elite fell (as in Piketty, Citation2020, ch. 10). The broad pattern of aggregate inequality is not the most important contribution of the current study, but rather the contribution lies in the decomposition of how inequality decreased. Our results suggest that merchants lost out compared to their peak in the early 1920s, and engineers became more important. This is indicative of the Fordist industrial growth of Sweden in this period, which also caused the other half of the equalisation: the broad growth of wages and consumption power in the bottom half of the population. The results of our investigation into women workers and industrial growth concur with those of Järnek (Citation1971), who argued that trade union strength and industrial restructuring together helped to equalise the income structure, before the emergence of the high-tax society and the mature welfare state.
The emphasis on the rise and fall of low-paid jobs in domestic service suggests that further research on historical income distribution might fruitfully integrate the distribution of incomes with an analysis of job creation through the demand channel. When domestic servants could demand higher wages because of the availability of jobs in factories and offices, at the same time as the top earners experienced stagnating incomes, the labour market for domestic service experienced a squeeze from both the supply and the demand side (cf. Nordlund Edvinsson & Söderberg, Citation2010) – something which likely enhanced overall productivity and average income by moving labour into more productive jobs. Further research on historical income inequality could do well to integrate its discussion into patterns of job creation. Our results also indicate to integrate the analysis of gender differences into historical income inequality studies, something which has not been possible with tabulated data which has not included information on gender nor on household composition.
That market incomes for the top income earners fell between 1920 and 1950 indicates that lowered returns to capital in the 1920s could have contributed to the decreased inequality. Additionally, other factors emphasised in previous literature, such as stricter financial market regulation (Lindert & Williamson, Citation2016), and changing power relations in the labour market (Bartels, Citation2019; Collins & Niemesh, Citation2019; Gabbuti, Citation2021; Gómez León & de Jong, Citation2019) could have played a part in reducing the top incomes.
Estimating more precisely the contribution of each factor to market income equalisation is beyond the scope of this paper. However, we have shown the relevance of conducting further data gathering from tax records; this allows a more detailed analysis of the causes of this great levelling. Similar approaches of comparative cross-city analysis could be conducted by comparing Malmö to other industrial cities throughout Sweden in order to start estimating the role of for example structural change, human capital, unionisation, local politics for the market income equalisation. The research field of income inequality has not yet provided a complete explanation for the great levelling. However, conducting primary data gathering from tax records, as this paper has done, can provide new insights.
Disclosure statement
No potential conflict of interest was reported by the author(s).
Additional information
Funding
Notes
1 In the Malmö tax records deposed at the city archive, after 1931 total income is no longer accounted for but since the income tax was flat (in 1935: 1 percent) and the tax payment is recorded, one can multiply the tax rate to obtain a total income for 1935 and 1950. The total income in 1935 is based on estimating the tax rate in 1931, since this is the last year that contains both income and municipal taxes. For those with very low incomes we have adjusted for their tax deductions: for those who paid 9–12 SEK, the tax paid is multiplied by 150 to get the total income and for those who paid 3–9 SEK, we multiply by 200, and for those who paid less than 3 SEK, 400 times. By 1950 most people paid 8 percent in tax (Malmsten, Citation1994, p. 227) and therefore the sum of everyone’s tax is estimated by the x sum of municipal tax to /0.08 to obtain total income. To control the payment of 8 percent across the board, the 1948 tax records, which contain both total income and municipal tax, was used. Another unfortunate quirk of the lists at the Malmö City Archive is that only total income can be calculated, without division into labour, business and capital income.
2 According to Henrekson and Stenkula (Citation2015, Figure 1.4), only the very top faced steep marginal income tax rates by 1950. A worker with an income corresponding to 1.67 times the average production worker wage had a marginal tax rate of 28.7 percent. The maximum, however, was 73 percent. In 1935 the corresponding figures were 14.2 and 42.0 percent.
3 As in our strategic sample, some of the people on the taxation lists sampled stated no income and paid no tax. The number of actual taxpayers in the BMP sample is 812 in 1900, 2,809 in 1920 and 6,126 in 1950.
4 The districts are defined by the tax authorities themselves, except for Old town around Stortorget, which is an area within the official district Old town (Gamla stan). However Old town is very varied, with both top-income and low-income areas and therefore the specific top-income area around Stortorget is selected (cf. Häger, Citation1989, p. 425).
5 Following the Statistics Sweden social classification of three social groups with group I as company leaders, entrepreneurs and professionals, group II as the broad middle class of white-collar employees, small business owners and farmers, and group III as manual workers, in 1948 the composition of Malmö was 4.2% group I, 31.7% group II and 57.1% group III (Järnek, Citation1971). In our strategic sample for 1950, 11.7% are in group I, 14.4% in group II, and 65.9% in group III. As we can see, group II are under-represented while groups I and III are over-represented, which is beneficial to capture the developments at both ends of the income structure. In the random sample of 1950 6.9% are group I, 26.3% are group II and 66.8% are group III. We see the important difference in the share of group I in the random and the strategic sample. On the importance of the three group taxonomy in Sweden at this time, see Smedberg (Citation2022).
6 The quarters sampled are the following. Quarters in the Old City (around Stortorget): Quarter no.30 Sqvalperup, Quarter no.31 Mercurius, Quarter no.32 Jörgen Kock, and Quarter no.33 Skepparen. Quarters in Södervärn: only Quarter no.1 Abel. Quarters in Möllevången: Quarter no.5 Fanan, Quarter no.6 Gillet, and Quarter no. 7 Hagen. Quarters in Grönvången: Quarter. Grönvången, Quarter. Mariatorp, Quarter. Milano and Quarter. Neapel
7 Bengtsson and Molinder (Citation2022, ) show that in Stockholm, 35% of adults paid the bevillning income tax in 1900, 67% in 1920, and 81% in 1950.
8 Female incomes were in general half the male wage in Malmö (Järnek, Citation1971, p. 179). However, this was not evenly distributed along the income scale and therefore the female income is only 100 SEK less than 480 SEK, to account for the fact that gender income differences were not as wide in the bottom of the income distribution as they were at the top (Häger, Citation1989, pp. 418–419).
References
- Archives
- Malmö Stadsarkiv (MSA), Malmö city archive. Taxation records:
- Riksarkivet. Församlingsböcker 1906–1913: Kyrkoarkiv, Malmö S:t Johannes kyrkoarkiv. Available online: https://sok.riksarkivet.se/kyrkoarkiv?Arkivsok=malm%c3%b6&Lan=0&PageSize=100&Arkiv=SE%2fMSA%2f00617&tab=serie&Serie=0
- Riksarkivet. Församlingsböcker 1913-1922: Kyrkoarkiv, Malmö S:t Johannes kyrkoarkiv. Available online: https://sok.riksarkivet.se/kyrkoarkiv?Arkivsok=malm%c3%b6&Lan=0&PageSize=100&Arkiv=SE%2fMSA%2f00617&tab=serie&Serie=0
- Kronouppbördsböcker (inkomst- och taxeringslängder) 1862–1946: Uppbördsverket i Malmö 1, vol. 48-49 (year 1906)
- Kronouppbördsböcker (inkomst- och taxeringslängder) 1862–1946: Uppbördsverket i Malmö 1, vol. 53 (year 1908)
- Kronouppbördsböcker (inkomst- och taxeringslängder) 1862–1946: Uppbördsverket i Malmö 1, vol. 96-101. (year 1921).
- Kronouppbördsböcker (inkomst- och taxeringslängder) 1862–1946: Uppbördsverket i Malmö 2, vol. 321-346 (year 1936).
- Kronouppbördsböcker (inkomst- och taxeringslängder) 1947–1966: Uppbördsverket i Malmö 2, vol. 803-848 (year 1951).
- Literature
- Aaberge, R., Atkinson, A. B., & Modalsli, J. (2020). Estimating long-run income inequality from mixed tabular data: Empirical evidence from Norway 1875–2017. Journal of Public Economics, 187, 1–14.
- Atkinson, A. B. (2007). Measuring Top incomes: Methodological issues. In A. B. Atkinson, & T. Piketty (Eds.), Top incomes over the twentieth century: A contrast between European and English-speaking countries (pp. 18–42). Oxford: Oxford University Press.
- Atkinson, A. B., & Søgaard, J.E. (2016). The long-Run history of income inequality in Denmark. The Scandinavian Journal of Economics, 118(2), 264–291.
- Bartels, C. (2019). Top incomes in Germany, 1871–2014. The Journal of Economic History, 79(3), 669–707.
- Bengtsson, E., Missiaia, A., Olsson, M., & Svensson P. (2018). Wealth inequality in Sweden, 1750-1900†. The Economic History Review, 71(3), 772–794.
- Bengtsson, E., & Molinder, J. (2021). What happened to the rich during the great levelling? Evidence from Swedish Individual-level Data, 1909–1950. Lund Papers in Economic History No. 230, October 2021.
- Bengtsson, E., & Molinder, J. (2022). Incomes and income inequality in Stockholm, 1870–1970: Evidence from Micro Data. Lund Papers in Economic History; No. 240, September 2022.
- Bengtsson, E., Molinder, J., & Prado, S. (2022). Income inequality in Sweden 1870–1970: Evidence from micro data. Unpublished paper, Lund University.
- Bjurling, O. (1985). Stad i utveckling. In O. Bjurling (Ed.), Malmö stads historia – fjärde delen (1870-1914) (pp. 137–394). Arlöv: Berlings.
- Collins, W., & Niemesh, G. T. (2019). Unions and the great compression of wage inequality in the US at mid-century: Evidence from local labour markets. The Economic History Review, 72(2), 691–715.
- Edvinsson, R., & Söderberg, J. (2011). A consumer price index for Sweden 1290-2008. Review of Income and Wealth, 57(2), 270–292.
- Fridh, G., & Dahlberg, H. (1962). Kommunernas finanser. In S. U. Palme (Ed.), Hundra år under kommunalförfattningarna 1862–1962 (pp. 449–489). Stockholm: Svenska landskommunernas förbund, svenska landstingsförbundet and svenska stadsförbundet.
- Gabbuti, G. (2021). Labor shares and inequality: Insights from Italian economic history, 1895–19701. European Review of Economic History, 25(2), 355–378.
- Galbraith, J. K. (2019). Sparse, inconsistent and unreliable: Tax records and the world inequality report 2018. Development and Change, 50(2), 329–346.
- Gómez León, M., & de Jong, H. (2019). Inequality in turbulent times: Income distribution in Germany and britain, 1900–50. The Economic History Review, 72(3), 1073–1098.
- Gustafsson, B., & Johansson, M. (2003). Steps toward equality: How and Why income inequality in urban Sweden changed during the period 1925-1958. European Review of Economic History, 7, 191–211.
- Häger, BÅ. (1989). I skuggan av världskrig och världskris. In O. Bjurling (Ed.), Malmö stads historia – femte delen (1914–1939) (pp. 245–461). Arlöv: Berlings.
- Haldorson, L. (2016). Sociala grupperingar för nationellt och internationellt bruk. Stockholm: Statistiska centralbyrån.
- Henrekson, M., & Stenkula, M. (2015). “Swedish Taxation since 1862”. Dataset Retrieved December 16, 2021, from https://www.ifn.se/en/publications/books/2010-2017/2015/swedish-taxation-developments-since-1862/
- Järnek, M. (1971). Studier i hushållens inkomsterförhållanden 1925–1964. Lund: Skrifter utgivna av Ekonomisk Historiska föreningen i Lund.
- Lindert, P. H., & Williamson, J.G. (2016). Unequal gains: American growth and inequality since 1700. Princeton: Princeton University Press.
- Lundh, C. (2004). Wage formation and institutional change in the Swedish labour market 1850–2000. In C. Lundh, J. Olofsson, L. Schön, & L. Svensson (Eds.), Wage formation, labour market institutions and economic transformation in Sweden 1860–2000 (pp. 92–143). Lund: Lund University.
- Malmsten, B. (1994). Den kommunala förvaltningen i Malmö. In O. Bjurling (Ed.), Malmö stads historia – sjunde delen (1939-1990) (pp. 203–355). Arlöv: Berlings.
- Molinder, J., Karlsson, T., & Enflo, K. (2021). More power to the people: Electricity adoption, technological change, and labor conflict. The Journal of Economic History, 81(2), 481–512.
- Nordlund Edvinsson, T., & Söderberg, J. (2010). Servants and bourgeois life in urban Sweden in the early 20th century. Scandinavian Journal of History, 35(4), 427–450.
- Nyzell, S. (2009). Striden ägde rum i Malmö – Möllevångskravallerna 1926. En studie av politiskt våld i mellankrigstidens Sverige. Malmö: Holmbergs.
- Ohlsson, R. (1994). I kranens tidevarv. In O. Bjurling (Ed.), Malmö stads historia – sjunde delen (1939-1990) (pp. 13–151). Arlöv: Berlings.
- Olsson, K. (1972). Hushållsinkomst inkomstfördelning och försörjningsbörda – en undersökning av vissa yrkesgrupper i göteborg 1919–1960. Göteborg: Erlanders boktryckeri aktiebolag.
- Piketty, T. (2014). Capital in the twenty-first century. Cambridge, MA: Harvard University Press.
- Piketty, T. (2020). Capital and ideology. Cambridge, MA: Harvard University Press.
- Piketty, T., Saez, E., & Zucman, G. (2018). Distributional national accounts: Methods and estimates for the United States*. The Quarterly Journal of Economics, 133(2), 553–609.
- Roine, J., & Waldenström, D. (2008). The evolution of Top incomes in an egalitarian society: Sweden, 1903–2004. Journal of Public Economics, 92(1-2), 366–387.
- Roine, J., & Waldenström, D. (2010). Top incomes in Sweden over the twentieth century. In A. B. Anthony, & P. Thomas (Eds.), Top incomes in global perspective (pp. 299–370). Oxford: Oxford University Press.
- Scheidel, W. (2017). The great leveler: Violence and the history of inequality from the stone Age to the twenty-first century. Princeton: Princeton University Press.
- Schön, L. (2010). Sweden’s road to modernity – An economic history. Lund: Studentlitteratur.
- Schön, L., & Krantz, O. (2015). New Swedish historical national accounts since the 16th century in constant and current prices. Lund Papers in Economic History, 140, 1–27.
- Smedberg, C.-F. (2022). Klassriket: Socialgruppsindelningen som skillnadsteknologi under 1900-talet. Doctoral dissertation, Uppsala University.
- Stanfors, M. (2007). Mellan arbete och familj – Ett dilemma för kvinnor i 1900-talets Sverige. Stockholm: SNS förlag.
- Svensson, L. (2003). Explaining equalization: Political institutions, market forces, and reduction of the gender wage Gap in Sweden, 1920–95. Social Science History, 27(3), 371–395.
- Williamson, J. G. (2015). Latin American inequality: Colonial origins, commodity booms or a missed twentieth-century leveling? Journal of Human Development and Capabilities, 15(3), 323–341.
Appendices
Appendix A. The size of the strategic sample
presents a robustness check for the size of our sample. We doubled the size of the samples for the Stortorget and Södervärn areas in 1935, by adding further kvarter. As can be seen in the table, with the enlarged sample the estimated mean income for the Stortorget area declines by 12 percent from 2073 kr to 1823 kr. This highlights the fact that there is sampling error, but the fluctuation from doubling the sample is actually not very wide. For Södervärn the doubling of the sample makes even less difference: the estimated mean income grows by 7 percent. This indicates that incomes in a working-class area like Södervärn are more homogenous and less difficult to capture accurately with a small-size sample. As shows, the median incomes vary even less: in Södervärn, the estimated median grows by only 1 kr when the sample is doubled, and in Stortorget, the estimated median declines by 5.7 percent.
Table A1. Effects on the mean income in 1935 by enlarging the sample.
The small effects on estimates by doubling the sample in 1935 gives us faith that there is no need to enlarge the strategic sample.
Appendix B. Further calculations
presents median income per social group in 1905, 1920, 1935 and 1950 based on the strategic sample. The estimates here are thus comparable to those for the random sample in Table 3 in the main body of the paper.
Table B1. Median income per social group, 1905–1950: strategic sample.
Table B2. Median nominal/real income in the four districts of Malmö 1905–1950.
The income differences between the districts are very wide, as we would expect: the image of Möllevången and Södervärn as working-class and low-income districts (Nyzell, Citation2009) is confirmed, as is the view of Grönvången as the money aristocracy area (Häger, Citation1989, p. 424). The area with the most diverse trend is Stortorget, which had significantly higher mean incomes in 1905 but later came to deteriorate. Already by 1920, the area was experiencing mean incomes below those of the city as a whole, but still above those in the low-income districts.
In Tables 4 and 5 of the main paper we decompose social group III into 12 occupational categories. For concrete examples of the jobs we sorted into each category, se . The examples are directly derived from the taxation lists, where abbreviations were often used. So for example ‘järnsvarf.’ should be read as ‘järnsvarvare’ (iron turner), ‘serveringsbitr.’ as ‘serveringsbiträde’ (roughly waitress), and ‘arbk.’ as ‘arbetskarl’ (workman).
Table B3. The composition of the working class: taxonomy with 1920 examples.