
ABSTRACT
This paper surveys Nordic historic studies on the distribution of income to highlight similarities and differences between Denmark, Finland, Norway, and Sweden in the evolution of income concentration and income inequality over more than 140 years. Our descriptive analysis allows for a decomposition where we identify the contribution of the income share of the richest 1 per cent and the distribution of income among the other 99 per cent to overall inequality as measured by the Gini coefficient. The results show that the evolution of income concentration and inequality can be characterised by episodes rather than by secular cycles, which means that the evolution can neither be summarised by Kuznets’ inverse U nor by a U. The evidence on the role played by the share of the top 1 per cent for overall income inequality shows to be mixed and to vary across time and countries.
KEYWORDS:
JEL:
1. Introduction
Research on historical economic inequality has been a booming field in economics and economic history since the turn of the millennium, following the influential study on top income concentration by Piketty (Citation2003) and the country-specific papers published in two books edited by Atkinson and Piketty (Citation2007, Citation2010), which also include results for Finland, Norway and Sweden. However, while these studies have been limited to a description of the evolution of top income shares, recent Nordic studies have extended the perspective by focusing attention on the entire distribution of income.
The purpose of this paper is to provide a survey of the evolution of concentration of income and income inequality in the Nordic countries. Due to insufficient historical data for IcelandFootnote1 we have limited our discussion to the four remaining Nordic countries: Denmark, Finland, Norway and Sweden.
Different aspects of the historic evolution of income inequality in the Nordic countries have been subject to empirical research over the past 150 years. Therefore, it would not come as a surprise if some of the papers provide conflicting results. However, even though this does not appear to be the case several of the papers in question show to differ regarding definitions of unit of analysis, income, and population simply because they might have had a more limited scope than studying the overall country-specific distribution of income. Since the purpose of the present paper is to compare the long-run evolution of income inequality across the Nordic Countries we have chosen to restrict the survey to empirical results from the country-specific papers which provide the longest series for the Gini coefficient and/or the top income shares and moreover meet acceptable requirements for comparability.
The cross-country comparisons presented in this paper rely on the empirical results provided by Atkinson and Søgaard (Citation2016) for Denmark, Roikonen (Citation2022) for Finland, Aaberge, Atkinson and Modalsli (Citation2020) for Norway and Roine and Waldenström (Citation2008, Citation2010) for Sweden. The results of these papers have been obtained by combining historical tax-based income tabulations with official statistical figures for total income and total population, an approach pioneered by Kuznets (Citation1953) and continued by Atkinson and Piketty (Citation2007, Citation2010). These studies have provided descriptions of the evolution of the concentration of income, i.e. the evolution of the share of total income received by the top 1, top 5 and top 10 per cent of the income distribution. The top income studies provide valuable information on the concentration of income and economic power in the society but ignore how income is distributed among the remaining 99, 95 and 90 per cent of the population. However, to provide a complete description of inequality over the entire distribution of income it is required to account for all income differentials in the population. To this end, it will be convenient to use a measure of overall inequality like the Gini coefficient. In this paper we present the evolution of the overall income inequality as well as income shares of the top 1 per cent for the mainland Nordics. We will pay attention to both similarities and differences in the long-run trends and discuss plausible explanations for the observed patterns since the late nineteenth century.
The paper proceeds as follows. Section 2 gives a brief overview of the present research on long-run income inequality in the Nordic countries. Section 3 discusses important measurement issues which concern the degree of comparability across time and countries. Section 4 presents the long-run comparison of the income distributions, both measured by top income shares and by the Gini coefficient. Section 5 concludes.
2. An overview of research on long-run income inequality in the Nordic countries
The results of the studies that form the basis of this survey have been obtained by using same data sources and similar methodology as Kuznets (Citation1953) and Piketty (Citation2003); see Section 3 and the Appendix for methodological details. This new school of long-run inequality studies took off in the early 2000s where focus was on top income concentration in France, the United States and other countries, many of them compiled in the edited volume Top Incomes over the Twentieth Century (Atkinson & Piketty, Citation2007). This volume did not include results for the Nordic countries, but when the top incomes project was extended with the 2010 edited volume Top incomes in a global perspective (Atkinson & Piketty, Citation2010), three of the Nordic countries were added: Finland (Jäntti et al., Citation2010), Norway (Aaberge & Atkinson, Citation2010) and Sweden (Roine & Waldenström, Citation2010). Denmark was added to this literature with Atkinson and Søgaard (Citation2016).
Atkinson and Søgaard (Citation2016) focused on the distributions of income before tax and estimated the associated Gini coefficient and top income shares for 1870, and 1903, 1908, 1915, 1917–2010. These tax data had previously been used for various sub-periods by several authors, including Bjerke’s (Citation1957) study of the 1939–1952 period. Sørensen (Citation1989, Citation1993) tied together these periods and covered almost the entire twentieth century. For Finland, Jäntti et al. (Citation2010) used tabulated taxation data from 1920–2003 and micro data from surveys for 1966–2004 to estimate series of top income shares. This study has been followed by Roikonen and Heikkinen (Citation2020) and Roikonen (Citation2022), who estimated both the Gini coefficient and top income shares for the periods 1865–1934 and 1865–2019, respectively, adding a longer historical time span and by combining the state income tax as a source with municipal tax data and surveys from a few rural communities to make the estimates more precise. In the Norwegian case, Aaberge and Atkinson (Citation2010) used tax-based tabulations of income by ranges in combination with some additional aggregate data sources to produce comparable series of top income shares for more than 130 years, starting in 1875 where the industrial revolution gained momentum and ending with the period where Norway became an oil and gas exporter. Aaberge, Atkinson and Modalsli (Citation2020) extended this study by considering the entire yearly distributions of income and estimated the associated Gini coefficient for the period 1875–2017 by combining tax-based tabulations of income by range with poverty statistics and some other historical statistical sources. For Sweden, Roine and Waldenström (Citation2008, Citation2010) estimated series of top income shares by building on tabulations of the national income tax which was implemented in 1903.
Of course, the important contributions of the present literature have predecessors. For Denmark, Atkinson and Søgaard (Citation2016) relied on more detailed tax tabulations than previous studies but acknowledged the importance of Sørensen’s (Citation1989, Citation1993) work and data for their own study. While Sørensen relied on after-tax measurement of income, Atkinson and Søgaard (Citation2016) focused on the distributions of income before tax, which is in line with the standard approach in earlier studies. In the Swedish case, Isidor Flodström (Citation1907), one of the pioneers of Swedish economic statistics, had already in the first two decades of the twentieth century compiled data from the early years of the income tax, and Roine and Waldenström incorporate Flodström’s calculations. Ragnar Bentzel ( Citation1952) provided another earlier study built on tax data.
There has also been a more diverse set of previous studies, with different methods and approaches. Research on the evolution of income inequality in Norway was started by the American economist Lee Soltow, who visited Norway in the early 1960s to collect tax records from eight cities in southern Norway for selected years between 1850 and 1960. The eight cities accounted however solely for 17 and 8.4 per cent of the urban population in 1860 and 1960. Soltow (Citation1965) estimated series of Gini coefficients based on samples of tax records drawn by himself. These Gini series were later extended until 1990 by Mjelve (Citation1998). Furthermore, Fjære (Citation2014) studied the evolution of income inequality for a selected group of municipalities which differed by geographic location, population size and dominating business sector, while Kvile (Citation2017) studied changes in regional inequality and social welfare from 1875 to 2015.
In Sweden, earlier studies of income distribution have explored various aspects of inequality, looking only at burghers in cities (Lindberg, Citation2007), or a heterogenous mix of wages, rents and other series (Söderberg, Citation1986), or some very rough, subjective nineteenth-century approximations (Soltow, Citation1989). However, there is also one set of studies of Swedish long-run inequality which merits special attention here. These are the city studies based on historical tax records: Järnek (Citation1971) on Malmö 1925–1964, Olsson (Citation1972) on Gothenburg 1918–1960, Gustafsson and Johansson (Citation2003) on Gothenburg 1925–1958, and Bengtsson and Molinder (Citation2022) on Stockholm 1870–1970. These studies used the same type of sources as Roine and Waldenström but relied on the individual tax records rather than on the available aggregated tax-based tabulations of income by range. Since this approach is much more labour intensive it has been required to limit the study to smaller geographical areas as well as to fewer years. This means that it is difficult or even impossible to compare developments in a city such as Malmö or Gothenburg with developments in Denmark as a whole or Norway as a whole. In this survey, we focus on the national level; in further research, comparisons between cities and rural localities in different countries could be an interesting route forward to tease out different dimensions of inequality in the Nordics.
3. Data and methodological issues
As indicated above, for periods prior to the establishment of micro-data in the 1960s and 1970s, the most informative data sources for the distribution of income in the Nordic countries are tabulations of tax-payers’ incomes by income ranges. However, as the tax information due to changes in the tax system might vary in coverage from year to year and moreover normally excludes non-taxpayers, comparable estimates of income distributions across time requires use of additional data sources. Thus, most studies combine income tabulations with official statistical sources for total income and total population (referred to as control totals by Atkinson, Citation2007). This means that estimates of the income share of the top 1 per cent refer to the richest per cent of the total population in question and their share of total income, while the estimated Gini coefficients provide information on overall inequality in the distribution of total income for the same population.
Next, we will provide a summary of data sources and basic definitions used for the descriptive analysis in each of the four countries. For further details and discussions of data sources and justifications for methodological choices we refer to the selected country-specific key papers.
3.1. Data
Micro-data on income from surveys and register data, first became available in the 1960s and 1970s in the Nordic countries. By contrast, the historical taxed-income tabulations used by Atkinson and Søgaard (Citation2016), Roikonen (Citation2022), Aaberge, Atkinsonand Modalsli (Citation2020) and Roine and Waldenström (Citation2008, Citation2010) had their origin before World War One in all the Nordics. In Denmark, the first tabulation is from 1870, which is 33 years before a permanent nationwide central government income tax was introduced. The 1903 tax-based tabulation was followed by similar tabulations in 1908, 1915, and 1917–1979. From 1980 onwards Statistics Denmark has made micro-data from tax records available on computer files. The historic tabulations in Denmark stand out as detailed, especially at the top of the income distributions. For many years, the tabulations contain 30 or more income brackets.
In Finland, tabulations for 1865, 1871, 1876, and 1880 have been collected from the central government tax assessment, while the data for 1898, 1899, and 1904 originate from municipal tax assessments. The 1865–1880 tabulations are based on 7 income brackets, while the 1898–99 and 1904 tabulations are more informative, with 19–20 income brackets for rural areas and 16 for the cities. Tabulations after 1919 are very detailed with minimum 40 income brackets. In Norway, the first tabulations of taxable incomes were given by Kiær (Citation1892) for 1859 and by Soltow (Citation1965) for 1845 and 1855, but these tabulations cover only selected towns and cities. The first nationwide data set is from 1875. Income tabulations were then published for 1888, 1892–1903, 1906, 1910, 1913–14, 1929, 1938, 1948–1966. Thus, there are 18 tabulations of annual income by range for the pre-World War 1 period. The early tabulations were made for parliamentary inquiries to extend the informational basis for evaluating the design of the central government tax that was implemented in 1892. From 1952, the tabulations are more detailed, and from 1967 onwards micro-data from tax records have been available on computer files at Statistics Norway. Moreover, aggregate data on taxpayers and assisted poor have been used for the entire period 1892–1951 and on social assistance from 1952 onwards. For Sweden, Roine and Waldenström (Citation2010, p. 302) indicate that their ‘data on income distribution come mainly from the income statistics published yearly by Statistics Sweden starting in 1943, and for the period before that from scattered public investigations.’ The data are yearly from 1943, and before that encompass the years 1903, 1907, 1911, 1912, 1916, 1919, 1920, 1930, 1934, 1935, and 1941. The early years are from Flodström’s studies.Footnote2 With the long-term span, all historical studies of the income distribution face methodological challenges, which will be discussed in the next section.
3.2. Basic definitions and methods
Atkinson and Piketty (Citation2007, pp. 532–539) highlight three basic methodological choices which strengthen the comparability of long-run distributions of income:
The unit of analysis – individual or family
The definition of taxable income
The treatment of non-taxpayers.
A brief discussion of these three issues will be given in this section. For further details on country-specific differences we refer to the Appendix. As shows, due to the design of the income tax systems in each country and the systems’ changes over time, the unit of analysis might have varied between family, household, and individual. Unfortunately, historic data based on tabulations of taxable income do not allow alternative calculations based on alternative choices of the unit of analysis, which makes it hard to evaluate the effect of changing the unit of analysis from e.g. family to individual. Whether it is the household/family or the individual as unit of analysis that produces the largest inequality estimates will depend on the degree of inequality within families with two (or more) income earners. In the contemporary debate, for example, Galbraith (Citation2019) argues that the rise in US income inequality is exacerbated if one uses the individual as the unit of analysis; he argues that in low-income households, it is common to have at least two income-earners, thus improving the living standards for the poor, compared to the picture given by individual-level statistics. Given the long-term perspective of the studies discussed here, migration from rural to urban areas and the associated decline of family agriculture as a major way of live and subsistencet form an important part of the historical contrext. Thus, the relationship between unit of analysis and estimates might have changed over time.Footnote3 However, as we can see in , there are shifts from a household-level to an individual level in Denmark in 1970 and Sweden in 1950, and we can preview the results and say that none of these two shifts appear to change the trend of the inequality measures (But the levels changed).
Table 1. Summary of basic definitions.
The measure of income, taxable income, is consistent across the studies, and should not pose a comparative problem except for the lower tail of the distribution due to significant changes in the threshold for taxable income. The third issue, how the incomes of non-taxpayers is calculated, is possibly more problematic (Atkinson, Citation2007). In historical contexts, large shares of the adult population did not pay income tax, as the minimum threshold to pay the tax exceeded the incomes of many adults (Even in the US today, about a third of adults do not pay income tax: Splinter, Citation2019). This means that in the tax-based studies of income distribution, incomes of non-taxpayers might either be inferred by the discrepancy between taxed income and all personal income, or by using other sources for non-taxpayers. For example, Aaberge, Atkinson and Modalsli used social assistance data to estimate incomes of non-taxpayers, while Roine and Waldenström used a comparison of taxed income with national accounts income totals.
4. Cross-country comparisons of the evolution of top income shares and overall income inequality
The income share of the top 1 per cent cannot be considered as a complete measure of income inequality, because this measure is insensitive to how the income among the bottom 99 per cent is distributed.Footnote4 The crucial condition – Pigou-Dalton’s principle of transfers – states that an income transfer from a richer to a poorer individual reduces income inequality, independent of where in the distribution of income the transfer takes place. Thus, in this paper we will distinguish between top income shares and inequality and limit the use of the term inequality to the results for the Gini coefficient.Footnote5
Note that the income share of the top 1 per cent is of interest in itself since it provides crucial information of the accumulation of income at the top of the income distribution. Thus, knowledge of the evolution of top income shares might also contribute to our understanding of driving forces behind changes in overall inequality. To this end, Section 4.3 will provide results of a decomposition of the overall Gini coefficient with regard to the contribution from the income share of the top 1 per cent and the Gini coefficient of the remaining 99 per cent of the population.
4.1. Income share of the top 1 per cent
Atkinson (Citation1997) indicated already 25 years ago that analyses of determinants of inequality that solely focused on deterministic theories about the long-run evolution would miss ‘key distributive episodes’. This admonition has been taken up in the recent literature by Gómez León and Gabbuti (Citation2020) in their study of Italy, and by Aaberge, Atkinson, et al. (Citation2020, p. 11) in their study of Norway, where they suggest that the long-run evolution of income inequality in Norway is best characterised ‘as a series of episodes identified with sub-periods’.Footnote6 It appears attractive to adopt this specific episodical approach in our discussion of the income share of the top 1 per cent as well, as there are remarkable similarities in the movements of the top 1 per cent shares in the series for all four countries from the early nineteenth century till the early 1990s: periods of more or less rapid change are interchanging with periods of stability. The long-run pattern is shown in .
Figure 1. Income share of the top 1 per cent in the Nordic countries, 1865–2017.
Note: Data for Denmark from Atkinson and Søgaard (Citation2016), Finland from Roikonen (Citation2022), Norway from Aaberge and Atkinson (Citation2010) and Aaberge et al. (Citation2020), Sweden from Roine and Waldenström (Citation2010, tab 7.A.2).
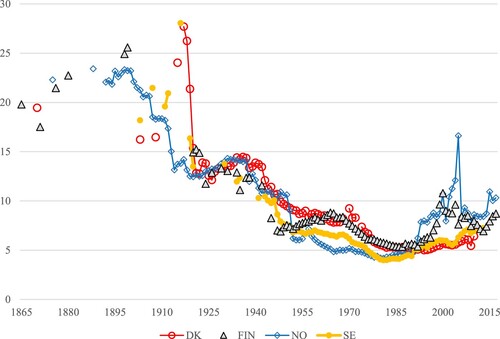
The first episode or sub-period ranges from the 1860s–1870s to the early 1900s. The observations in 1865/70/75 show that the top 1 per cent in Denmark, Norway and Finland received between 20 and 25 per cent of the total income and that this percentage was maintained in Norway and further increased in Finland until the turn of the century. The fall in the share of the top 1 per cent in Norway from 23 per cent in 1900 to 13 per cent in 1914 has been explained as a consequence of the aftermath of the Kristiania crises, where real estate and the financial sector faced significant losses (see Gerdrup, Citation2003, p. 8–10 and Statistics Norway, Citation1995 1955, pp. 57–58).Footnote7 By contrast, financial crises in the 1990s in Finland and Sweden were associated with rising inequality, so the connection between financial crisis and inequality is not unambiguous. Unfortunately, the early period is not well covered by Danish and Swedish data, except for a single Danish observation in 1870. Moreover, as indicated by Atkinson and Søgaard (Citation2016, p. 275) the fall in the estimated share of the top 1 per cent from 1865 to the early nineteenth century should be interpreted with caution due to comparability problems. Thus, we cannot draw an unambiguous conclusion on Nordic top income concentration in this period, but it does at least appear that the pattern does not support the idea of a uniform ‘Kuznets’ process of increasing inequality during industrialisation (cf. Bengtsson & Molinder, Citation2022).
The second episode covers the First World War. Unfortunately, there are no Finnish data for the war years, but the results for the three other countries as well as for some other European countries (cf. Gómez León & de Jong, Citation2019 on Germany and Britain) show different patterns. For Sweden and Denmark, but not for Norway, we see a dramatic increase in the share of the top 1 per cent during the First World War. Atkinson and Søgaard (Citation2016, p. 283) remark regarding the similarity between Denmark and Sweden: ‘while the increase in one country might be dismissed as a statistical anomaly, the fact that the sharp rise is found independently in both countries suggests that something dramatic indeed happened during World War I’. As explanation of the Danish development during WW1 they suggest that the Danish government underestimated the duration of the war and acted only slowly to impose measures such as
rationing and price/rent control. Furthermore, the unions and employer organizations had in 1911 settled on a five-year collective agreement, which more or less dictated the nominal wage growth until 1916; this resulted in a large drop in real wages.
Roine and Waldenström’s (Citation2010, p. 319) discussion of Sweden is not dissimilar, even though they do not discuss institutions and policies in detail. They point to the record profits recorded during the WW1 years and point to that 1916 is the peak both in the capital share and in the income share of the top 1 per cent. Looking outside of the Nordics, the suggestion that policy choices mattered for the evolution of inequality during WW1 is also supported by Gómez León and de Jong’s (Citation2019) comparative study of Germany (where inequality increased drastically during the war) and Britain (where inequality decreased).
Although the income share of the top 1 per cent in Norway only rose by 1 percentage point from 1914 to 1917, the war had also created a boom to Norway’s economy in shipping, mining, and fish exports. As demonstrated by Aaberge et al. (Citation2020) the boom in Norway gave however greater payoff for the next 9 per cent of the top 10 per cent, who increased their share of the total income by 3 percentage points while the income share of the top 50 per cent rose from 85 per cent in 1914 to 92 per cent in 1917. In other words, the bottom half of the income distribution did not benefit from the war boom. By contrast, growing income concentration was more top driven in Denmark and Sweden: the share of the top 1 per cent in Denmark rose by 4 percentage points, from 24 to 28 per cent, (see also Abildgren, Citation2019 on nouveaux riches in Denmark during the war) and in Sweden by 8 percentage points, from 20 to 28 per cent.
The third sub-period is the 1920s. The boom in 1916/1917 was followed by a recession in all countries, where the income of the rich people declined and the income shares of the top 1 per cent in Denmark, Norway and Sweden ended up around 12–13 per cent in the early 1920s. In the deflationary years in the early 1920s as the Scandinavian countries prepared to return to the gold standard, the financial sector suffered, and capital gains were reduced compared to the large top income shares at the end of the WWI (See for example Lönnborg et al., Citation2011 on the banking crisis in Sweden). The evolution of the top 1 per cent share, however, changed much less during the 1920s than suggested by the standard interpretation of the consequences of the economic crises in this period. shows that the share of the top 1 per cent had a weak upward trend in Denmark, Norway and Sweden during the 1920s, whereas Finland experienced a clear downward trend. The turbulence of the late 1910s, and the unaffected income concentration during the economically turbulent years of the first half of the early 1920s warrant further research.
The fourth sub-period is the 1930s. Did the Great Depression matter for concentration of income in the Nordic countries? Roine and Waldenström (Citation2010, p. 308) show that Swedish top income shares declined during financial crises due to falling capital incomes. They exploited a peculiar feature of the Swedish tax system between 1911 and 1948, where income was jointly taxed with wealth, to show that top wealth shares fell markedly in the early 1930s: the wealth share of the top 1 per cent fell from 50 per cent to 43 per cent, and the income share of the top 1 per cent fell from 38 per cent in 1930 to 26 per cent in 1934. Decreasing wealth among the affluent people entailed lower capital incomes in the following decades and was then – especially from the 1940s onwards – exposed to progressive taxation, which hampered accumulation at the top. Roikonen (Citation2022, p. 243) points specifically to falling capital incomes as a contributing factor of decreasing concentration of income in the 1930s and 1940s in Finland. In Denmark and Norway, the trend with slightly rising income shares of the top 1 per cent continued during the 1930s. There is no explanation in the literature for these differences between Sweden and Finland, on the one hand, and Denmark and Norway, on the other hand, and the evolution of incomes and their concentration in the 1930s as well as the 1920s appear as highly relevant topics for further research.
The fifth distinct period includes the Second World War and the postwar period. For Denmark, Norway and Sweden the share of the top 1 per cent fell steadily from respectively 14, 12 and 10 per cent in 1940 to 6, 4 and 4 per cent in 1980. The decline in top income shares in Denmark and Norway during WWII has partly been explained by the control imposed on the economy by the German occupants, which reduced the income opportunities of most capital owners. Atkinson and Søgaard (Citation2016, pp. 283–284) contrast the decline of top income shares during the Second World War in Denmark with the increase during WW1 and explain the difference with more rapid government interventions and collective bargaining. This interpretation may also be supported by a comparison between the occupied Denmark and Norway, on the one hand, and neutral Sweden, on the other. The top 1 per cent’s share decreased from 14 per cent in 1940 to 11 per cent in 1945 in Denmark and from 12 per cent to 11 per cent in Norway, while it was rather stable in Sweden.
After the second world war, the reduction in top income shares in Denmark, Norway and Sweden coincides with the strict post-war economic policy regime and very high marginal tax rates. In this period, Finland was an outlier. In Finland, top income shares rose between 1948 and 1964. Roikonen (Citation2022) points to a conservative tax policy from the late 1940s to the mid-1960s: top income tax rates peaked in the late 1940s, then declined until the mid-1960s when redistributive ambitions grew again. By contrast, in Sweden the progressivity of income taxation increased significantly during the 1940s, 1950s and 1960s, until a peak in the early 1980s. According to Roine and Waldenström (Citation2010, pp. 322–324) the increased progressivity played a crucial role for the fall in top income shares in the postwar period. Similarly, Atkinson and Søgaard (Citation2016, pp. 285–289, quote 286) found for Denmark that top marginal tax rates rose ‘quite substantially’ from the 1930s to the 1950s but argue that this cannot be the main explanation of the decrease in top group shares of pre-tax incomes, as this would ‘imply unrealistic labour supply elasticities vis-à-vis the income tax’. We may add that if capital incomes dominated the top 1 per cent, as they tend to do, then the labour income tax is less credible as an explanation for the decrease in the top 1 per cent share.
A sixth important period in the modern history of income inequality begins around 1980, when concentration of income started to increase significantly at least in the United Kingdom and the United States (cf. Atkinson & Piketty, Citation2007, Citation2010). Among the Nordics, the early 1980s represents a turning point for Norway and Sweden with rising income shares for the rich, whereas they continued to decrease in Denmark and reached 5 per cent in the early 1990s. The evolution in Finland was more alike Denmark, with stability during the 1980s, where the top 1 per cent received 5–6 per cent of the market income. The turning point with increasing top income shares arose in the 1990s. The rise in top income shares has varied in intensity and has been more marked in Norway than in Sweden. The top 1 per cent share in Norway and Sweden increased from 4 per cent in 1980 to respectively 9 and 7 per cent in 2010,Footnote8 while it increased by 1 percentage point from the early 1990s to 2010 in Denmark. In Finland, the top 1 per cent share has grown from its level around 6 per cent in the 1980s to 8–9 per cent in the second half of the 2010s. The lowest level was lower in Norway and Sweden than in Denmark and Finland, and the increase from these levels was more intense in those two countries, especially in Norway. This difference is discussed in more detail in Section 4.2.
Waldenström (Citation2009, pp. 17–18) discussed the fact that while the Great Depression had a declining effect on economic inequality in the United States, the deep financial crisis in Sweden in 1991–93 did not break the trend of increasing concentration of income and wealth; top wealth shares immediately fell in 1990–92 but soon rose again, while top 1 per cent shares of income rose throughout the crisis and continued to rise afterwards. Of course, Finland suffered an equally troubling recession in the early 1990s, and Roikonen (Citation2022, p. 245) found that market income inequality increased in Finland during the crisis, even if he also show that increased redistribution meant that inequality of disposable income did not rise in the same way. During the second half of the 1990s inequality grew, also after a tax reform in 1993 which decreased the tax burden for top earners and allowed them to shift incomes from labour income to capital income.
4.2. Overall inequality
displays long-run Gini coefficients for Denmark, Finland and Norway, while only post-1970s series have been available for Sweden. The summary of provided by shows that the late 1800s to 1914 covers the first episode, as was also the case for the share of the top 1 percent. The Gini coefficient was extremely high in both Denmark and Norway during this period – indeed, until the late 1930s, the Gini coefficient was found to be in the range of 0.60 plus-minus 0.05 for Norway and 0.56 plus-minus 0.05 for Denmark.Footnote9 The discrepancy between Denmark and Norway, on the one hand, and Finland on the other opens for further discussion. The estimated Gini coefficient for Finland from Roikonen and Heikkinen (Citation2020) varied between 0.40 and 0.50. The assessed low levels of inequality in Finland during the 1860s and 1930s corresponds to the lowest levels of inequality attained over the equalisation period after the Second World War in Denmark and Norway, which suggest that the Gini series for Finland from 1865 to the mid-1930s might suffer from weak comparability. By contrast, the levels and evolution of the shares of the top 1 per cent are approximately identical for Finland and Norway over this period, which suggest that the estimates of the Gini coefficient for the distribution of the ‘other 99 per cent’ might be downward biased in Finland.
Figure 2. Estimates of the Gini coefficient in the Nordic countries, 1865–2018.
Note that the y-axis is cropped at 0,30. Source for Denmark is Atkinson and Søgaard (Citation2016), mean of the upper bound and the lower bound series. Source for Finland is Roikonen (Citation2022), 60 per cent assumption for non-filers. Roikonen’s data cover the 1866–2004 period; for 2005–2019 we have extrapolated the Gini from the 2004 level using the changes in the OSF Gini estimates also included in Roikonen’s dataset. Source for Norway is Aaberge et al. (Citation2020), displayed as mean of upper and lower bounds. Source for Sweden is SCB, ‘Indikatorer inkomstfördelning, disponibel inkomst och faktorinkomst per konsumtionsenhet, familjeenheter, 1975–2013 , 2020-års priser’.
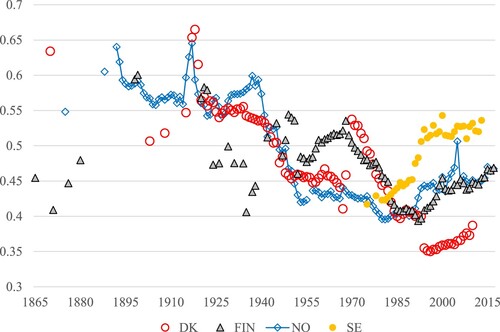
Table 2. Summary of the evolution of overall income inequality.
As is well known Scandinavian emigration to America was very high during the late nineteenth and early twentieth century. In terms of the proportion of the population who emigrated in the 1870–1910 period, Norway (5.25 persons per 1000 people per year) and Sweden (4.20) were after Ireland (11.24) and Italy (9.25) the most emigration-intensive countries in western Europe (Taylor & Williamson, Citation1997, ). Emigration from Denmark and Finland was less intense. Several studies have proposed that the loss of parts of the labour force through emigration to America pushed up wages in Scandinavia (Ljungberg, Citation1997; cf. Taylor & Williamson, Citation1997). This would have egalitarian consequences, but the causal connection to overall inequality has not been demonstrated in a convincing way. Of course, this is a very demanding research issue. Several scholars, including Magnussen and Sigveland (Citation1978), have emphasised data limitations as challenges associated with causal interpretations. Moreover, Abramitzky et al. (Citation2012) found that the return to migration for Norwegian immigrants to the US was relatively low and that migrant selection appeared to both be positive and negative. Thus, the distributive implications for Norway are unclear.
It is of course not possible to draw any conclusions on this matter from . From the existing inequality data, Finland experienced rising inequality from the 1860s to the early 1900s, while Denmark had a steep fall in inequality from 1870, and Norway not much of a trend at all – if anything, rising inequality from 1880 to the early 1900s which was followed by a decline in inequality. The mixed evidence, and the lack of results for Sweden, do not suggest any clear pattern as a result of the mass emigration. However, it would be a fertile topic for further research, perhaps using comparative designs within countries, between high-emigration and low-emigration areas (For an investigation of the effects of emigration on politics with a modern econometric design see Karadja & Prawitz, Citation2019).
There is a remarkable similarity in the evolution of overall inequality in Norway and Denmark over the period 1915–1970. This begins with our second episode, the First World War. The steep rise and fall in inequality during the First World War are very similar, although this was not the case for the shares of the top 1 per cent (see ). The spike in overall inequality was due to a significant economic boom in 1916–17, where the income growth mostly benefitted the wealthiest people in Denmark and the upper middle class in Norway. The boom was followed by a recession in the first half of the 1920s with high inflation, trade deficits and currency depreciation. During the recession, the incomes of the rich declined and inequality returned to its pre-war level. In Denmark, the Gini coefficient rose by 22 per cent from 1915 to 1918 and fell by 15 per cent from 1918 to 1920, while in Norway the Gini coefficient rose by 15 per cent from 1914 to 1917 and fell by 13 per cent from 1917 to 1920.
The third and fourth episodes, the 1920s and 1930s, yield somewhat surprising results, in that there are no strong trends. During the late 1920s and the 1930s, inequality was remarkably stable in Denmark and slightly rose in Norway.
The fifth episode, the Second World War and its aftermath, is more eventful in Denmark and Norway when it concerns the evolution of the Gini coefficient. There was a substantial fall in inequality from the beginning of the Second World War to the early 1950s in both Denmark and Norway. The equalisation during the Second World War was partly a result of increased labour demand and larger income for the bottom half of the income distribution. Moreover, the German command economy led to limited income opportunities for most capital owners in both countries, which as indicated by Aaberge et al. (Citation2020) can explain the significant fall in the Gini coefficient for the distribution of income among the richest half in Norway. The continuation of the decline in inequality during the early post-war period is associated with high marginal tax rates and the strict economic planning regimes that were introduced in both countries during this period. The war experience might also have made Danish and Norwegians more receptive to the strict economic planning regime that was introduced during the early post-war period (Espeli, Citation2013). Conversely, Finland with its more conservative tax policy in the post-war period saw no sustained reduction in the Gini coefficient until after 1967. The Gini coefficient fluctuated around a rather high level, around 0.50, during the 1940s and 1950s (Roikonen, Citation2022).
Inequality kept almost unchanged between 1953 and the early 1990s in Norway, whereas a break in the Danish Gini series in 1970 due to change in definition of unit of analysis (from family to individual) weakens the comparability of the Gini estimates before and after 1970. The individual based Ginis are significantly higher – 0.54 in 1970, compared to 0.46 for the family-based Gini in 1968. From 1970, however, inequality fell quite sharply in Denmark, from 0.54 in 1970 to a low mark around 0.35 for the years 1995–1998. Norway saw a smaller decrease from a Gini around 0.43 in the early 1970s to levels around 0.40 in the 1980s. In Norway the increase started in 1991-1992, which is earlier than in Denmark.
The equalisation during the postwar era is still under-explained. In international research, Piketty’s (Citation2014) has put forward an influential explanation focusing on the combination of wartime destruction of capital (which decreased wealth and reduced capital income of the rich) together with progressive taxation partly introduced to finance the war effort. Given that Denmark, Norway and Sweden saw relatively modest destruction of domestic capital during the war (except for Northern Norway), the direct connection to the effect of capital destruction is less obvious here, even if the extreme wartime conditions certainly influenced policy and the distribution of income. Among the Nordic studies we focus on here, Atkinson and Søgaard (Citation2016, pp. 285–289) in their study of Denmark express skepticism towards the taxation explanation of declining inequality after 1945 without putting forward an alternative explanation, while in the Norwegian study Aaberge et al. (Citation2020, p. 11) for the equalisation from 1939 to 1953 put forward the role of (a) wage bargaining institutions, (b) transfer of labour out of agriculture, and (c) the effect of wartime experience on economic policy and (d) progressive taxes. For Sweden, Roine and Waldenström (Citation2008, pp. 380–383) emphasise the role of progressive taxation in the 1950s and 1960s in their study of income concentration (and Gustafsson & Johansson, Citation2003 concur with a study of Gothenburg), while for the Finnish decline from 1964 on, Roikonen (Citation2022, pp. 246–247) points to taxation as well as trade union strength and the expansion of education. In sum, there are many possible explanations and they have not really been tested systematically vis-à-vis each other.
The Swedish Gini series in starts only in 1975. The Gini coefficient was low and quite stable in the 1970s and 1980s but rose in the early 1990s. The Gini coefficient was below 0.45 throughout the 1980s but has been above 0.50 since 1993. Explanations proffered for the rise in inequality include growing capital incomes (Roine & Waldenström, Citation2012) as well as reduced redistribution due to changes in the tax and benefit system (Barth et al., Citation2021; Pareliussen et al., Citation2018). It is remarkable that the Gini coefficient for market income shows to be much higher in Sweden than in Denmark in the 2000s, while the 1970s show higher overall inequality in Denmark. Overall, the comparison of the Gini coefficients in the 2010s in indicates that Denmark had the least unequal income distribution and Sweden the most unequal. However, Aaberge et al. (Citation2021) show that a change in the Norwegian tax system in 2006 gave owners of closely held firms strong incentives to retain most of the profits in the firms, which means that the income measure in based on personal tax returns significantly underestimates the rise in Norwegian income inequality in the post-2006 period. Finland appears to occupy a middle ground between Denmark and Sweden in the 2010s.
Among possible contribution to rising inequality since the 1980s (in Denmark, since the 1990s), one finds greater returns to skills and education through skill-biased technological change (cf. Nolan et al., Citation2019, pp. 1296–1298) and growing compensation of executives (as in Rosenblum’s Citation2023 study of Finland).
4.3. The relationship between overall inequality and top income shares
We have emphasised that the top concentration of incomes – exemplified here by the top 1 per cent’s share – and an encompassing inequality measure such as the Gini coefficient capture different dimensions of the income distribution. In this section we investigate the relationship between the share of the top 1 per cent and overall inequality, for Denmark and Norway, where comparable income data exist over a long period.
The discussion in Sections 4.1 and 4.2 demonstrates that the strong similarity in the evolution of overall inequality in Denmark and Norway over the period 1914–1970 is not captured by the evolution of the income share of the top 1 per cent.Footnote10 First, the income share of the top 1 per cent has been much higher in Denmark than in Norway over most of the period; in particular during the First World War, where the income share of the top 1 per cent in Denmark increased from 24 per cent in 1915 to 28 per cent in 1917, while it increased from 13 per cent in 1914 to 14 per cent in 1917 in Norway. However, a significant decline in the income of the richest from 1918 to 1920 in Denmark, where the top 1 per cent lost 11 percentage points (reduction by 41 per cent), made the top income shares of the two countries more similar in 1920, as the top 1 per cent in Norway only lost 2 percentage points. The dramatic decline in the income share of the top 1 per cent in Denmark largely explains the significant fall in the Gini coefficient from 0.68 in 1918 to 0.57 in 1920, whereas an almost equally significant fall of the Gini coefficient in Norway (from 0.65 in 1917 to 0.56 in 1920) can be explained by the loss in the income share of the upper middle class (8th and 9th decile of the income distribution).
Atkinson and Søgaard (Citation2016) show that there was strong co-movement between the evolution of the Gini coefficient and the income share of the top 1 per cent in Denmark, except for the periods 1915–1920 and 1970-1983, but also that there was clear co-movement between overall inequality and inequality among the remaining 99 per cent of the population, which means that the fall in overall inequality from the early 1940s to the late 1960s was not solely a result of the decline in the income shares of the top 1 per cent. Even though the break in the Gini series in 1970 has created comparability problems, the results provided by Atkinson and Søgaard (Citation2016) and Søgaard (Citation2018) suggest that the co-movement between overall inequality and the share of the top 1 per cent continued into the beginning of the new millennium, since both measures show to slightly decrease over this period.
In Norway, the Gini coefficient declined only modestly from 1882 to 1939, whereas the richest 1 per cent lost 9 percentage points over the same period, i.e. their share of total income fell from 22 per cent to 13 per cent where most of the loss occurred before the First World War. The effect on overall inequality of the fall in the income share of the top 1 per cent was however counteracted by a rise in the Gini coefficient for the rest of the population from 0.43 to 0.48. The next period from 1940 to 1953 is characterised by significant equalisation of the market incomes. However, as can be observed from and the dramatic fall in overall income inequality in Norway over this period was not driven by a decline in the income share of the top 1 per cent but was a result of a significant rise in the income share of the lower 50 per cent of the population as well as a significant reduction in inequality among the upper 50 per cent of the population (Aaberge, Atkinson and Modalsli, Citation2020).
As for Finland, this country looks a lot more egalitarian than Denmark and Norway in the late 1800s when considering the Gini coefficient () but not when considering the top income shares (). If the figures are correct, this implies that the upper middle class, the groups just below the top 10 per cent of the distribution, must have benefited in the late 1800s, while the lower half of the distribution were poor. The top 1 per cent share and the Gini coefficient both were reduced in Finland in the 1920s and 1930s. On the other hand, the Gini coefficient increased strongly in Finland in the 1940s, while the top 1 per cent share fell.
A further decrease in income inequality in Norway during the late 1970s was partly driven by the negative effects of the oil crises on the shipping sector; not least because this sector has always had a significant share of the top earners in Norway. Inequality remained remarkably stable in Norway during the 1980s. The turning point in the early 1990s was primarily a result of increased wage inequality associated with the oil production in the North Sea (Aaberge & Mogstad, Citation2011). The significant rise in inequality in the late 1990s and after the millennium was however mostly driven by increased shares of top incomes, which was a result of the delayed effects of a major financial market reform in the mid-1980s that gave expanded opportunities to borrow and earn money, and the 1992 tax reform where taxes on capital incomes were significantly reduced. As opposed to the modest role of the changes in the income share of the top 1 per cent on overall inequality during the equalisation period, the rise in inequality after 1990 has primarily been driven by the increased income shares for the richest people. However, as indicated in Sections 4.1 and 4.2 both top income shares and overall inequality have been significantly higher than suggested by the conventional tax-based income data and official statistics, which makes the evolution after the millennium look more like the evolution in the US than in most European countries.
5. Summary and discussion
As demonstrated in this paper, the long-run evolution of income inequality has been a vibrant field in Nordic economic history research over the last fifteen years or so. The results from the key studies for Denmark, Finland, Norway and Sweden reported in this paper give a foundation to stand on when it comes to describing patterns of income concentration and inequality over time. To provide empirical evidence for the causes behind the changes is, however, more challenging. This is of course not unique to the Nordic countries. One recent overview of top incomes studies points to ‘how difficult it is to arrive at a consensus on the relative importance of different drivers of inequality via aggregate cross-country regression analysis, and why that will continue to be such a challenge’ (Nolan et al., Citation2019, p. 1313). The authors of that survey point to the use of focused comparisons of a small set of countries as an important route forward for the analysis of income inequality: ‘in-depth investigation of individual country experiences, especially when examined through a common analytic lens, where the episodic nature of inequality increases can be more adequately contextualized and understood.’ (Nolan et al., Citation2019, pp. 1313–1314) With our focus on the Nordic countries, we agree with this recommendation, and suggest further comparative research about the drivers of income inequality in the long run.
As suggested by the discussion in Section 4 (and consistent with previous Nordic research by Atkinson & Søgaard, Citation2016 and Aaberge et al. Citation2020), the evolution of income inequality in the Nordics has occurred in a series of episodes rather than by secular cycles. This means that the evolution can neither be summarised by Kuznets’ inverse U nor by a U. The role of agriculture and the shift of employment out of this sector has not been investigated in depth, even if references to Kuznets recur in the referred studies of this survey. While we have discussed aspects of inequality in terms of sectors such as finance or, in Norway, oil, and their booms and busts, it would be required to have access to micro-data to be able to capture causal relationships. The impact of financial crises has appeared many times in the historical inequality literature, but with available family or individual tax records, conclusions could be made on a firmer basis. Against the background of recent discussions in macroeconomics of monopsony and market power with increasing concentration to certain firms in important industries (e.g. de Loecker et al., Citation2020), a sector-approach would also be relevant more generally. It would clearly be informative to map incomes over the twentieth century by sector, considering differences per sector in terms of market concentration, export exposure and other macro variables (cf. Nolan et al., Citation2019, p. 1314).
For explanations of the important episode of decrease in inequality after the Second World War, Aaberge et al. (Citation2020) have pointed to structural change, more specifically the shift of the labour force out of agriculture. This factor has been remarkably missing in the wider literature on long-run inequality, beyond generic references to the Kuznets Curve (where shifts out of agriculture are assumed to increase inequality), but in a general economic history context, the relevance of this factor might be more obvious. In the overall economic history literature, it is standard to connect the rise of Fordism in the 1910s to the 1940s to decreasing income differentials (e.g. Swedish textbooks: Lundh, Citation2002; Schön, Citation2014), and conversely to see increasing income inequality after 1980 as reflecting increasing heterogeneity of jobs and tasks. With new micro data that allow sectoral composition, it would be interesting to return to the issue of industrialism and income differentials over the first half of the twentieth century. It is striking, however, that while generally we may think of a tendency of equalisation during the postwar period, at least for the pre-tax measures studied here, there is more heterogeneity than that in the Nordics. It seems that there is scope for further studies, and it would of course also be very valuable if it would be possible to produce some estimates for post-tax and transfers inequality for a few benchmark years in the postwar period. Then the role of taxation and the growth of the welfare state could be evaluated in a more systematic way. In the contemporary setting, we know that accounting for the role of redistribution and egalitarian public service provision has a large impact on living standards inequality (Aaberge et al., Citation2018), but we lack historical mapping of the timing of this inequality reduction.
It should, also, be remembered that the discussion in this survey concerns the distribution of pre-tax income, which does not provide a complete picture of economic well-being. Redistributive mechanisms such as progressive taxation and public cash and in-kind transfers have gained significant influence on the distribution of economic well-being, partly counteracting the rise in inequality of market incomes seen since the 1980s. Several studies carried out at Statistics Norway have shown that redistributive policies such as taxes, transfers and public services are of vital importance for the distribution of well-being in most European countries (cf. Aaberge et al., Citation2018). Technological changes and lack of relevant tax policies may however continue to produce increased concentration in market income and wealth, but the crucial and unanswered question is whether the accompanying increased economic power of the rich transforms into increased political power and weakening of the welfare state.
Acknowledgements
We would like to thank Jesper Roine, Petri Roikonen, Jakob Søgaard and Daniel Waldenström for sharing the data that has been used to produce the figures presented in this paper. We would also like to thank the editor Paul Sharp and three anonymous referees at SEHR for useful comments and suggestions.
Disclosure statement
No potential conflict of interest was reported by the author(s).
Additional information
Funding
Notes
1 Ólafsson and Kristjánsson (Citation2017) provide estimates of the share of the top 1 per cent for two years between the world wars (1927 and 1936) and for the period 1992–2017, while estimates of overall inequality measured by the Gini coefficient are only available for the recent three decades.
2 Flodström was a crucial actor in the creation of modern economic statistics in Sweden. See Hellroth (Citation2011) for a study which discusses the role of Flodström.
3 For the city of Stockholm 1870–1970 Bengtsson and Molinder (Citation2022) have been able to calculate both individual and household level inequality measures. However, they show to yield remarkably similar results.
4 The top income approach of course has its clear proponents, most notably Piketty. See Piketty’s (Citation2014, pp. 246–268) discussion of top income shares versus overall measures of inequality like the Gini coefficient.
5 Note that the Gini coefficient can be interpreted as the ratio between the average pairwise income differences in the population and twice the mean income, which means that the Gini coefficient becomes equal to 0 if and only if all population units have equal income. The other extreme is attained if and only if one unit receives the total income. In this case the Gini coefficient takes the value 1. When the Gini coefficient is equal to 0.5 then the average income difference is equal to the mean income.
6 Nolan et al. (Citation2019, p. 1290) concur, arguing that «increases in inequality have often occurred in discrete ‘episodes’ rather than in a consistent fashion over time».
7 To further explore the role of the financial sector and its crises in the income distribution, we would need data which allows for a decomposition of income by sector. Bengtsson and Molinder (Citation2021) use individual tax returns data to study top incomes in Stockholm in 1909, 1915, 1927, 1935 and 1950. The financial sector is shown to account for a considerable share of top incomes. Unfortunately, income by sector is not available before the financial crisis of 1907.
8 Note that the significant fall in the income share of the top 1 per cent from 2005 to 2006 in Norway was solely due to the increase of the tax rate on dividends from 0 to 28 per cent in 2006, which gave owners of unlisted companies strong incentives to reduce the dividend pay-out and save most of the profit in holding companies. Thus, since retained business income is not included in personal tax records the conventional income statistics will underestimate top income shares from 2006 onwards. By accounting for retained business income Aaberge, Modalsli and Vestad (Citation2020) demonstrated that the share of the market income attributable to the top 1 per cent increased from 8–9 to 24 per cent in 2006–2007 and more than doubled after the financial crises in 2008. The effects of the reform have been discussed in further detail by Aaberge et al. (Citation2021) and Alstadsæter et al. (Citation2016).
9 To reach the lowest levels, which were attained during the 1980s in Norway and early 1990s in Denmark, would have required a reduction of approximately 35 per cent of the Gini coefficient. It can be shown that this reduction in the Gini coefficient will correspond to introducing a 35 per cent proportional tax on income and then redistributing the derived tax revenue as equal sized amounts to the individuals (Aaberge, Citation1997). As an illustration assume that the mean income was 10,000 Euros. Then a person with 2000 Euros in income would have gained 2800 Euros, whereas a person with 50,000 Euros would have lost 14,000 Euros. After this tax-transfer intervention the income of the poorest would have increased from 2000 to 4800 Euros, while the income of the richest would have decreased from 50,000 to 36,000 Euros.
10 For Sweden, estimates of overall measures of inequality are not available further back then in 1975.
References
- Aaberge, A., Langørgen, A., & Lindgren, P. Y. (2018). Accounting for public in-kind transfers in comparisons of income inequality between the Nordic countries. Nordic Economic Policy Review, 2018, 175–205.
- Aaberge, R. (1997). Interpretation of changes in rank-dependent measures of inequality. Economics Letters, 55, 215–219.
- Aaberge, R., & Atkinson, A. B. (2010). Top incomes in Norway. In A. B. Atkinson & T. Piketty (Eds.), Top incomes in a global perspective (pp. 448–481). Oxford University Press.
- Aaberge, R., Atkinson, A. B., & Modalsli, J. (2020). Estimating long-run income inequality from mixed tabular data: Empirical evidence from Norway 1875–2017. Journal of Public Economics, 187, 104196.
- Aaberge, R., Modalsli, J., & Vestad, O. (2020). Ulikheten – betydelig større enn statistikken viser. SSB Analyse No. 2020/13. Oslo: Statistisk sentralbyrå.
- Aaberge, R, & Mogstad, M. (2011). Robust inequality comparisons. Journal of Economic Inequality, 9, 353–371.
- Aaberge, R., Mogstad, M., Vestad, O., & Vestre, A. (2021). Økonomisk ulikhet i Norge i det 21. In århundret. Rapporter 2021/33. Statistisk sentralbyrå.
- Abildgren, K. (2019). Mining archival genealogy databases to gain new insights into broader historical issues. Digital Library Perspectives, 35(3/4), 259–270. https://doi.org/10.1108/DLP-07-2019-0025
- Abramitzky, R., Boustan, L. P., & Eriksson, K. (2012). Europe's tired, poor, huddled masses: Self-selection and economic outcomes in the age of mass migration. American Economic Review, 102(5), 1832–1856. https://doi.org/10.1257/aer.102.5.1832
- Alstadsæter, A., Jacob, M., Kopczuk, W., & Telle, K. (2016). Accounting for business income in measuring top income shares. Integrated Accrual Approach Using Individual and Firm Data from Norway (NBER Working Paper, 22888).
- Atkinson, A B. (1997). Bringing Income Distribution in from the Cold. The Economic Journal, 107(441), 297–321.
- Atkinson, A. B. (2007). Measuring top incomes: Methodological issues. In A. B. Atkinson & T. Piketty (Eds.), Top incomes over the 20th century (pp. 18–42). Oxford University Press.
- Atkinson, A. B., & Piketty, T. (2007). Top incomes over the 20th century. Oxford University Press.
- Atkinson, A. B., & Piketty, T. (2010). Top incomes in a global perspective. Oxford University Press.
- Atkinson, A. B., & Søgaard, J. E. (2016). The long-run history of income inequality in Denmark. The Scandinavian Journal of Economics, 118(2), 264–291. https://doi.org/10.1111/sjoe.12143
- Barth, E., Moene, K., & West Pedersen, A. (2021). Rising inequality in the egalitarian Nordics. In G. Fischer & R. Strauss (Eds.), Europe’s income, wealth, consumption and inequality (pp. 218–C6.T3). Oxford University Press.
- Bengtsson, E., & Molinder, J. (2021). What happened to the incomes of the rich during the great levelling? Evidence from Swedish individual-level data, 1909–1950. Lund Papers in Economic History, 230.
- Bengtsson, E., & Molinder, J. (2022). Incomes and income inequality in Stockholm, 1870–1970: Evidence from micro data. Lund Papers in Economic History, 240.
- Bentzel, R. (1952). Inkomstfördelningen i Sverige. Almqvist & Wiksell.
- Bjerke, K. (1957). Changes in Danish income distribution 1939-521. Review of Income and Wealth, 6(1), 98–154. https://doi.org/10.1111/j.1475-4991.1957.tb01086.x
- de Loecker, J., Eeckhout, J., & Unger, G. (2020). The rise of market power and the macroeconomic implications*. The Quarterly Journal of Economics, 135(2), 561–644. https://doi.org/10.1093/qje/qjz041
- Espeli, H. (2013). Economic consequences of the German occupation of Norway, 1940-1945. Scandinavian Journal of History, 38(4), 502–504.
- Fjære, J. (2014). Income Development in Norwegian municipalities. Master thesis. Department of Economics, University of Oslo.
- Flodström, I. (1907). Taxeringen till inkomstskatt år 1907 samt taxeringen till bevillning s.å. för inkomst under 1,000 kronor af kapital och arbete. Ministry of Finance.
- Galbraith, J. K. (2019). Sparse, inconsistent and unreliable: Tax records and the world inequality report 2018. Development and Change, 50(2), 329–346. https://doi.org/10.1111/dech.12475
- Gerdrup, K. (2003). Three episodes of financial fragility in Norway since the 1890s. BIS Workin Paper No 142, BIS, Basel, Switzerland.
- Gómez León, M., & de Jong, H. J. (2019). Inequality in turbulent times: Income distribution in Germany and Britain, 1900–50. The Economic History Review, 72(3), 1073–1098. https://doi.org/10.1111/ehr.12770
- Gómez León, M., & Gabbuti, G. (2020). The other halves of fascist Italy: Income inequality from dynamic social tables, 1900–1950 (Working Paper DT 2104). Departamento de Economía, Universidad Pública de Navarra.
- Gustafsson, B., & Johansson, M. (2003). Steps toward equality: How and why income inequality in urban Sweden changed during the period 1925–1958. European Review of Economic History, 7(2), 191–211. https://doi.org/10.1017/S1361491603000078
- Hellroth, S. (2011). Från arbetsstatistik till konjunkturöversikt: arbetarfrågan och etablerandet av en statlig konjunkturbevakning i Sverige 1893–1914 [Doctoral dissertation]. Stockholm University. http://su.diva-portal.org/smash/record.jsf?facesredirect=true&aq2=%5B%5B%5D%5D&af=%5B%5D&searchType=SIMPLE&sortOrder2=title_sort_asc&query=&language=sv&pid=diva2%3A445319&aq=%5B%5B%5D%5D&sf=all&aqe=%5B%5D&sortOrder=author_sort_asc&onlyFullText=fal
- Jäntti, M., Riihelä, M., Sullstrøm, R., & Tuomala, M. (2010). Trends in top income shares in Finland. In A. B. Atkinson & T. Piketty (Eds.), Top incomes: A global perspective (pp. 371–446). Oxford University Press.
- Järnek, M. (1971). Studier i hushållens inkomsterförhållanden 1925–1964. Ekonomisk-historiska föreningen i Lund.
- Karadja, M., & Prawitz, E. (2019). Exit, voice, and political change: Evidence from Swedish mass migration to the United States. Journal of Political Economy, 127(4), 1864–1925. https://doi.org/10.1086/701682
- Kiær, A. (1892). Intægtsforhold i Norge. Tillegg Statsøkonomisk tidsskrift, Aschehoug, Kristiania
- Kuznets, S. (1953). Shares of upper income groups in income and savings. National Bureau of Economic Research.
- Kvile, J. (2017). The evolution of regional income inequality and social welfare in Norway: 1875–2015 [Master’s thesis]. University of Oslo. vitenarkiv: https://www.duo.uio.no/handle/10852/61166
- Lindberg, E. (2007). Mercantilism and urban inequalities in eighteenth-century Sweden. Scandinavian Economic History Review, 55(1), 1–19. https://doi.org/10.1080/03585520701234134
- Ljungberg, J. (1997). The impact of the great emigration on the Swedish economy. Scandinavian Economic History Review, 45(2), 159–189. https://doi.org/10.1080/03585522.1997.10414666
- Lönnborg, M., Ögren, A., & Rafferty, M. (2011). Banks and Swedish financial crises in the 1920s and 1930s. Business History, 53(2), 230–248. https://doi.org/10.1080/00076791.2011.555108
- Lundh, C. (2002). Spelets regler: Institutioner och lönebildning på den svenska arbetsmarknaden 1850–2000. SNS.
- Magnussen, O., & Sigveland, G. (1978). Migration from Norway to the USA, 1866–1914. The use of econometric methods in analyzing historical data. The Scandinavian Journal of Economics, 80(1), 34–52. https://doi.org/10.2307/3439410
- Mjelve, S. (1998). Økonomisk vekst og fordeling av inntekt i byene i Vest-Agder og Østfold, 1840–1990. Rapporter, 98/04, Statistisk sentralbyrå.
- Nolan, B., Richiardi, M. G., & Valenzuela, L. (2019). The drivers of income inequality in rich countries. Journal of Economic Surveys, 33(4), 1285–1324. https://doi.org/10.1111/joes.12328
- Ólafsson, S., & Kristjánsson, A. S. (2017). Ójöfnuður á Íslandi (Inequality in Iceland). Háskólaútgáfan i Reyjavik.
- Olsson, K. (1972). Hushållsinkomst inkomstfördelning och försörjningsbörda – en undersökning av vissa yrkesgrupper i Göteborg 1919–1960. Erlanders boktryckeri.
- Pareliussen, J. K., Hermansen, M., André, C., & Causa, O. (2018). Income inequality in the Nordics from an OECD perspective. In J. Egholt Søgaard, J. Roine, P.-O. Robling, & J. Pareliussen (Eds.), Nordic economic policy review 2018: Increasing income inequality in the Nordics (pp. 17–65). Nordic Council of Ministers.
- Piketty, T. (2003). Income inequality in France, 1901–1998. Journal of Political Economy, 111(5), 1004–1042. https://doi.org/10.1086/376955
- Piketty, T. (2014). Capital in the twenty-first century. Harvard University Press.
- Roikonen, P. (2022). Income inequality in Finland, 1865–2019. Scandinavian Economic History Review, 70(3), 234–251.
- Roikonen, P., & Heikkinen, S. (2020). A Kuznets rise and a Piketty fall: Income inequality in Finland, 1865–1934. European Review of Economic History, 24(1), 46–79.
- Roine, J., & Waldenström, D. (2008). The evolution of top incomes in an egalitarian society: Sweden, 1903–2004. Journal of Public Economics, 92(1-2), 366–387. https://doi.org/10.1016/j.jpubeco.2007.06.012
- Roine, J., & Waldenström, D. (2010). Top incomes in Sweden over the twentieth century. In A. B. Atkinson & T. Piketty (Eds.), Top incomes in global perspective (pp. 299–370). Oxford University Press.
- Roine, J., & Waldenström, D. (2012). On the role of capital gains in Swedish income inequality. Review of Income and Wealth, 58(3), 569–587. https://doi.org/10.1111/j.1475-4991.2011.00475.x
- Rosenblum, J. (2023). Politics, markets, and CEO pay: A congruence analysis of two competing theoretical explanations of executive compensation at large firms in Finland. Quality & Quantity, 1–32.
- Schön, L. (2014). En modern svensk ekonomisk historia (4th ed.). Studentlitteratur.
- Söderberg, J. (1986). Trends in inequality in Sweden, 1700-1914. In W. H. Schröder & K. H. Jarausch (Eds.), Quantitative history of society and economy: some international studies (pp. 58–78). St. Katharinen: Scripta MercaturaeVerl.
- Søgaard, J. E. (2018). Top incomes in Scandinavia: Recent developments and the role of capital income. In L. Calmfors, & J. Roine (Eds.), Nordic economic policy review 2018: Increasing income inequality in the Nordics (pp. 66–94). Nordic Council of Ministers.
- Soltow, L. (1965). Toward income equality in Norway. The University of Wisconsin Press.
- Soltow, L. (1989). The rich and the destitute in Sweden, 1805–1855: A test of Tocqueville's inequality hypotheses. The Economic History Review, 42(1), 43–63. https://doi.org/10.2307/2597045
- Sørensen, R. S. (1989). Udviklingen i den Danske Personlige Indkomstfordeling i 1900-tallet [Master’s thesis]. University of Copenhagen.
- Sørensen, R. S. (1993). Changes in the personal income distribution 1870–1986. In K. G. Persson (Ed.), The economic development of Denmark and Norway since 1870 (pp. 264–277). Edward Elgar.
- Splinter, D. (2019). Who pays no tax? The declining fraction paying income taxes and increasing tax progressivity. Contemporary Economic Policy, 37(3), 413–426. https://doi.org/10.1111/coep.12407
- Statistics Norway. (1995). Økonomisk utsyn (Economic Survey). Samfunnsøkonomiske studier No 3, Statistisk sentralbyrå 1955.
- Statistics Norway: Historical Statistics. (1994). NOS C 188. ISBN 82-537-3965-6. https://www.ssb.no/a/histstat/nos/nos_c188.pdf.
- Taylor, A., & Williamson, J. G. (1997). Convergence in the age of mass migration. European Review of Economic History, 1(1), 27–63. https://doi.org/10.1017/S1361491697000038
- Waldenström, D. (2009). Lifting all boats? The evolution of income and wealth inequality over the path of development [Doctoral dissertation in Economic History]. Lund University. https://www.ifn.se/publikationer/avhandlingar/2000-2019/2009-waldenstrom-lifting-all-boats-the-evolution-of-income-and-wealth-inequality-over-the-path-of-development/
Appendix
As emphasised in the main body of the paper, the survey focuses on comparable studies, i.e. studies using the same methodology. Section 3 in the paper points to some of the crucial methodological issues for comparability; in this Appendix we elucidate the comparability by going into the details on three points. The first is the unit of analysis – individual, family, household or tax unit. The second is the definition of income employed. The third is the treatment of non-taxpayers and the calculation of a total income.
A1 Definition of unit of analysis and population
Denmark
The family defines the unit of analysis until 1969, while the population is defined by the total number of families, i.e. the number of individuals aged 15+ subtracted the number of married women. Due to changes from family-based to individual-based taxation in 1970 the unit of analysis was changed from family to individual and the population was defined by individuals aged 15+. The change in definition of unit of analysis and population has caused a break in the estimated Gini series in 1970.
Finland
Roikonen’s (Citation2022, pp. 236–237) study follows the household 1865–1900, and married couples + singles over 17 years old for the period 1920–1989. The rules for taxation were not completely transparent in Finland in the early twentieth century and appear to have been a combination of individuals and households. It is also striking that separate taxation was abolished in 1943 (ushering in an era where family was the tax unit in the income tax statistics), and then reintroduced in 1976. From 1952 however, even in the joint taxation system, married persons were counted individually (Jäntti et al., Citation2010, p. 376). It should be noted that the Finnish data 1865–1880 include corporations as they paid income tax and the tabulated income statistics do not allow for the separation of corporations from individuals (Roikonen & Heikkinen, Citation2020, p. 50). These weaknesses of the historic data sets weaken the comparability of the estimated top income shares and Gini coefficients over time.
Norway
The family defines the unit of analysis for the entire period 1875–2018 and the population is defined by individual aged 16+ subtracted the number of married women. Defined in this way, the tax unit population (nuclear families) as reported in the population statistics increased from 847,000 in 1875 to 1.7 million in 1951 and 3.4 million in 2017.
Sweden
Roine and Waldenström’s measurement unit is the tax unit which until 1951 was the family, i.e. couples (who were taxed jointly) and single individuals. Thus, until 1951 the reference total population is the adult population subtracted married women. Between 1951 and 1971 there was a transition to individual taxation also for married couples. For example, between 1954 and 1965 spouses filed separate tax returns but were taxed jointly. From 1951 on the measurement unit in Roine and Waldenström’s study is the individual, and the reference total population is the adult population (See discussion in Roine & Waldenström, Citation2010, p. 306, 347–349).
A2. Definition of income
Denmark
Sørensen (Citation1989, Citation1993) based his studies on after-tax measurement of income, while Atkinson and Søgaard (Citation2016) followed the practice from other countries – and used assessed taxable income (income before tax subtracted standard deductions) to obtain comparable series of top income shares and Gini coefficients However, as indicated by Atkinson and Søgaard (Citation2016) it is a complex problem to convert the after-tax income that forms the basis of official income tabulations into assessed taxable income, since it requires use of debatable assumptions.
Finland
Roikonen (Citation2022) measures assessed taxable income accounted for income derived from labor, capital, business, and trade. By subtracting direct taxes and fees paid to the state, the church, or the municipality it has been possible to obtain a measure of income after tax. However, due to minor social transfers and low direct taxes prior to the introduction of the welfare state, assessed taxable income before and after tax were closely related during the nineteenth and early twentieth centuries.
Norway
Aaberge and Atkinson (Citation2010) and Aaberge et al. (Citation2020) relied on the same conceptual income definition over the entire period 1875–2018, which is denoted assessed taxable income (‘antatt inntekt’) in the tax system as well as in the historical official income statistics. This concept corresponds to income before tax, subtracted some standard pre-tax deductions, and includes wage income, self-employment income, capital income, taxable capital gains, taxable transfers and pension income. Self-employment income was based on the accounts of companies and the productive capacity of farms. The pre-tax deductions made up small amounts until the mid-1980s as deductions mainly accounted for the expenses that were deemed necessary for the acquisition of income (Statistics Norway: Historical Statistics, Citation1994, p. 280).
Sweden
Roine and Waldenström’s (Citation2010, p. 303) study relied on an income concept that included income from all sources before taxes and transfers, but with some deficits, like the deduction of interest payments. They provided estimates of top income shares both with and without capital gains. In our comparisons of income inequality below we will state if we use series with or without capital gains; for comparability purposes, we will however in most cases exclude capital gains from the income measure.
A3. Control total of income and treatment of non-taxpayers
The basic limitations of the data from official tax tabulations are that they give only partial coverage of the population and the total income, and that the coverage varies over time. To strengthen the degree of comparability over time most studies on the historic development of income concentration and income inequality have relied on Kuznets (Citation1953) control total approach by supplementing the tax data with official statistics on the total number of tax units and their total income. This means that the excess income must be allocated between taxpayers and non-taxpayers (Atkinson, Citation2007). Atkinson and Søgaard (Citation2016) used an alternative approach by imputing incomes for non-taxpayers and adding these incomes to the incomes of the taxpayers to get an income total.
Denmark
The tabulated tax data for Denmark covered 26 per cent of the population in 1903 and around 66 per cent between 1917 and 1936. From 1938, the income tabulations cover all potential taxpayers. Rather than relying on a control total for income Atkinson and Søgaard (Citation2016) included estimates of income for non-taxpayers. Incomes of non-taxpayers were built on estimates made by Statistics Denmark until 1915 and the estimates made by Sørensen (Citation1989) for the years 1917–1937. These estimates have been shown to have a significant impact on the measurement of overall inequality for the years before 1915.
Finland
Roikonen’s (Citation2022, pp. 236-237) tax data for Finland covered a proportion varying from 20 per cent of the adult population in 1865 to more than 90 per cent in the mid-1960s. He calculated the control total for income by setting the income of non-filers at either 40, 60, or 80 per cent of the threshold for tax payment. Roikonen and Heikkinen (Citation2020, p. 53) provide an interesting discussion, building on historical information, of the incomes of non-taxpayers.
Norway
For Norway, Aaberge et al. (Citation2020) relied on 72 per cent of the National Accounts’ total household income as control total for income, which was the maximum reached by the total income of the tax statistics over the period 1875–2018. A similar approach was taken by Roine and Waldenström (Citation2008, Citation2010) for Sweden and Atkinson (Citation2007) for the UK. The purpose of these choices was to strengthen the comparability of estimated top income shares and Gini coefficients over periods with differing proportions of taxpayers. However, Aaberge et al. (Citation2020) also used data on social assistance in combination with various regular published aggregated quantities for income to give a more precise estimate of the incomes of non-taxpayers, thus providing sufficient information for obtaining reliable estimates of the Gini coefficient. Aaberge et al. (Citation2020) divided non-taxpayers into two groups: those who received poverty assistance and those who were not assisted. Data for the number of recipients of public assistance and the average amounts received are available from historical statistical publications. The non-assisted non-taxpayers were assumed to either receive the same average income as the assisted poor or as an average income equal to one third of the average income of those taxpayers who only paid municipality tax. The latter assumption formed the basis of a lower bound of the estimated Gini coefficient, whilst the former assumption defined an upper bound.
Sweden
In Sweden, only 7.2 per cent of adults paid the income tax at its inception in 1903; this rate grew to 11.9 per cent in 1907, around a quarter in 1911 and 1912, a third in 1916, and 64.3 per cent in 1920 (Roine & Waldenström, Citation2010, p. 363). Roine and Waldenström (Citation2008, Citation2010) used what Atkinson (Citation2007) called a ‘top-down’ approach to determining the incomes of non-filers: they compared the taxed income to total income in the personal/household sector and let the non-filers’ incomes be determined as the residual between taxed income and total income. Moreover, they show that setting the non-filer income as 80 per cent of the tax threshold (this is about 25 per cent of the average income) for the years 1903–1920 overstates total household income of the National Account (Roine & Waldenström, Citation2010, p. 357). This implies that non-filers in fact had very low incomes in these years. For the 1903–42 period, Roine and Waldenström use the 89 per cent of ‘personal sector total income’ as control total for income, while they use total taxed income as control total after 1942.
