
 ?Mathematical formulae have been encoded as MathML and are displayed in this HTML version using MathJax in order to improve their display. Uncheck the box to turn MathJax off. This feature requires Javascript. Click on a formula to zoom.
Abstract
Too many ammonia emissions are released into the environment from cattle farming. These damage the environment and have an impact on animal and human health. Ammonia Emissions could be reduce by urease inhibitors. Before using the urease inhibitor suspension Atmowell® in cattle farming a risk assessment is required. This includes exposure data on the animal and human in the barn. As there is no method for exposure measurements yet the approach of fluorometry was taken. The fluorescent dye pyranine shall replace Atmowell® in later studies as a tracer. Before Atmowell® can be replaced, the interaction between Atmowell® and pyranine—according to the fluorescence and storage stability under the influence of ultraviolet light, has to be observed and excluded. Also, the spray and drift behavior must be examined in the wind tunnel with three different nozzles. The results show that Atmowell® has no effect on neither the fluorescence nor the degradation rate of a pyranine-solution. Furthermore, it is shown that a pyranine + Atmowell® mixture does not differ in drift behavior from a pure pyranine-solution. Because of these findings, an Atmowell®-solution can be substituted by a pyranine-solution without any effects on the results of an exposure measurement being expected.
Introduction
Too many ammonia emissions (NH3) are still released into the environment. The agriculture is responsible for 95% of the ammonia emissions in Germany.[Citation1] The largest share results from livestock farming especially from manure management.[Citation2,Citation3] Ammonia harms the environment by soil acidification and eutrophication.[Citation1,Citation4,Citation5] In addition, the discharge of NH3 also poses a health risk to humans and animals.[Citation1] To protect the environment and human as well as animal health from further effects due to NH3 emissions, Germany signed the Directive 2016/2284 to reduce ammonia emissions by 5% for any year from 2020 to 2029 and by 29% from 2030.[Citation6] Although there are already several methods to reduce NH3 emissions, further measures are necessary to achieve the aim.
Ammonia emissions arise due to the microbial conversion of urea in urine by hydrolysis. The enzyme works as a catalyst and is found in feces and on the floor surface.[Citation7–9] One possibility for ammonia reduction could be the use of an urease inhibitor to inhibit the enzyme urease over a certain time and thereby the conversion of urea to ammonia in the urine of animals.[Citation10,Citation11] By adding urease inhibitors to floor surfaces where feces and urine meet, the ammonia volatization from the stable can be significantly reduced.[Citation11] The effectiveness of the urease inhibitor [in this case Phosphoric acid phenylesterdiamide (PPDA)] contained in Atmowell® and the NH3 reduction performance have already been demonstrated in previous studies under practical conditions. By applying the urease inhibitor manually via a backpack sprayer on the floor surface in three different dairy barns at different times within a year the urease activity could be reduced by an average of 80%.[Citation12] Under practical conditions in two naturally ventilated dairy barns significant reductions of ammonia emissions by 57–58% were proven by applying the urease inhibitor (PPDA) by an automatic backpack sprayer placed on a rollator.[Citation13]
Even though the effectiveness of the urease inhibitor (PPDA) has been proven several times, the urease inhibitor is not yet used in practice and further steps are necessary for the establishment of broad agricultural practice (dairy/cattle farming) which are being worked on and developed in the project Prax-REDUCE. On the one hand, the development of a feasible technique for the automatic daily dosing, mixing, and application of the suspension Atmowell®-formulation on the stable floor is necessary. In addition to good application techniques, also a qualified proof of safe usage must be provided. This evidence is based on exposure scenarios and exposure data obtained under stable conditions. Fluorometry is a methodical approach to measure drift and body exposures for agricultural risk assessment. In this process, the spray liquid is marked with a fluorescent dye, which is washed off the target object after application in the wind tunnel or field trial with a defined amount of distilled water. The concentration of the dye is then quantified with a fluorometer.[Citation14] In later practical tests for collecting exposure data in the cattle barn, Atmowell® should therefore be replaced by the fluorescent dye pyranine. Before pyranine can be used as a tracer, the spray and drift behavior between pyranine and Atmowell® must be compared first.
Because drift and droplet size are closely related, the physical properties of spray mix and therefore spray additives could have a major influence on the droplet size as well as on the drift behavior.[Citation15] Wang et al.[Citation16] found that the addition of spray additives to the spray solution has a significant influence on the amount of drift. Depending on the type of spray additives, the drift reduction differs.[Citation17] Costa et al.[Citation17] also found that the addition of mineral oil and an anti-drift agent result in lower drift when investigating the effect of different spray additives.
As there are no studies yet on the influence of an urease inhibitor suspension on spray- and drift behavior, the aim of this work was to investigate whether the urease inhibitor suspension (Atmowell®) has a similar drift behavior compared to the fluorescent dye pyranine. To answer this question, the following hypotheses were tested:
The urease inhibitor suspension (Atmowell®)
has no intrinsic fluorescence or does influence the fluorescence of pyranine,
does not influence the degradation speed of the fluorescence of pyranine under different UV radiation intensities (high, middle, low), and
has no influence on the drift behavior and droplet size
Materials and methods
Pyranine property
Pyranine, generic name, pyranine 120%, is a highly water-soluble yellow green sodium salt powder. It has been used for years as a tracer for nozzle and drift tests at Julius Kühn-Institute (JKI) due to its high fluorescent property. Depending on the trials and the fluorometer device types, a concentration between 0.1 and 1 mg L−1 of pyranine is used.
Urease inhibitor property
The used urease inhibitor suspension Atmowell®, together with the necessary application and stability properties, were developed by SKW Stickstoffwerke Piesteritz GmbH. Atmowell® is a formulation of the inhibitor PPDA (Phosphoric acid phenylesterdiamide with a vegetable oil as a carrier material (density 0.865 g cm−3). The amount of the urease inhibitor suspension Atmowell®, which is used in the trials is about 0.86 g L−1 water. This is almost twice the application rate according to commercial recommendations for later practical use of about 0.5 g L−1 water. This application rate was chosen as a worst-case measurement to ensure the urease inhibitor, respectively Atmowell® had no effect.
Fluorescence of Atmowell®
To determine whether Atmowell® fluoresces or is influencing the pyranine’s fluorescence, a solution of pyranine and water, a solution of Atmowell® and water as well as a mixture of pyranine and Atmowell® were analyzed. The variants listed in with corresponding quantities and concentrations were analyzed. The resulting solutions were gently mixed at room temperature (20 °C) for 10 min. A sample of 40 mL was taken from each variant and was analyzed with the spectro fluorophotometer Shimadzu RF-6000. The samples were excited at a wavelength of 405 nm and the emitting fluorescence was measured at a wavelength of 515 nm. The radiant power of the fluorescence correlates with the concentration of the fluorescent substance. Hence, a calibration curve was generated for each measurement. The measurement range/concentration range of the samples to be analyzed for this measurement was between 0 and 2,000 µg L−1. The calibration curve had a coefficient of determination of 0.999. The measurement data were given as concentration µg L−1. Each variant was analyzed in ten repetitions on the fluorometer.
Table 1. Quantities and mixing ratios of pyranine and Atmowell® to measure their fluorescence.
UV degradation rate
Pyranine is generally subject to accelerated fluorescence degradation in contact with direct UV-irradiation. To identify whether there is an accelerated fluorescence degradation under the presence of additional Atmowell®, the fluorescence degradation depending on different UV intensity levels (high, medium, low) were tested (). These findings are important to estimate the shelf life of the samples for wind tunnel measurements. The concentrations and mixing ratio of pyranine and Atmowell® were chosen based on the later wind tunnel experiments. Aside from a solution out of pyranine (1 mg L−1) and water, also a mixture of pyranine (1 mg L−1) and Atmowell® (10 µL L−1) was produced. The pure pyranine solution as well as the mixture of pyranine + Atmowell® were filled into three flasks and exposed to different intensities of light at room temperature (20 °C). To simulate high, medium, and low irradiation samples were placed on the window ledge to simulate direct sunlight; inside the room to simulate indirect sunlight; and inside a closed cupboard without sunlight, for the entire duration of the experiment. From each variant, a total solution of 500 mL was prepared. At specific time intervals, a sample of 15 mL of each 500 ml solution was taken and measured with the same settings as in the previous experiment on the spectro fluorophotometer Shimadzu RF-6000. The measurement was performed according to the same instrument settings as in chapter 2.2. The measurement range/concentration range of the samples to be analyzed for this measurement was between 0 and 1 mg L−1. The calibration curve had a coefficient of determination of 0.998. The measurement data were given as concentration mg L−1. During sampling of the “low” variants, the cupboard was opened briefly. A strong influence by UV-irradiation was not expected in the short time. For each variant, three repetitions were taken.
Table 2. Experimental set up for the detection of fluorescence degradation under UV-irradiation.
Drift measurement
With wind tunnel measurements, data for the calculation of the DIX (Drift measurement Index) can be generated by a standardized and well-reproducible procedure. The DIX is used to assess the drift potential/drift risk of a single nozzle. According to Helck and Herbst[Citation18] and Herbst[Citation19] the spray drift potential is defined as:
(1)
(1)
with hst and Vst = parameters from a conventional flat fan nozzle 03 (3 bar).
Where h is the normalized center of gravity height of the drift cloud above the ground and V is the drifting volume fraction in relation to the nozzle output. a (=0.88) and b (=0.78) are constants achieved from a regression analysis of field and wind tunnel measurements for many different nozzle Helck and Herbst.[Citation18]
The wind tunnel experiment was conducted at Julius Kühn-Institute for Application Techniques in Plant Protection (JKI-AT). The wind tunnel’s cross section is 1.6 m (height) and 2.5 m (width). The effective range with a uniform air flow is 10 m in length (working area). Environmental conditions of the experiments were set to a wind speed of 2.2 m s−1; humidity of 80% and temperature of 20 °C. This parameter setting corresponds to the common settings according to ISO standard[Citation20] for drift measurements at the JKI.
Both, the pure pyranine-solution and the pyranine + Atmowell® mixture were used in the drift experiments with a pyranine concentration of 0.1 g L−1. The mixing ratio was taken in accordance with the preliminary test for UV degradability and fluorescence of Atmowell®. Therefore an amount of 1 mg L−1 Atmowell® was used. For both liquid sprays, three different nozzles sizes (01; 025; 05) of the nozzle type Flat Fan AirMix 110 (Agrotop GmbH, Obertraubling, Germany) were used and fixed at the height of 0.7 m. The liquid sprays were sprayed at a constant pressure of 2 bar. The parameter settings (pressure and height) were selected according to the specifications of the project partners which represent the later urease inhibitor application in practice ().
Table 3. Experimental set up for wind tunnel measurements.
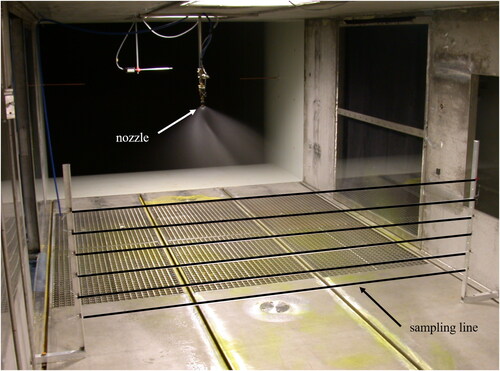
To determine the drift, five sampling lines used as collectors, were placed horizontally (0.1–0.6 m height) with 0.1 m spacing, at a distance of 2 m from the nozzle in downwind direction (). After a spraying time of 10 s, the collectors were dried for 2 min. Afterward, the collectors were consecutively collected beginning from the top, removed from the wind tunnel and washed with deionized water (10 mL) in a U-tube fixed in an ultrasonic cleaner. The water used for washing containing the solution of each sampling-line was measured at the fluorescence spectrophotometer Shimadzu RF-1501. The samples were excited at a wavelength of 415 nm and the emitted fluorescence was measured at a wavelength of 500 nm. Each variant was repeated 10 times. All collected data were included in the calculation of the absolute DIX according to EquationEq. (1)(1)
(1) .
Figure 1. Wind tunnel with the sampling-lines in the background and the nozzle installation in the foreground.
Droplet’s spectrum measurements
Droplet size measurement was carried out according to ISO standard 25358 with the Oxford Laser VisiSize System (Oxford Lasers) at JKI-AT. This System is using Particle Droplet Image Analysis (PDIA) technique for analysis of particle size and velocity distribution. Droplets with a size between the range of 37.5–1,234.1 µm (max.) can be determined by the laser droplet size analyzer. The measuring range was set according to empirical based standards provided by the JKI for the different nozzles used in each case. The test stand consists of a movable beam and a laser unit, which was located 0.5 m below the nozzle. For the following nozzles (AirMix 110-01, AirMix 110-25, AirMix 110-05) the droplet size was measured with and without Atmowell® with the same quantity ratios as in the wind tunnel (). Pressure, nozzle height, and environmental conditions (Air temperature 22 °C, humidity 60%) were constant overall measurements. Three repetitions of each variant were used to calculate the cumulative volume distribution, arithmetic mean and volume mean by the VisiSize 6 Software.
Table 4. Experimental set up for droplet size measurements.
Data analysis
Descriptive statistics were calculated for data from the measurement of the UV degradation rate and fluorescence of Atmowell® using Microsoft Excel (2016). The absolute DIX values were evaluated with a template in Excel prepared by the JKI, which is also used for nozzle tests. The VisiSize 6 software calculated the data from the droplet’s spectrum measurement. A plausibility check was performed and a statistical analysis was applied to all collected data. R Studio (Version 4.1.2) was used to carry out the significance test for the treatments “Fluorescence of Atmowell” and “UV degradation rate” by using the Welch Two Sample t-test with a significance level of 0.05.
Results and discussion
Fluorescence of Atmowell®
The first set of analyses investigated the presence of intrinsic fluorescence of Atmowell® and possible effects on the fluorescence of pyranine. shows the results of the fluorescence measurements of one pyranine-solution, one Atmowell®-solution, and a mixture of both. The prepared pyranine-solution of 1 mg L−1 was verified by the fluorometer. In contrast, the Atmowell®-solution showed values of around 0.00004 mg L−1 on the fluorometer, which is also a typical value for distilled water. For the pyranine + Atmowell®-mixture, values of 1 mg L−1 were detected on the fluorometer. Pyranine as well as pyranine + Atmowell®-mixture differs significantly from a pure Atmowell®-solution. The results show clearly that Atmowell® neither has an intrinsic fluorescence nor influences the fluorescence of pyranine.
Table 5. Results of the fluorescence of Atmowell® and the influence of the fluorescence of pyranine.
UV degradation rate
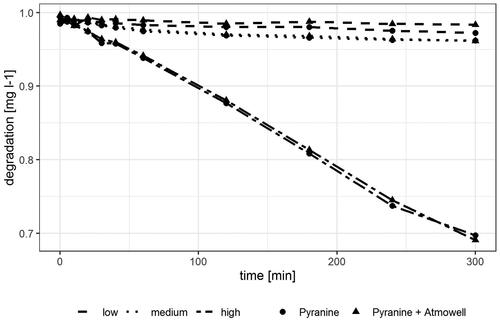
shows the degradation rate in mg L−1 of the fluorescence of pyranine and pyranine + Atmowell®-mixture at three different UV intensity levels over time. The measured values represent the average of three repetitions of each variant. The first measured value was set to a starting value of 100%. A degradation of fluorescence for all variants could be shown over time. However, UV intensity varied depending on each variant. As expected, direct UV-irradiation has shown the strongest decrease in fluorescence. After 60 min, a decrease from 0.99 to 0.94 mg L−1 could be observed which corresponds to a reduction of 6%. At the end (300 min) of the measurement, a total reduction of 30% with a final concentration of 0.7 mg L−1 was shown. In comparison, the variants with medium and low UV intensities showed a degradation from a maximum of 2% between 0.99 and 0.97 mg L−1 after 60 min. At the end of the measurement, the lowest value of the low variant with and without Atmowell® is 0.96 mg L−1. The final concentrations for the medium variants with and without Atmowell® were slightly higher (0.97 and 0.98 mg L−1). The maximum degradation rate was between 1 and 3% (medium to low UV intensity). Since the UV intensity was not measured directly, the real UV intensity as well as the difference between high, medium, and low is unknown. Due to organizational issues, the measurements of the medium and low variants could not take place at the same time. No more than three repetitions could be carried out, because the measurement frequency and the interval between sampling were very short, especially at the beginning of the measurements. However, all three replicates of all variants show very low standard deviations, especially the variants of low and middle UV intensity levels. Overall, these results show no significant influence of Atmowell® on the fluorescence degradation rate of pyranin independent of UV intensity level. Thus, neither a higher number of repetitions nor the information about the real UV intensity is necessary for this context and the measurement can be rated as sufficiently meaningful.
Figure 2. Degradation rate of the fluorescence of a pure pyranine solution and a mixture of pyranine and Atmowell® at three different UV intensity levels (low, medium, and high). Shown are the averages of each variant in mg L−1.
Drift and droplet size measurement
compares the absolute DIX, VMD (volume mean diameter) and fine droplet fraction (droplets <250 or <100 µm) of a pyranine-solution (0.1 g L−1) with and without addition of Atmowell® (1 mL L−1). As there is no uniform definition of fine drops in the literature, two commonly used limits were used: <250 and <100 µm. The classification <250 µm was made according to the manufacturer’s specifications (Agrotop GmbH), and the classification <100 µm is a JKI-internal standard limit for the determination of fine droplets in the drift classification. As expected, the smallest nozzle caliber (AirMix 110-01) shows the highest absolute DIX and the lowest VMD with and without Atmowell®. The percentage of fine droplets is 33–34% (<250 mm) and 1–2% (<100 µm). A clear influence of Atmowell® does not appear to be present in the absolute DIX (%), in the VMD or the fine droplet fraction. For the nozzle caliber AirMix 110-025, the VMD differs slightly. The difference in absolute DIX with and without Atmowell® is 2%. The fine droplet fraction (<250 and <100 µm) shows no differences. With nozzle caliber AirMix 110-05, slight differences in VMD (6%), absolute DIX (4%), and fine droplet fraction (<250 µm 1%) can be observed.
Table 6. Results for the drift measurement of the wind tunnel and of the droplet size measurements.
According to literature, drift, and droplet size can be influenced by a spray additive. In the present investigations, no important change in the parameters could be detected with and without Atmowell®. Only the absolute DIX is marginally lower in both variants AirMix 110-25 and AirMix 110-05 with Atmowell® than without. A lower absolute DIX indicates lower drift, which can only be seen positive with regard to the use of Atmowell® in the barn. In general, the deviation with and without additional Atmowell® is between 2 and 4%, hence an effect of the suspension is not to be expected. However, the influence on droplet size is also related to the type of spray additive and the nozzle type.[Citation21] For example, in air induction nozzles, water soluble adjuvants increase the average droplet size whereas emulsions and dispersions decrease it compared to water alone.[Citation22] The quantity of the additive can also play a role. Studies on droplet size measurement with sprays containing ethanol and two surfactants (polyoxyethylene sorbitan monolaurate and t-octylphenoxy polyethoxy ethanol) have shown that there was no significant effect on the droplet size distribution for both surfactants at rates up to 1 g L−1 spray solution.[Citation23] This effect may also have played a role in these studies. Because the amount of Atmowell® used was only 1 mL L−1 (0.86 g L−1) and is, therefore, lower than the value of 1 g L−1 given in the literature. In summary, these results show that Atmowell® has no important influence on the VMD and the drift behavior with the used nozzle calibers.
Conclusion
The results of this study show that Atmowell® has no effect on the pyranine degradation rate, its fluorescence, or the drift behavior of a pyranine solution.
Furthermore, it was shown that a pyranine + Atmowell®-mixture does not differ in drift behavior from a pure pyranine-solution. This is an important result for further practical trials to measure dermal and inhalative exposures in the cattle barn. In these, an Atmowell®-solution can be substituted by a pyranine-solution without any important effects on the results of an exposure measurement being expected. In addition, if necessary, also experiments with an Atmowell®-solution and pyranine-solution could be carried out. Should the use of higher concentrations be necessary for later applications, the tests could be carried out again with adjusted concentration.
Acknowledgments
The author would like to thank the project partners SKW Stickstoffwerke Piesteritz GmbH and Agrotop GmbH. Furthermore Mr. Sven Nolte, Mrs. Celina Ehlers, and Mrs. Katrin Ahrens for their contributions to this work.
Disclosure statement
No potential conflict of interest was reported by the author(s).
Data availability statement
Raw data were generated at Julius Kühn-Institut (JKI), Federal Research Center for Cultivated Plants, Institute for Application Techniques in Plant Protection, Messeweg 11/12, 38104 Braunschweig, Germany. The data is openly available in a public repository that issues datasets with DOIs: The data that support the findings of this study are openly available in [OpenAgrar] at https://doi.org/10.5073/20220726-132952.[Citation24]
| Nomenclature | ||
| NH3 | = | ammonia |
| PPDA | = | phosphoric acid phenylesterdiamide |
| abs. Dix | = | absolute drift measurement Index |
| VMD | = | volume mean diameter (µm) |
Additional information
Funding
References
- Bundesamt, U. Ammoniak-Emissionen. https://www.umweltbundesamt.de/daten/luft/luftschadstoff-emissionen-in-deutschland/ammoniak-emissionen (accessed July 28, 2022).
- Haenel, H.-D.; Rösemann, C.; Dämmgen, U.; Döring, U.; Wulf, S.; Eurich-Menden, B.; Freibauer, A.; Döhler, H.; Schreiner, C.; Osterburg, B.; et al. Calculations of Gaseous and Particulate Emissions from German Agriculture 1990–2018: Report on Methods and Data (RMD) Submission 2020. Thünen Rep. 2020, 77, 1–414. DOI: 10.3220/REP1584363708000.
- Behera, S. N.; Sharma, M.; Aneja, V. P.; Balasubramanian, R. Ammonia in the Atmosphere: A Review on Emission Sources, Atmospheric Chemistry and Deposition on Terrestrial Bodies. Environ. Sci. Pollut. Res. Int. 2013, 20, 8092–8131. DOI: 10.1007/s11356-013-2051-9.
- Draaijers, G.; Ivens, W.; Bos, M. M.; Bleuten, W. The Contribution of Ammonia Emissions from Agriculture to the Deposition of Acidifying and Eutrophying Compounds onto Forests. Environ. Pollut. 1989, 60, 55–66. DOI: 10.1016/0269-7491(89)90220-0.
- Hartung, J.; Phillips, V. R. Control of Gaseous Emissions from Livestock Buildings and Manure Stores. J. Agric. Eng. Res. 1994, 57, 173–189. DOI: 10.1006/jaer.1994.1017.
- EC. Directive (EU) 2016/2284 of the European Parliament and of the Council of 14 December 2016 on the Reduction of National Emissions of Certain Atmospheric Pollutants, Amending Directive 2003/35/EC and Repealing Directive 2001/81/EC, 2016.
- Varel, V. H. Use of Urease Inhibitors to Control Nitrogen Loss from Livestock Waste. Bioresour. Technol. 1997, 62, 11–17. DOI: 10.1016/S0960-8524(97)00130-2.
- McCarty, G. W.; Bremner, J. M.; Lee, J. S. Inhibition of Plant and Microbial Ureases by Phosphoroamides. Plant Soil 1990, 127, 269–283. DOI: 10.1007/BF00014435.
- Dai, X.; Karring, H. A Determination and Comparison of Urease Activity in Feces and Fresh Manure from Pig and Cattle in Relation to Ammonia Production and pH Changes. PLOS One 2014, 9, e110402. DOI: 10.1371/journal.pone.0110402.
- Trenkel, M. E. Slow- and Controlled-Release and Stabilized Fertilizers: An Option for Enhancing Nutrient Use Efficiency in Agriculture, 2010.
- Sigurdarson, J. J.; Svane, S.; Karring, H. The Molecular Processes of Urea Hydrolysis in Relation to Ammonia Emissions from Agriculture. Rev. Environ. Sci. Biotechnol. 2018, 17, 241–258. DOI: 10.1007/s11157-018-9466-1.
- Hagenkamp-Korth, F.; Hartung, E.; Häussermann, A. Effect of Urease Inhibitor on Urease Activity to Reduce Ammonia Emissions in Dairy Farming. Bau, Technik Und Umwelt in Der Landwirtschaftlichen Nutztierhaltung: Stuttgart-Hohenheim, 2017; pp 376–381.
- Bobrowski, A. B.; Willink, D.; Janke, D.; Amon, T.; Hagenkamp-Korth, F.; Hasler, M.; Hartung, E. Reduction of Ammonia Emissions by Applying a Urease Inhibitor in Naturally Ventilated Dairy Barns. Biosyst. Eng. 2021, 204, 104–114. DOI: 10.1016/j.biosystemseng.2021.01.011.
- Herbst, A.; Wygoda, H.-J. Pyranin–Ein Fluoreszierender Farbstoff Für Applikationstechnische Versuche. Nachrichtenbl. Deut. Pflanzenschutzd 2006, 58, 233–238.
- Miller, P. C. H.; Hewitt, A. J.; Bagley, W. E. Adjuvants Effects on Spray Characteristics and Drift Potential. In Pesticide Formulations and Application Systems; American Society for Testing and Materials, 2001; pp 175–184.
- Wang, C.; Zeng, A.; He, X.; Song, J.; Herbst, A.; Gao, W. Spray Drift Characteristics Test of Unmanned Aerial Vehicle Spray Unit under Wind Tunnel Conditions. Int. J. Agric. Biol. Eng. 2020, 13, 13–21. DOI: 10.25165/j.ijabe.20201303.5716.
- Costa, A. G. F.; Miller, P. C. H.; Tuck, C. R. The Development of Wind Tunnel Protocols for Spray Drift Risk Assesment. In Aspects of Applied Biology, International Advances in Pesticide Application; Wellesbourne, 2006; pp 289–294.
- Helck, C.; Herbst, A. Drift-Potential-Index – A New Paramater for the Evaluation of Agricultural Nozzles concerning Their Drift Potential. Nachrichtenbl. Deut. Pflanzenschutztd 1998, 50, 225–232.
- Herbst, A. A. Method to Determine Spray Drift Potential from Nozzles and Its Link to Buffer Zone Restrictions. In The Society for Engineering in Agricultural, Food, and Biological Systems; ASAE: Sacramento, California, USA, 2001; pp 1–9. DOI: 10.13031/2013.7333.
- ISO 22856 Drift measurements Wind Tunnels, 2008 (22856:2008(E)).
- Butler Ellis, M. C.; Teck, C. R., Eds. Predicting Spray Droplet Size from Three Nozzle Design Using Physical Properties of Spray Liquids Containing Adjuvants, 1998.
- Butler Ellis, M. C.; Tuck, C. R., Eds. The Variation in Characteristics of Air-Included Sprays with Adjuvants, In Aspects of Applied Biology; 2000; pp. 155-162.
- Spanoghe, P.; van Meeren, P.; Steurbaut, W.; Baok, A.; Eds. The Influence of Dynamic Surface Tension on Atomisation and Retention of Agrochemical Active Ingredients. In Proceeding 5th World Surfactants Congress, Cesio, Comittee European Des Agents De Surface Et Leurs Intermediaires, 2000.
- Ehmke, A.; Melfsen, A.; Wegener, J. K.; Hartung, E. Dataset: Investigation of the Interactions between PPDA and Pyranine – On Its Fluorescence and Storage Stability under the Influence of Ultraviolet Light and Drift Behavior in Wind Tunnel Measurements. https://www.openagrar.de/receive/openagrar_mods_00081125 (accessed July 27, 2022).