
Article title: Molecular modeling approaches to address drug-metabolizing enzymes (DMEs) mediated chemoresistance: a review
Authors: Raju, B., Choudhary, S., Narendra, G., Verma, H., & Silakari, O.
Journal: Drug Metabolism Reviews
DOI: http://dx.doi.org/10.1080/03602532.2021.1874406
At the time of proof review, the authors found some errors in the figure numbering and their legends which they tried to correct. But due to some technical errors, they could not make all the necessary corrections in the proofs. However, when final version of the article was published online, the authors found that the figures are not correct and one figure is missing.
The correction in figures include the following:
should be renumbered as , should be and the newly supplied version of to be included in the proof, should be replaced with an updated version, should become , to be set as , to be replaced with an updated version.
Figure 2. Mechanism of action of DMEs inhibitors.
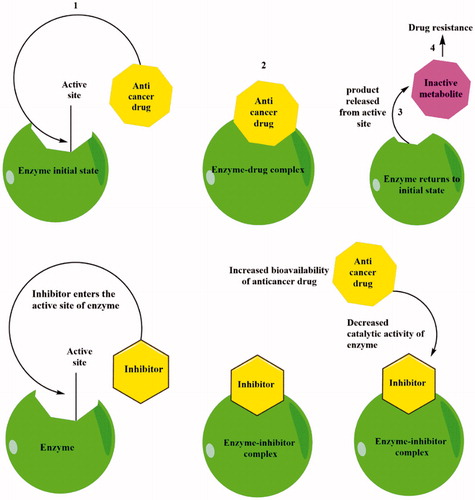
Figure 3. Physiological functions of CYP1B1 in drug resistance and tumor initiation.
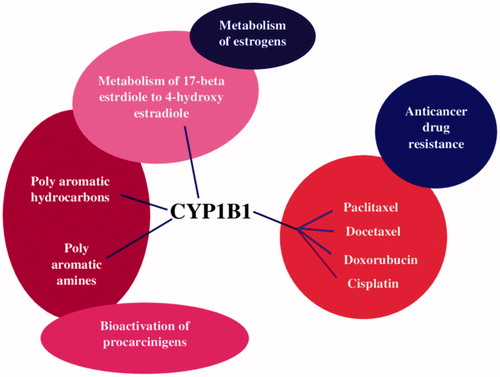
Figure 4. Biotransformation pathway of cyclophosphamide.
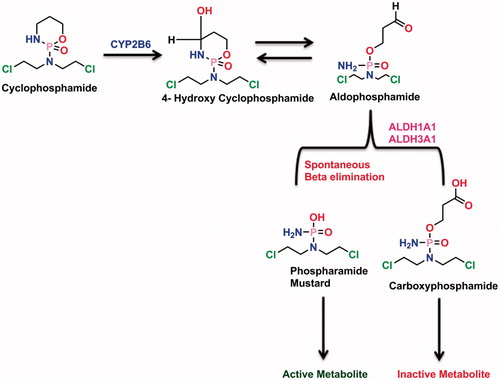
Figure 6. Comparision of predicted hydrogen abstraction energy (red) versus experimentally (blue) known major metabolic site of metabolism of CYP3A4 substrates.
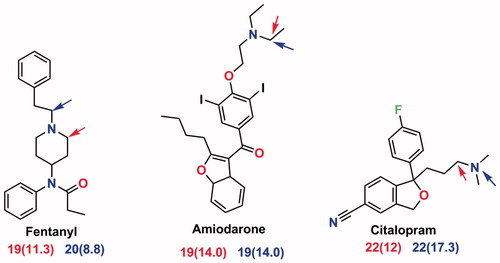
Figure 7. SOM prediction of RS-Predictor. Small red circles indicate experimentally predicted SOM, blue and green circles respectively represents the top two SOM predicted by RS-Predictor.
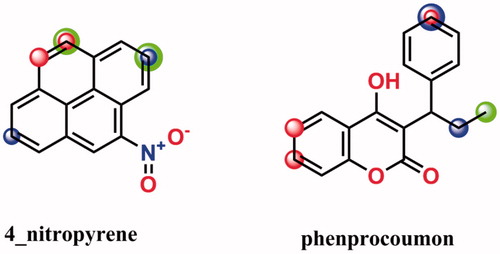
Figure 8. Analogue designing strategy of pinabulin to overcome drug resistance.
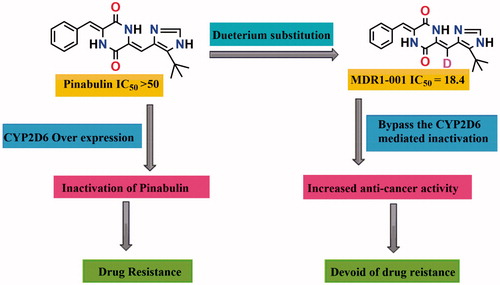
Figure 9. Strategy to design anticancer analogues with help of In-silico tools.
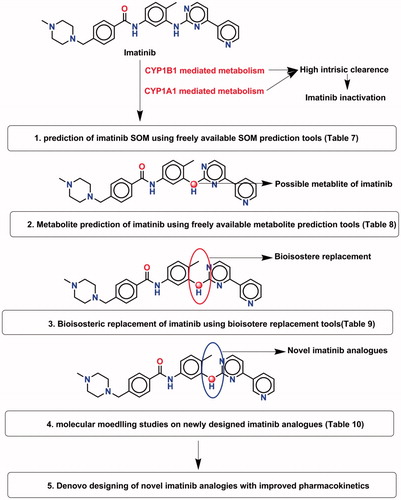
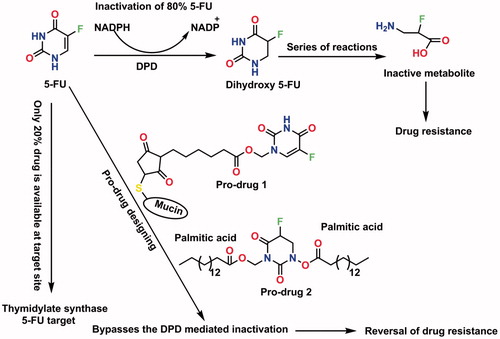
Figure 10. 5-FU inactivation pathway and pro-drug designing strategy.
The updated Figures are displayed below: