
Abstract
The nature of undesirable and unfilterable haze particles observed by craft breweries remains nebulous and presents a challenge when the aim is the production of bright beer. A commercial beer was studied in which the brewery had sporadically encountered unfilterable haze. In this study, it was hypothesized that unfilterable haze particles were formed due to increased concentrations of proteins, polyphenols, and/or beta-glucans. Samples of a high haze and low haze India Pale Ale were degassed and digested with enzymes amyloglucosidase, pepsin, and UltraFlo Max (NovozymesTM). Additionally, the protein, polyphenol, and beta-glucan content of each sample was measured. When comparing protein, polyphenol, and beta-glucan concentrations substantial differences between high haze and low haze protein concentrations were observed. Due to the unfilterable nature of these hazes, combined with experimental findings, it was hypothesized that yeast cell-wall proteins were responsible for this haze. Understanding of the source of these hazes offers brewers the opportunity to mitigate against their formation by adjusting brewing practices.
Introduction
Most beer in the world is sold as ‘bright’ meaning it is clear, with no apparent colloid formation, or any sign of turbidity.[Citation1] Physical stability is the term used to describe the maintenance of this desirable state. In these beers the occurrence of turbidity is undesirable, and, is more commonly referred to as ‘haze’. Increased beer turbidity is the result of various culprits such as microbial growth, poor extraction during mashing, protein-polyphenol complexes, β-glucans, inorganic materials from packaging, the formation of calcium oxalate, haze active proteins, and yeast cell-wall material.[Citation2,Citation3]
As previously reported, (primarily craft) breweries in Scotland and around the globe have observed persistent turbidity immediately following clarification procedures (F. Gormley, personal communication, 2015). The purpose of this study was to identify the ‘culprit’ of unfilterable turbidity in the production of an India Pale Ale. Current research commonly links proteins, polyphenols, protein-polyphenol complexes, and β-glucans with the formation of haze.[Citation3–9]
Polyphenols in brewing are derived from plant material, and therefore, in the case of beer, from malt and hops. Polyphenols provide antioxidative stability but are also associated with oxidative colloid formation when, at minimum, dimeric polyphenols cross link with protein in beer.[Citation8,10–11] Catechins cross-link with proteins rich in proline residues and form small flocs that grow with further polymerization.[Citation8] Although polyphenols are typically removed by filtration techniques, these compounds are often an important factor in turbidity concerns.
Protein in beer is derived from the cereals used to produce the wort,[Citation12–15] yeast cells,[Citation12,Citation13,Citation16] or in smaller quantities, hops.[Citation2] Protein levels as little as 2 mg/L have been reported to cause haze in beer.[Citation17,Citation18 ] In this study, samples with sporadic increases in turbidity and samples with ‘low/normal’ levels of turbidity were collected to assess differences in total protein, high molecular weight polyphenols, and high molecular weight β-glucan content. Enzymes were also used to digest haze particles to understand the primary composition of the beer haze in efforts to reduce it.
Understanding the source of haze will provide the first steps that must be undertaken to prevent the formation of unfilterable haze and to achieve the desired clarity for the final product.
Experimental
Samples
The control sample was a lager that had not been dry hopped, which had consistent low levels of turbidity < 1.0 EBC (European Brewing Convention) units and was produced in the same brewery as the experimental beers. The experimental beers used in the study were industrially produced ales with a dry hopping rate between 0.2-0.8 kg/hL, which were observed to return exceedingly high haze values (>5.0 EBC) apparently at random. Due to the sporadic occurrence of the haze, limiting parameters for high and low haze samples were selected. Any beers ≥5.0 EBC haze units were considered to be ‘high’ haze samples. Any beers ≤5.0 EBC were assigned to the ‘low/normal’ sample group. Low/normal haze samples were collected once per month, control samples were collected once per month for two months, and high haze samples were collected as observed. If turbidity did not decrease during maturation in the brewery, the batch was ‘flagged’ by the brewery laboratory. Control, high haze, and low haze samples were collected at packaging over nine months.
All samples were collected during routine packaging at the beginning, middle, and end of each run. At each sample point, three cases (24 bottles) of 330 mL cans were collected from the packaging line and a total packaged oxygen (TPO) reading was taken with a Haffmans Automatic InPack TPO/CO2 Meter (Pentair, Enschede, NLD).
Haze measurement
An Anton Paar DMA 4500 M density meter with attached HazeQC ME turbidity module, (Anton Parr, St. Albans, GBR) was used to measure EBC haze, light scatter at 25° in nephelometric turbidity units (NTU), and light scatter at 90° in NTU. The instrument was used for all haze analyses as it is approved by Mitteleuropäische Brautechnische Analysenkommission (MEBAK) and EBC guidelines were followed with a measurement standard deviation of ± 0.02 EBC (0.08 NTU).[Citation19] Turbidity in samples was measured by selecting the ‘Beer Turbidity − 20 °C’ method. The method measured the light scatter of the sample at 20 °C at 25° and 90° angle of incidences to the light source. The reported values were 25° nephelometric turbidity units (NTU) and 90° (NTU) from which European Brewing Convention (EBC) turbidity units were calculated.
Enzymatic digestion of beer haze
High, low/normal, and control 330 mL samples were collected in triplicate, all were individually decanted into 500 mL beakers with a magnetic stir bar and spun for at least 1 h at 500 RPM at room temperature. The pH was measured, and the turbidity of each sample was measured using an Anton Paar QCMe and HazeQCMe.
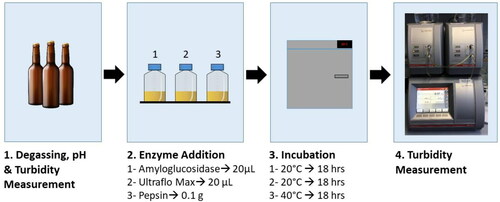
Methods described by Steiner et al.[Citation3] were used as a protocol to enzymatically digest the beer haze. Three 100 mL aliquots were decanted into separate 250 mL Duran bottles (Sigma Aldrich Poole, GBR). One enzyme treatment was dosed per bottle as follows: pepsin (≥97%, Porcine Gastric Mucosa, EC 3.4.23.1) (Merck, Darmstadt, DEU), amyloglucosidase (from Aspergillus niger, >260 U/mL) (AldrichChemio, Steinheim, DEU), and UltraFlo® Max (Novozymes, Bagvaerd, DNK) in concentrations of 1 mg/mL, 0.3 µL/mL, and 0.3 µL/mL, respectively. Each bottle was swirled to mix and the amyloglucosidase and UltraFlo® Max samples were placed into a 20 °C incubator, while pepsin samples were placed into a 40 °C water bath. All samples were incubated for 18 h.
Following incubation, sample bottles were left to settle for 1 h prior to measurement of settled particulates. The EBC Haze, 25° NTU, and 90° NTU values were measured at 20 °C and recorded for each enzyme treatment. A full workflow of the experiment is provided in .
Figure 1. Workflow of haze digestion experiments.
Wet chemical analysis of protein, polyphenol, and beta-glucans
Instrumentation
A Gallery™ Plus Beermaster Automated Photometric Analyzer (ThermoFisher Scientific, Perth, GBR) was used to measure protein, polyphenol, and β-glucan content in samples. The Beermaster contained pre-programmed wet chemical analytical EBC methods for beer samples. Start-up procedures and operating procedures were followed according to manufacturer instructions.
Calibration
Calibration standards for each test were prepared according to manufacturer instructions. Each calibration standard was prepared at least 12 h before analysis.
For each test, reagent kits were purchased from ThermoFisher Scientific. Each reagent kit was stored at the appropriate temperature and inserted into the instrument prior to analysis.
The calibration for protein, polyphenol and β-glucan were reviewed. If the coefficient of determination was ≥0.99, the calibration was accepted.
Sample preparation
Samples from each packaging collection point were prepared by degassing 330 ml of beer from the beginning, middle, and end of packaging by stirring with a magnetic stir bar at 450 RPM for a minimum of 30 min at room temperature. Aliquots of 30 mL were collected from each sample, labelled and frozen at −20 °C for analysis. Samples were frozen in triplicate.
Prior to analysis, beer samples were slowly thawed at ambient room temperatures (17 °C lab temperature). The thawed samples were inverted to mix, pipetted into vials for measurement, and analyzed. Samples were analyzed in duplicates.
Results were collected, collated, and analyzed using SYSTAT statistical software (Systat Software Inc., Chicago, U.S.A.) to create summary bar charts. RStudio (RCore Group, Vienna, AUT) was used to calculate probability values (p < 0.5) using Tukey’s Post-Hoc Test (Samples section). The analysis of the protein, polyphenol, and β-glucan data was used to inform subsequent research described in Part II of this work.
Results
Enzymatic digestion of beer haze
The purpose of the enzymatic digestion of beer haze was to assess if the enzymes degraded specific macromolecules in beer and to assess the change in the turbidity pre- and post-enzymatic digestion. Pepsin degrades proteins in beer, amyloglucosidase degrades dextrins and starches and Ultraflo® Max degrades β-glucans, all of which are haze potentiating materials. All of the enzymes were observed to reduce the haze values. Tables of pre- and post-digestion averages and the probability that the difference of the pre- and post-digestion values were significant (p < 0.05) are found in . The difference between pre- and post-digestion and the analysis of variance (ANOVA) were calculated in RStudio. SYSTAT was used to visually display the differences in digestions (). In all cases, the ANOVA p-values comparing normal to control samples were not significant (p > 0.05) (), all other cases were found to be significant (p < 0.05) ().
Figure 2. Comparison of pre- and post-digestion values of amyloglucosidase, pepsin, and Ultraflo® Max in control, normal, and high haze beer utilizing EBC units. The dotted line represents the value at which samples were classified as high haze. Normal haze samples contained n = 7 brews, high haze samples contained n = 5 brews, and control samples contained n = 2 brews. Error bars indicate one standard deviation.
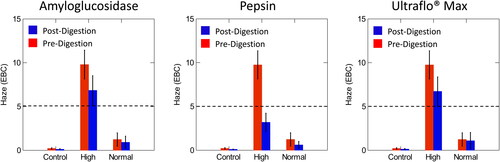
Figure 3. Comparison of pre- and post-digestion values of amyloglucosidase, pepsin, and Ultraflo® Max in control, normal and high haze beer measured at a 25° angle compared to the light axis. The dotted line represents the value at which samples were classified as high haze. Normal haze samples contained n = 7 brews, high haze samples contained n = 5 brews, and control samples contained n = 2 brews. Error bars indicate one standard deviation.
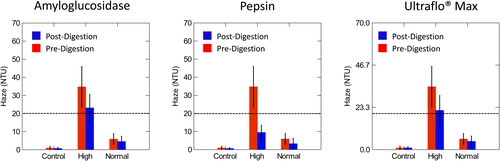
Figure 4. Comparison of pre- and post- digestion values of amyloglucosidase, pepsin, and Ultraflo® Max in control, normal, and high haze beer measured at a 90° angle compared to the light axis. The dotted line represents the value at which samples were classified as high haze. Normal haze samples contained n = 7 brews, high haze samples contained n = 5 brews, and control samples contained n = 2 brews. Error bars indicate standard deviation.
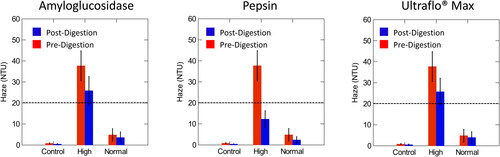
Table 1. Averages, standard deviation (S.D.), and p-values obtained from a paired t-test of normal/low haze pre- and post-digestion values (n = 7 brews).
Table 2 . Averages, standard deviation (S.D.), and p-values obtained from a paired t-test of high haze pre- and post-digestion values (n = 7 brews).
Table 3. Averages, standard deviation (S.D.), and p-values obtained from a paired t-test of control haze pre- and post-digestion values (n = 7 brews).
Table 4. ANOVA of the differences in turbidity values, post-digestion, of high, normal, and control beer samples after each enzyme treatment at each angle of incidence measured.
A paired t-test was used to assess pre- and post-digestion values in the high, normal, and control samples. All pre- and post-digestion differences were significant (p < 0.05) (), with the exception of Ultraflo® Max at the 25° angle of incidence in the control samples, which was the only case where pre- and post-digestion values were not significantly different from one another ().
Overall, pepsin was the only enzyme to digest colloid particles to a value below the set threshold for ‘high haze’ of 5.0 EBC/20 NTU (). When assessing pre- and post-digestion values, all cases utilizing the enzyme pepsin caused a significant decline and were observed to have the greatest difference, pre-post digestion regardless of the assessment method used (EBC, 25° or 90° angle (NTU)).
Ultraflo® Max did not digest β-glucans to reduce the haze below the 5.0 EBC/20 NTU, the qualifier to classify these samples as low haze (). Also, digestion with amyloglucosidase did not have a significant impact on the digestion of dextrins or starch residues and did not reduce the turbidity levels to below 5.0 EBC/20 NTU ().
Wet-chemical analysis
The Beermaster data was collated and analyzed utilizing SYSTAT, and P-values were calculated in RStudio to assess significant differences between samples (R Core Group). The polyphenol and protein concentrations were not found to be significantly different in control and high haze samples ( and ). Interestingly, all normal and control sample values, were significantly different (). Excluding the control samples, high molecular weight β-glucan was the only macromolecule recorded at higher concentrations in high haze beer (34.73 mg/L) than in low haze beer (28.18 mg/L) ( and ). The high haze samples reported lower values of polyphenol and protein (). It is suggested that results of the wet chemical tests may not have been representative of the actual concentrations of proteins and polyphenols as the materials may have complexed and therefore, could not be the detected at their true concentration in the assays. It is possible that freezing the samples may have forced complexing or degraded some polyphenol content.
Figure 5. Concentration of total proteins in control, high, and normal haze samples with corresponding p-values calculated by Tukey’s Significant Different Test. Normal haze samples contained n = 7 brews, high haze samples contained n = 5 brews, and control samples contained n = 2 brews. Error bars indicate one standard deviation.
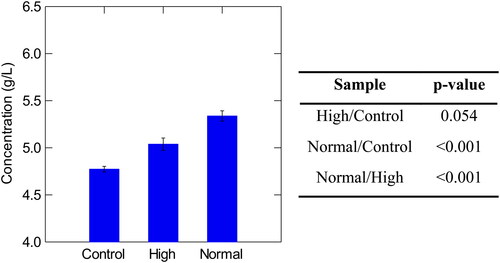
Figure 6. Concentration of total polyphenols in control, high, and normal haze samples with corresponding p-values Tukey’s Significant Different Test. Normal haze samples contained n = 7 brews, high haze samples contained n = 5 brews, and control samples contained n = 2 brews. Error bars indicate one standard deviation.
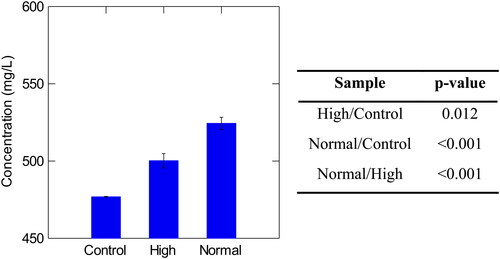
Figure 7. Concentration of high molecular weight β-glucans in control, high, and normal haze samples with corresponding p-values Tukey’s Significant Different Test. Normal haze samples contained n = 7 brews, high haze samples contained n = 5 brews, and control samples contained n = 2 brews. Error bars indicate one standard deviation.
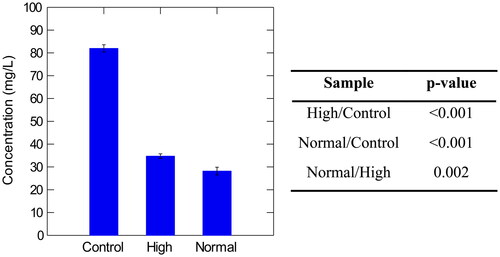
Table 5. Average values of high molecular weight β-glucan, total polyphenol, and total protein in normal, high, and control samples with corresponding standard deviations (S.D.).
Discussion
Enzymatic digestion of beer haze
Differing angles of incidence (NTU), as well as EBC values, were considered when analyzing pre- and post-digestion results. Assessing these values provided information on colloid particle composition, which was useful in speculating what may have induced the unfilterable turbidity. Measuring particle sizes at a 90° angle to the light axis measures small particles such as proteins and carbohydrates. Measuring particle sizes at a 25° angle to the light axis measures larger particles in beer such as yeast cells and inorganic material.[Citation20] Protein particles in beer tend to be quite small and complexes of protein and polyphenol tend to range from 0.1-1.0 µm in diameter.[Citation4] However, carbohydrate residues, such as high molecular weight β-glucan (31-433 kDa) are reported to be even smaller, with a size range from 0.01-0.1 µm in diameter.[Citation21] As the concentration of high molecular weight β-glucans measured in the experiment were slightly elevated in the high haze samples compared to the normal haze samples, high molecular weight β-glucans were suspected to be a culprit in unfilterable turbidity.
Overall, pepsin was the only enzyme to digest the colloid particles to a value below the 5.0 EBC/20 NTU accepted turbidity values in the study (). When assessing pre- and post-digestion values, all haze values (EBC, 25° angle (NTU), and 90° angle (NTU)) utilizing the enzyme pepsin were significant (p < 0.05) and showed the greatest difference, pre-post digestion.
Previous research has determined that only one-third of proteins survive the brewing process into final pack beer as most proteins are lost in boiling, fermentation, and filtration processes.[Citation15] Beer contains approximately 500 mg/L of total protein but only 2 mg/L is required to form hazes in beer.[Citation3] The significant (p < 0.0001) drop in turbidity, following the addition of pepsin, indicated that proteins in the high haze samples were at a higher concentration than the proteins present in low haze samples. The observed degradation also indicated that proteins could have been the culprit in the increased turbidity. It is possible that some proteinaceous particles were below 1.0 µm in diameter, passing through a 0.45 µm filter sheet. A filter sheet with a 0.45 µm pore size was used by the brewery as a part of normal packaging processes, therefore, it was suggested that β-glucans could have also contributed to the increased turbidity values.
Beta-glucan turbidity values, post-digestion via Ultraflo® Max at the 25° light angle were close to the 20 NTU ‘low/normal haze’ acceptance limit. Malt derived β-glucan could have contributed to turbidity with a non-homogenous malt containing some undermodified malt, thus increasing the β-glucan levels. Additionally, it is possible that malt α-amylase activity was not sufficient to degrade fine starch particles.[Citation3,Citation18] However, if these speculations are correct, the variations would be so minor that poor friability or positive iodine test data would not be observed under normal conditions.
After a review of all of the enzymatic digestion results, it was hypothesized that proteins contributed to the sporadic beer turbidity.
Wet chemical analysis
The samples were selected for the study to assess the difference in macromolecule content between high and low haze samples and the difference between samples consistently low in turbidity (control). The control and test samples were two different beers containing different base malts but were selected to determine if a large outstanding difference in macromolecule content of the control samples greatly differed from the test samples. If this were the case, it could have provided an explanation as to why turbidity spikes were observed in the normal/high haze ‘test’ beers. From the samples, there were no distinct differences between control and test samples related to haze formation (). The elevated protein and polyphenol content in the ‘normal’ haze beer, when compared to the ‘control’ could explain a potential reason as to why elevated turbidity levels were observed. This could also explain the low levels of protein and polyphenol in high haze beer, as these macromolecules were likely complexed, increasing turbidity. However, during separation procedures (i.e., centrifugation and filtration), the complexes should have easily been removed. Some small complexes <0.1 µm may have still been able to pass through the filter sheets.
The high standard deviation for polyphenol measurements, across all sample groups, was expected as polyphenol concentrations will vary per brew and dry-hop regime. Hop-derived and malt-derived polyphenols vary slightly with each brew due to the normal process variations in raw materials.
Interestingly, β-glucan was the only macromolecule present in elevated concentrations in high haze samples compared to low haze samples. The large degradation of protein in the enzymatic digestion study and the wet chemical analysis results appear to contradict each however, the yeast cell wall structures may help explain this ().
Figure 8. Molecular organization of Saccharomyces cerevisiae cell wall adapted from Klis et al. and Lipke and Ovall.[Citation22,Citation23] The mannoprotein is orange and N-linked or O-linked oligosaccharides are blue. The intercellular β-glucan is in the box and chitin is inside the cell.
![Figure 8. Molecular organization of Saccharomyces cerevisiae cell wall adapted from Klis et al. and Lipke and Ovall.[Citation22,Citation23] The mannoprotein is orange and N-linked or O-linked oligosaccharides are blue. The intercellular β-glucan is in the box and chitin is inside the cell.](/cms/asset/ed16de8e-8711-4304-8711-fbcaf688b5dd/ujbc_a_1937460_f0008_c.jpg)
It is hypothesized that stressed storage conditions, propagation, or fermentation conditions affect the configuration and structure of yeast cell walls. The yeast cell wall composition has been found to be dependent upon the growth conditions of the media the cells are suspended in.[Citation24,Citation25]
Yeast cell walls consist of three groups of polysaccharides: mannose residues bound to proteins (mannoproteins, approx. 40% dry cell mass), glucose polymers (β-glucan, 60% of dry cell mass), and N-acetylglucosamine (chitin, 2% of dry cell mass).[Citation24] Cell wall β-glucan is split into two categories based upon the degree of polymerization. Long-chain β-glucans consist of approximately 1500 β-1,3-glucose monomers (85% of β-glucan units) while short chain β-glucans consist of approximately 150 β-1,6-glucose monomers (15% of β-glucan content).[Citation22] Short-chain β-1,3-glucans exist within the cell wall and form a network by hydrogen bonding between molecules. Long-chain β-1,6-glucan molecules are highly branched, extracellular to the cell wall, anchored by bonds to β-1,3-glucans and are water soluble.[Citation22,Citation23] The water solubility of β-1,6-glucans allow glycosylphosphatidylinositol (GPI)-cell wall proteins (CWP) to be tethered to β-1,3-glucans within the cell wall. Cell-wall proteins (CWP) or mannoproteins are glycosidically linked to these polysaccharides, forming the outer cell wall layer ().[Citation22]
Cell wall proteins attached to cell wall β-glucans are divided into two categories based upon covalent bonding properties. The first group of covalently linked cell wall proteins observed in Saccharomyces cerevisiae are the GPI modified intermediate proteins. Cell wall proteins can attach to a GPI anchor by hydrolyzation of an oligomannosyl group of the GPI lipid anchor, which results in a trans-mannosylation. Interestingly, the GPI-CWP can be excised from the cell wall by β-1,6 and β-1,3 glucanases as the GPI-CWP are linked to β-1,6-glucan tethered to the β-1,3-glucan network in the cellular membrane.[Citation22,Citation26]
Second, putative proteins with internal repeats, or Pir proteins, are conserved and consist of at most, ten repeating units.[Citation26] Pir proteins are directly linked to β-1,3-glucan and do not contain a GPI-addition signal at the C-terminus end. The Pir cell wall proteins are immediately linked to β-1,3-glucan and these cell wall proteins can be excised from the cell wall by β-1,3-glucanase. Multiple classes of Pir proteins exist. However, some phenotypes of Pir proteins are expressed as a result of nitrogen starvation and heat stress, potentially aiding in the formation of sporadic hazes in beer.[Citation26]
Attached to the GPI or Pir protein anchors, cellular mannoproteins have a variety of different functions. Cell wall mannoprotein, Cwp1, is observed on yeast cells in rich medium with a GPI-link.[Citation22,Citation27,Citation28] When considering beer haze, the absence of mannoprotein Cwp1 and gene CWP1 may have detrimental effects on beer quality as the pair strengthen yeast cell walls. Cwp1 can also bind directly to β-1,3-glucan by an alkali-sensitive bond via a Pir-CWP binding mechanism.[Citation22,Citation28–30] Double-linked GPI-CWP’s such as Cwp1 are reported to be relevant to the cellular-response to cell wall stress, while Pir encoding genes are upregulated in the instance of cell wall stress.[Citation22,Citation31–33]
The links of β-1,6-glucan, β-1,3-glucan, chitin, and mannan stabilize the cell wall, causing the wall to be insoluble.[Citation34] However, it is hypothesized that under situations of induced cell stress (low nutrient and low oxygen environments), the glucan network/bonds will lose their structure causing the cell walls to become more soluble, releasing some intracellular components. The cell wall glucans released from mannoproteins remain as an insoluble fraction, which is hypothesized to also cause insoluble, unfilterable hazes.[Citation34]
Finally, mechanical damage from pumps in pitching steps and tank transfers may have induced shear damage to yeast cells contributing to increased turbidity. Laboratory scale and pilot scale studies have confirmed the release of mannan from lager and ale strains by means of mechanical agitation.[Citation35] In laboratory scale studies, the release of mannan increased the turbidity of the supernatant the yeast was suspended in.[Citation36] In pilot scale studies, after beer was subjected to centrifugation, mannan was observed in the haze material originating from the exterior of yeast cells and was reported to be unfilterable.[Citation35]
The evidence from the literature supports the hypothesis that cell wall mannoproteins are related to unfilterable turbidity.[Citation28,Citation35–38] Consideration of the enzymatic digestion and wet-chemical analysis results, led to the hypothesis that yeast cells in propagation, storage, transfers, and acid washing were occasionally exposed to stress-inducing environments, causing sporadic increases in turbidity. To prove this hypothesis, protein precipitation, protein fractionation, and LC-QTOF-MS was required and undertaken in Part II of the study.
Conclusion
It is important to acknowledge the importance of statistical analysis of brewery data and simple wet-chemical testing as a tool in industrial breweries. Using statistical analysis to assess data trends is a low-cost method to diagnose issues, before they become a quality concern, and to improve brewery processes.
Part I of the paper has discussed the diagnostic studies undertaken in identifying the source of an unfilterable haze in an India Pale Ale. The study is continued in Part II, which discusses the successful analytical techniques utilized to determine the source of the unfilterable haze.
Disclosure statement
No potential conflict of interest was reported by the authors.
Additional information
Funding
Literature cited
- Stewart, G. G. The Chemistry of Beer Instability. J. Chem. Educ. 2004, 81, 963–968. DOI: https://doi.org/10.1021/ed081p963.
- Neugrodda, C.; Gastl, M.; Becker, T. Protein Profile of Hop (Humulus lupulus L.) Varieties. J. Am. Soc. Brew. Chem. 2014, 72, 184–191. DOI: https://doi.org/10.1094/ASBCJ-2014-0629-01.
- Steiner, E.; Becker, T.; Gastl, M. Turbidity and Haze Formation in Beer- Insights and Overview. J. Inst. Brew. 2010, 116, 360–368. DOI: https://doi.org/10.1002/j.2050-0416.2010.tb00787.x.
- Bamforth, C. Beer Haze. J. Am. Soc. Brew. Chem. 1999, 57, 81–90. DOI: https://doi.org/10.1094/ASBCJ-57-0081.
- Iimure, T.; Nankaku, N.; Watanabe-Sugimoto, M.; Hirota, N.; Tiansu, Z.; Kihara, M.; Hayashi, K.; Ito, K.; Sato, K. Identification of Novel Haze-Active Beer Proteins by Proteome Analysis. J. Cereal Sci. 2009, 49, 141–147. DOI: https://doi.org/10.1016/j.jcs.2008.08.004.
- Jin, Y.-L.; Speers, R. A.; Paulson, A. T.; Stewart, R. J. Effects of Beta-Glucans, Shearing, and Environmental Factors on Wort Filtration Performance. J. Am. Soc. Brew. Chem. 2004, 62, 155–162. DOI: https://doi.org/10.1094/ASBCJ-62-0155.
- McMurrough, I.; Madigan, D.; Kelly, R. J.; Smyth, M. R. The Role of Flavanoid Polyphenols in Beer Stability. J. Am. Soc. Brew. Chem. 1996, 54, 141–148. DOI: https://doi.org/10.1094/ASBCJ-54-0141.
- Siebert, K. J.; Carrasco, A.; Lynn, P. Y. Formation of Protein-Polyphenol Haze in Beverages. J. Agric. Food Chem. 1996, 44, 1997–2005. DOI: https://doi.org/10.1021/jf950716r.
- Bamforth, C. 125th Anniversary Review: The Non-Biological Instability of Beer. J. Inst. Brew. 2011, 117, 488–497. DOI: https://doi.org/10.1002/j.2050-0416.2011.tb00496.x.
- Aron, P.; Shellhammer, T. A Discussion of Polyphenols in Beer Physical and Flavour Stability. J. Inst. Brew. 2010, 116, 369–380. DOI: https://doi.org/10.1002/j.2050-0416.2010.tb00788.x.
- Qureshi, A.; Burger, W.; Prentice, N. Polyphenols and Pyrazines in Beer during Aging. J. Am. Soc. Brew. Chem. 1979, 37, 161–163. DOI: https://doi.org/10.1094/ASBCJ-37-0161.
- Colgrave, M.; Goswami, H.; Howitt, C. A.; Tanner, G. Proteomics as a Tool to Understand the Complexity of Beer. Food Res. Int. 2013, 54, 1001–1012. DOI: https://doi.org/10.1016/j.foodres.2012.09.043.
- Fasoli, E.; Aldini, G.; Regazzoni, L.; Kravchuk, A. V.; Citterio, A.; Righetti, P. G. Les Maîtres de L’orge: The Proteome Content of Your Beer Mug. J. Proteome Res. 2010, 9, 5262–5269. DOI: https://doi.org/10.1021/pr100551n.
- Jin, B.; Li, L.; Feng, Z.-C.; Li, B.; Liu, G.-Q.; Zhu, Y.-K. Investigation of the Relationship of Malt Protein and Beer Haze by Proteome Analysis. J. Food Process. Preserv. 2012, 36, 169–175. Blackwell Publishing Inc, DOI: https://doi.org/10.1111/j.1745-4549.2011.00571.x.
- Steiner, E.; Gastl, M.; Becker, T. Protein Changes during Malting and Brewing with Focus on Haze and Foam Formation: A Review. Eur. Food Res. Technol. 2011, 232, 191–204. DOI: https://doi.org/10.1007/s00217-010-1412-6.
- Berner, T. S.; Jacobsen, S.; Arneborg, N. The Impact of Different Ale Brewer’s Yeast Strains on the Proteome of Immature Beer. BMC Microbiol. 2013, 13, 215–223. DOI: https://doi.org/10.1186/1471-2180-13-215.
- Kaersgaard, P.; Hejgaard, J. Antigenic Beer Macromolecules- an Experimental Survey of Purification Methods. J. Inst. Brew. 1979, 85, 103–111. DOI: https://doi.org/10.1002/j.2050-0416.1979.tb06836.x.
- Ye, L.; Huang, Y.; Li, M.; Li, C.; Zhang, G. The Chemical Components in Malt Associated with Haze Formation in Beer. J. Inst. Brew. 2016, 122, 524–529. DOI: https://doi.org/10.1002/jib.353.
- Anton-Paar. Instruction Manual-Haz eQC ME Turbidity Measuring Module Firmware Version:1.000.028. Anton Paar GMBH. Graz, Austria, 2015.
- Gales, P. A Comparison of Visual Turbidity with Turbidity Measured by Commercially Available Instruments. J. Am. Soc. Brew. Chem. 2000, 58, 101–107. DOI: https://doi.org/10.1094/ASBCJ-58-0101.
- Speers, A.; Jin, Y.; Paulson, A.; Stewart, R. Effects of Beta-Glucan, Shearing, and Environmental Factors on the Turbidity of Wort and Beer. J. Inst. Brew. 2003, 109, 236–244. DOI: https://doi.org/10.1002/j.2050-0416.2003.tb00164.x.
- Klis, F.; Mol, P.; Hellingwerf, K.; Brul, S. Dynamics of Cell Wall Structure in Saccharomyces cerevisiae. FEMS Microbiol. Rev. 2002, 26, 239–256. DOI: https://doi.org/10.1111/j.1574-6976.2002.tb00613.x.
- Lipke, P.; Ovalle, R. Cell Wall Architecture in Yeast: New Structure and New Challenges. J. Bacteriol. 1998, 180, 3735–3740. doi: https://doi.org/10.1016/j.neulet.2015.09.034.
- Aguilar-Uscanga, B.; François, J. M. A Study of the Yeast Cell Wall Composition and Structure in Response to Growth Conditions and Mode of Cultivation. Lett. Appl. Microbiol. 2003, 37, 268–274. DOI: https://doi.org/10.1046/j.1472-765X.2003.01394.x.
- Kwiatkowski, S.; Thielen, U.; Glenney, P.; Moran, C. A Study of Saccharomyces cerevisiae Cell Wall Glucans. J. Inst. Brew. 2009, 115, 151–158. DOI: https://doi.org/10.1002/j.2050-0416.2009.tb00361.x.
- Ecker, M.; Deutzmann, R.; Lehle, L.; Mrsa, V.; Tanner, W. Pir Proteins of Saccharomyces cerevisiae Are Attached to-1,3-Glucan by a New Protein-Carbohydrate Linkage. J. Bacteriol. Chem. 2006, 281, 11523–11529.
- Dean, N. Asparagine-Linked Glycosylation in the Yeast Golgi. Biochem. Biophys. Acta 1999, 1426, 309–322. DOI: https://doi.org/10.1016/S0304-4165(98)00132-9.
- Mrsa, V.; Ecker, M.; Strahl-Bolsinger, S.; Nimtz, M.; Lehle, L.; Tanner, W. Deletion of New Covalently Linked Cell Wall Glycoproteins Alters the Electrophoretic Mobility of Phosphorylated Wall Components of Saccharomyces cerevisiae. J. Bacteriol. 1999, 181, 3076–3086. DOI: https://doi.org/10.1128/JB.181.10.3076-3086.1999.
- Kapteyn, J. C.; Van Egmond, P.; Sievi, E.; Van Den Ende, H.; Makarow, M.; Klis, F. M. The Contribution of the O-Glycosylated Protein Pir2p/Hsp150 to the Construction of the Yeast Cell Wall in Wild-Type Cells and β1,6-Glucan-Deficient Mutants. Mol. Microbiol. 1999, 31, 1835–1844. DOI: https://doi.org/10.1046/j.1365-2958.1999.01320.x.
- Toh-E, A.; Oguchi, T.; Matsui, Y.; Yasunaga, S.; Nisogi, H.; Tanaka, K. Three Yeast genes, PIR1, PIR2 and PIR3, containing internal tandem repeats, are related to each other, and PIR1 and PIR2 are required for tolerance to heat shock. Yeast 1993, 9, 481–494. DOI: https://doi.org/10.1002/yea.320090504.
- Jung, U. S.; Levin, D. Genome-Wide Analysis of Gene Expression Regulated by the Yeast Cell Wall Integrity Signalling Pathway. Mol. Microbiol. 1999, 34, 1049–1057. DOI: https://doi.org/10.1046/j.1365-2958.1999.01667.x.
- Ram, A.; Kapteyn, J.; Montijn, R.; Heleen, L.; Caro, P.; Douwes, J. E.; Baginsky, W.; Mazur, P.; Van Den Ende, H.; Klis, F. M.; et al. Loss of the Plasma Membrane-Bound Protein Gas1p in Saccharomyces cerevisiae Results in Release of Beta1,3-Glucan into the Medium and Induces a Compensation Mechanism to Ensure Cell Wall Integrity. J. Bacteriol. 1998, 180, 1170–1418. DOI: https://doi.org/10.1128/JB.180.6.1418-1424.1998.
- Terashima, H.; Yabuki, N.; Arisawa, M.; Hamada, K.; Kitada, K. Up-Regulation of Genes Encoding Glycosylphosphatidylinositol (GPI)-Attached Proteins in Response to Cell Wall Damage Caused by Disruption of FKS1 in Saccharomyces cerevisiae. Mol. Gen. Genet. 2000, 264, 64–74. DOI: https://doi.org/10.1007/s004380000285.
- Kwiatkowski, S.; Kwiatkowski, S. E. Yeast (Saccharomyces cerevisiae) Glucan Polysaccharides - Occurrence, Separation and Application in Food, Feed and Health Industries. In The Complex World of Polysaccharides; Karunaratne, D., Ed.; InTech, London, 2012; pp 47–70. DOI: https://doi.org/10.5772/48100.
- Chlup, P. H.; Conery, J.; Stewart, G. G. The Disc Stack Centrifuge and Its Impact on Yeast and Beer Quality. J. Am. Soc. Brew. Chem. 2007, 65, 29–37. DOI: https://doi.org/10.1094/ASBCJ-2007-0116-02.
- Chlup, P.; Conery, J.; Stewart, G. Detection of Mannan from Saccharomyces cerevisiae by Flow Cytometry. J. Am. Soc. Brew. Chem. 2007, 65, 151–156. DOI: https://doi.org/10.1094/ASBCJ-2007-0620-01.
- Siebert, K.; Stenroos, L.; Grabowski, D. Filtration Difficulties Resulting from Damage to Yeast during Centrifugation. Tech. Q. Master Brew. Assoc. Am. 1987, 24, 1–8. https://www.mbaa.com/publications/tq/tqPastIssues/1987/Abstracts/tq87ab04.htm (Accessed: 6 November 2018).
- Van Der Vaart, J. M.; Heleen, L.; Caro, P.; Chapman, J.; Klis, F.; Verrips, C. T. Identification of Three Mannoproteins in the Cell Wall of Saccharomyces cerevisiae. J. Bacteriol. 1995, 177, 3104–3110. DOI: https://doi.org/10.1128/jb.177.11.3104-3110.1995.