
Abstract
Hop-derived esters contribute to beer flavor and changes in the ester spectrum are believed to be an important driver in the flavor–instability of hoppy beers. To date, there exists no published method that enables reliable quantification of hop-derived esters in beer. As the availability of such a method is vital to enlarge the understanding of beer flavor stability, the current article is concerned with the development, validation, and application of a headspace solid phase microextraction gas chromatography selected ion monitoring mass spectrometry (HS-SPME-GC-SIM-MS) based methodology for quantification of 16 hop-derived esters in beer. The validation data shows that choosing suitable HS-SPME-GC-SIM-MS conditions enabled reliable quantification of esters across a range of 1–200 µg/L, with calculated limits of quantification being well below 1 µg/L. Spiking experiments using terpenes and terpenoids evidenced method robustness, most importantly when two commercially available stable isotope labeled internal standards (d6-geranyl acetate and 13C-methyl octanoate) were used. Application to beer samples indicated that beers brewed with different qualities/quantities of hops and differing in freshness could be well differentiated by HS-SPME-GC-SIM-MS analysis of their ester profile.
Supplemental data for this article is available online at at https://doi.org/10.1080/03610470.2021.1994814 .
Introduction
In recent years, hoppy beer styles such as India Pale Ales (IPAs) have gained worldwide consumer acceptance.[Citation1] In the production of those beers, large quantities of hops are added late in the boil, during wort transfer into the whirlpool, and most importantly to green- or end-fermented beer in the cellar (dry-hopping). These hop additions can practically be executed in multiple ways and lead to the accumulation of hop volatiles in beer.[Citation2] The increasing hopping rates used in the industry and the increasing interest in gaining a profound chemical understanding of hoppy-beer flavor relate.[Citation1] Even though the aroma of hops and the aroma of hoppy beer differ, there is clear evidence for the presence of hop varietal aromas in beer and its relation to thiols[Citation3,Citation4] and esters.[Citation5] While thiols are minor constituents of hops[Citation6] and beer,[Citation7] esters represent a major share of hop essential oil (15%)[Citation8] and some esters, for example 2-methylbutyl isobutyrate (2-MBIB), are found in concentrations of >500 µg/L beer.[Citation9,Citation10]
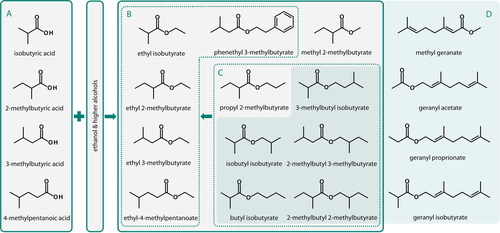
In chemistry, compounds formally derived from an (in)organic acid in which at least one hydroxyl group is replaced by an (alcohol derived) alkoxy group are named ester.[Citation11] Given the multiplicity of acids and alcohols present in hops and hoppy beer, it is not surprising that both matrices also contain a wide range of methyl-, acetate-, ethyl-, isobutyl-, and geranyl-esters. Amongst the multiplicity of esters found in beer, two groups of esters appear of prior ranking importance: The first group includes esters that are formed from hop-derived short-chain acids or esters during fermentation[Citation12–14] or upon beer storage.[Citation15,Citation16] These are ethyl isobutyrate, ethyl 3-methylbutyrate, ethyl 2-methylbutyrate, ethyl 4-methylpentanoate, and phenethyl 3-methylbutyrate ().[Citation12,Citation14] Second, hoppy beer contains esters originating from hop plant metabolism that are transferred into beer as hops are added. This second group includes 2-MBIB, isobutyl isobutyrate, and isoamyl isobutyrate,[Citation5,Citation9,Citation10] as well as a series of geranyl-esters such as methyl geranate, geranyl propionate, geranyl isobutyrate, or geranyl acetate (). summarizes the origin of hop-derived esters in beer and attempts to visualize how these esters and their chemical structures relate to each other. The esters shown in also represent the target compounds of the method development described herein. highlights esters typically found in hop oil, and please note that 2-MBIB is not included as the analysis and relevance of this ester was described earlier.[Citation10] illustrates the structural formulas of hop-derived short-chain acids that are esterified with ethanol and higher alcohols giving rise to the esters displayed in . illustrates that not only short-chain acids but also a range of hop-derived esters are precursors of the ester shown in .
Figure 1. Graphical summary of the chemical structures, formation, and degradation reactions of hop-derived esters in beer. Some esters found in hoppy beer (B) can be formed by esterification of hop-derived monocarboxylic acids (A) or by transesterification hop-derived esters (C). Esters typically found in hop oil (D) also include several geranyl-esters.
As reported earlier,[Citation10,Citation17,Citation18] the chemistry of esters during beer production and storage is complex and the underlying (bio) chemistry is yet poorly understood. While the formation of esters during beer manufacturing might positively affect fresh beer flavor, the changes in ester profile upon aging are undesired and likely contribute to flavor changes as hoppy beer ages.[Citation9,Citation19] While the fate of individual compounds, such as for 2-MBIB or ethyl 2-methylbutyrate has been described before,[Citation10,Citation20] comprehensive studies on the ester profile changes are still missing. One of the key challenges in tracking changes in the overall ester profile during brewing and storage is the lack of analytical techniques that evidently offer a suitable limit of detection (LOD), limit of quantification (LOQ), measurement precision, and ruggedness to reliably quantify esters in beer. As reflected by the literature cited above, there exist methodologies that enable analysis of hop-derived esters from beer. While some are technically outdated,[Citation16] others do either only include individual esters,[Citation9,Citation19] or are semi-quantitative.[Citation5,Citation21]
Based on the desire to further explore the ester chemistry in hoppy beer and the lack of suitable analytical methods, the current article is concerned with (1) the development of a HS-SPME-GC-MS based methodology for quantification of 16 hop-derived esters in beer, (2) validation and robustness testing of the method, and (3) application to a set of beers differing in style and age.
Experimental
Chemicals
Analytical standards of butyl isobutyrate (CAS Registry Number: 97-87-0, ≥97%), ethyl isobutyrate (CAS Registry Number: 97-62-1, p.a.), ethyl 4-methylpentanoate (CAS Registry Number: 25415-67-2, ≥97%), 3-methylbutyl isobutyrate (CAS Registry Number: 2050-01-3, ≥98%), 2-methylbutyl 2-methylbutyrate (CAS Registry Number: 2445-78-5, ≥98%), 2-methylbutyl 3-methylbutyrate (CAS Registry Number: 2445-77-4, ≥98%), geranyl propionate (CAS Registry Number: 105-90-8, > 95%), geranyl acetate (CAS Registry Number: 105-87-3, >95%), and geranyl isobutyrate (CAS Registry Number: 2345-26-8) were obtained from Sigma-Aldrich (Steinheim, Germany). Ethyl 3-methylbutyrate (CAS Registry Number: 108-64-5, 99%), isobutyl isobutyrate (CAS Registry Number: 97-85-8, 98%), and phenethyl 3-methylbutyrate (CAS Registry Number: 140-26-1, 99%) were purchased from J&K Scientific GmbH (Pforzheim, Germany). Methyl 2-methylbutyrate (CAS Registry Number: 868-57-5), ≥98%) and ethyl 2-methylbutyrate (CAS Registry Number: 7452-79-1, 95%) were purchased from Honeywell Fluka (Seelze, Germany). Propyl 2-methylbutyrate (CAS Registry Number: 37064-20-3, > 98%) was obtained from Tokyo Chemical Industry (Tokyo, Japan) and methyl geranate (CAS Registry Number: 1189-09-9, mixture of isomers, 94%) was purchased from Alfa Aesar (Haverhill, United States). d6-Geranyl acetate (>95%, aromaLAB, Planegg, Germany) and 13C-methyl octanoate (99 atom % 13C, Sigma-Aldrich) were used as internal standards (ISTDs). ISTDs were diluted in ethanol (≥99.9%, Th. Geyer, Berlin, Germany) and this stock mix (2 mg/L for each ISTD) was then used to spike samples prior to analysis (see below). Accordingly, an ethanolic ester stock mix, herein referred to as EESM, including all 16 analytes (2 mg/L each) was prepared. α-Pinene (CAS Registry Number: 80-56-8, 98%), β-pinene (CAS Registry Number: 18172-67-3, 99%), myrcene (CAS Registry Number: 125-35-3, >95%), limonene (CAS Registry Number: 5989-27-5, 97%), linalool oxide (mixture of 54% cis-isomers and 46% trans-isomers) (CAS Registry Number: 60047-17-8, >97%), linalool (CAS Registry Number: 78-70-6, 97%), citronellol (CAS Registry Number: 7540-51-4, 99%), nerol (CAS Registry Number: 106-25-2, 97%), geraniol (CAS Registry Number: 106-24-1, 98%), β-caryophyllene (CAS Registry Number: 87-44-5, >95%), α-humulene (CAS Registry Number: 6753-98-6, 96%), and caryophyllene oxide (CAS Registry Number: 1139-30-6, >98,5%) were obtained from Sigma-Aldrich (Steinheim, Germany). α-Terpineol (CAS Registry Number: 7785-53-7, >98%) was purchased from Merck (Darmstadt, Germany) and 2-methylbutyl isobutyrate (CAS Registry Number: 2445-69-4,>95%) was from aromaLAB (Planegg, Germany). The aforementioned compounds were diluted (10 mg/L) with ethanol resulting in the so-called hop aroma mix (HAM). Sodium chloride (NaCl) was of analytical grade and purchased from Th. Geyer (Berlin, Germany).
Beer samples
In the course of method development and validation different commercial beers were used/analyzed. A German Pilsner (GP) was used to record calibration curves, to calculate LOD and LOQ, and to determine method robustness through terpene-spiking tests. A domestic lager beer (LB) was used to evaluate the remaining parameters of method validation (see below). Both, GP and LB were characterized by low levels of hop-derived esters, were filtered, pasteurized, and therefore well suited for the above stated purposes. In order to apply the final method, several fresh unfiltered hoppy ales were purchased. Some of them were then stored for 30 months at 20 °C in darkness in order to then evaluate changes in their ester spectrum (). An overview on the basic chemical parameters of these beers, determined according to Analytica EBC Methods 9.2.6, 9.6, 9.8, 9.35, and 9.43.2,[Citation22] is given in . Herein, the basic chemical parameters are not discussed in detail but are provided for the convenience of the reader. While the Pale Ale (PA), the two India Pale Ales (IPAs), and the New England IPA (NEIPA) were made using water, different starch sources and hops, the fruit flavored IPA (FIPA) included additions of dried orange and grapefruit peel, natural grapefruit, and blood orange extract.
Table 1. Basic chemical parameters of the beer samples used in development, validation, and application of the HS-SPME-GC-SIM-MS method.
Instrumentation
GC–MS analysis was done on a Shimadzu Nexis GC-2030 interfaced with a GCMS-QP2020 NX (Shimadzu Corp., Kyōto, Japan). The GC was equipped with a Rtx-5MS column (30 m × 0.25 mm i.d. × 0.25 μm film thickness, Restek, Bellefonte, U.S.A.). Helium (99.999%, Air Liquide, Düsseldorf, Germany) was used as mobile phase. HS-SPME sampling was done using a Gerstel-MPS Robotic XL (Gerstel, Mühlheim an der Ruhr, Germany). A cooled tray was installed to keep samples at 5 °C while waiting for HS-SPME sampling. GC–MS data evaluation was done with LabSolutions, GCMSsolutions Version 4.50 SP1 (Shimadzu).
Method development: fiber selection and sodium chloride addition
To define the most suitable parameters for ester extraction from beer, two different fiber material compositions were tested. First, a 100 µm polydimethylsiloxane (PDMS) single-phase fiber was tested. This fiber has been used in several studies focusing on the analysis of beer and hops.[Citation23–26] Second, a 50/30 µm divinylbenzene/carboxen/polydimethylsiloxane (DVB/CAR/PDMS) multi-phase SPME fiber was tested. This fiber type was successfully used in the analysis of hoppy beers by our group.[Citation9,Citation10] Both fibers were sourced from Supelco (St. Louis, U.S.A.) and were preconditioned according to manufacturer’s instructions. Initial measurements to compare fiber performance were performed on the IPA 2 by operating the GC–MS system in scan mode in a mass range from m/z = 40 to 300. After having the final method in place, a confirmative experiment was performed. For this purpose, a spiked sample (GP spiked with 50 µg/L of each ester of interest, herein abbreviated GP + 50) was analyzed using both fibers under conditions described in the “Final method” section. To further optimize HS-SPME extraction different sodium chloride levels were tested. For this purpose, GP + 50 was analyzed as is, with 0.4 g of NaCl, and 0.8 g of NaCl added to 2 mL of liquid using the parameters described in the “Final method description” section.
Method development: GC optimization and ion selection
To choose suitable ions for GC-SIM-MS analysis and to optimize GC conditions hydro-ethanolic solutions of each ester (1000 µg/L) were prepared individually. These hydro-ethanolic solutions were then analyzed by HS-SPME-GC–MS in which the GC–MS was operated using the following generic method. The GC temperature gradient was set as follows: 35 °C (3 min hold time), 5 °C/min rate to 250 °C with 1 min hold time. MS data acquisition was performed in scan mode (m/z 29–300) with a scan event time of 0.30 s. To evaluate suitable qualifier and quantifier ions, resulting peaks were picked manually, mass spectra were extracted, and a noise region of 60 s before the peak was subtracted. The mass spectra (m/z*absolute counts) were exported into Excel (Microsoft Excel 2016, Microsoft Corporation, Redmond, Washington, U.S.A.) and then sorted based on absolute counts. For each ester, the five most abundant ions were then considered in qualifier and quantifier ion selection. Quantifier and qualifier ions were chosen based on their intensity (high intensity preferred) and m/z (high m/z preferred). With the SIM method in place (see “Final method description”), GC separation was optimized targeting baseline separation of the target analytes with minimal runtime. For this optimization GP + 50 (no NaCl addition) was used.
Final method description
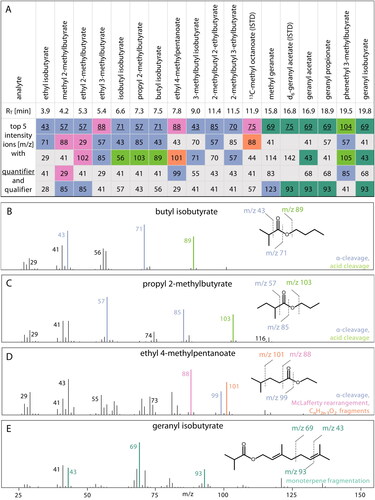
Per sample, two 2 mL aliquots were transferred into 10 mL headspace vials (no NaCl addition). Then 10 µL of an ethanolic ISTD mix solution (2 mg/L) was added prior to sealing vials with a magnetic screw cap (silicone/PTFE septum). By doing so, a concentration of 10 µg/L was achieved for both ISTDs. The sealed vials were then placed onto a cooled GC-autosampler tray (5 °C) until analysis. In order to enrich volatile esters in the headspace above the beer sample, the vial was incubated at 60 °C for 7.5 min. During this time, 10 s of agitation at 500 rpm were each followed by 1 s rest (no agitation). Afterwards HS-SPME using the DVB/CAR/PDMS fiber was executed for 7.5 min at 60 °C with the agitation/no agitation program similar to the above described. Finally, analyte desorption from the fiber into GC was done in the injection port (250 °C, 1 min) that was equipped with an intermediate polarity SPME Liner (Restek, Bad Homburg v. d. Höhe, Germany). The split/splitless injector was set to a split ratio of 1:20. While the GC–MS analysis was then conducted as described below, the fiber was post-conditioned for 4 min at 250 °C in a needle heater station (Gerstel, Mühlheim an der Ruhr, Germany). The GC temperature program was highly staged to, on the one hand, shorten to overall chromatography time (22.4 min) but, on the other hand, achieve separation of the target compounds. The temperature gradient was set as follows: 40–62 °C (7.5 °C/min), 62–72 °C (10 °C/min), 72–90 °C (5 °C/min), 90–100 °C (10 °C/min), 100–105 °C (5 °C/min), 105–150 °C (10 °C/min), 150–160 °C (2 °C/min), 160–170 °C (20 °C/min), 170–300 °C (70 °C/min). Compounds eluting from GC were then transferred into the MS, at which the GC–MS transfer line was set to 310 °C. MS solvent cut was set to 2.9 min. Ionization was performed by electron impact (EI) at 70 eV, ion source temperature was set to 250 °C. The final selection of qualifier and quantifier ions are summarized in .
Figure 2. Overview on the retention times (RT), quantifier (colored and underlined) and qualifier (colored) ions for the 16 esters of interest as well as the two ISTDs including an illustration of the EI-MS fragmentation patterns. Summary of retention times and top five intensity ions for each analyte and ISTD (A); mass spectra, chemical structure, and formation of characteristic fragments of butyl isobutyrate (B), propyl 2-methylbutyrate (C), ethyl 4-methylpentanoate (D), and geranyl isobutyrate (E).
Calibration
To record calibration curves, eight aliquots of GP (1.9 mL each) were transferred into 10 mL headspace vials where 10 µL of ISTD mix solution was added. These aliquots were then spiked with the EESM targeting a final ester addition of 1–200 µg/L. After analysis of these samples, the area ratios of the analytes to ISTD in the blank, which represent the initial ester concentration in the base beer, were subtracted from every calibration point. The fitted area ratios were then plotted against the analyte/ISTD concentration ratios and the curve slope was calculated in a linear model using Microsoft Excel 2016.
Validation and robustness testing
In order to confirm that the method was suitable for its intended use, validation and robustness testing toward matrix effects were performed. In terms of validation, the linearity (R2) across the calibration range was evaluated by using the Mandel fitting test.[Citation27] The LOD and LOQ for each analyte were calculated according to the ASBC method.[Citation28] Additionally, the validation included the determination of recovery (%), measurement precision reported as relative standard deviation (%RSD), and ruggedness (%RSD). In detail, the LOD and LOQ for each ester were determined and calculated from repeated analysis of an unspiked beer (10-fold analysis GP). To determine the recovery (%), LB was analyzed unspiked and after spiking with the EESM. The spike level was 50 µg/L for each ester, and the resulting spiked beer is herein referred to as LB + 50. To determine the recovery, LB and LB + 50 were analyzed in triplicates. The recovery was then calculated from the concentration of each ester in LB in relation to the concentration of the corresponding ester in LB + 50. The measurement precision was tested by sixfold repeat analysis of LB + 50. Method ruggedness was determined at the beginning, middle, and end of a batch, on two different days, and for two analysts. To determine ruggedness at the beginning, middle, and end of a batch a set of six samples (LB + 50) was prepared simultaneously by a single analyst. These six samples were split into three doublets, which were then run at the very beginning, in the middle, and at the very end of a batch consisting of 18 samples in total. That means total batch runtime for ruggedness at the beginning, middle, and end of a batch was approximately 9 h. To determine ruggedness on different days, LB + 50 was analyzed in triplicate on two different days by the same analyst. The ruggedness for two analysts was done by preparation of LB + 50 (independently) by two analysts, who then also performed all subsequent steps of the analysis in triplicate. Ruggedness as shown in was calculated from the results submitted by the two analysts. In order to evaluate method robustness towards matrix effects, spiking trials with a mix of terpenes and terpenoids were performed. For this purpose, GP + 50 served as the base beer to which 16 hop aroma compounds (α-pinene, β-pinene, myrcene, limonene, cis-linalool oxide, trans-linalool oxide, linalool, citronellol, nerol, geraniol, geranyl acetate, β-caryophyllene, α-humulene, caryophyllene oxide, α-terpineol, and 2-methylbutyl isobutyrate), below referred to as hop aroma mix (HAM), were spiked in levels of 100, 200, 500, and 1000 µg/L each.
Table 2. Results of method validation: LOD, LOQ, recovery, measurement precision and ruggedness determined at the beginning, middle, and end of a batch, on two different days, and for two analysts.
Results and discussion
Fiber selection and NaCl addition
HS-SPME is one of the most frequently applied sampling techniques in beer flavor analysis. To some extent, this surely relates to the availability of different fiber materials that allow selective extraction of compounds across a wide polarity range. In addition to the choice of a suitable fiber, sample and headspace volume, incubation and extraction time, as well as salt addition are parameters commonly tested during HS-SPME method development.[Citation7,Citation9,Citation29] With respect to previously described optimizations for the extraction of hop aroma compounds from beer[Citation9] and the literature referring to HS-SPME-GC–MS analysis of esters from beer,[Citation5] the optimization done herein was only focused on fiber selection and NaCl addition, while other parameters were used as previously optimized.[Citation9] Based on the above cited literature[Citation5,Citation9] and the chemical structures and properties of the esters targeted herein, it appeared reasonable to compare a non-polar PDMS SPME fiber with a multi-phase coated SPME fiber made from DVB/CAR/PDMS. As fiber selection is commonly one of the initial steps in method development and is frequently done prior to GC and MS optimization, a pragmatic approach was used herein. By analyses of IPA 2 in scan mode with a generic method, it was observed that the DVB/CAR/PDMS fiber extracted the compounds of interest more efficiently (higher peak areas, data not shown) and was therefore selected in method development. In order to provide more in-depth quantitative information on fiber performance for the individual esters on both fibers, these were compared after the HS-SPME-GC–MS method was fully developed. The results of this comparison, in which GP + 50 was analyzed, are shown in and . While illustrates an overlay of two GC-SIM-MS chromatograms, includes the average peak areas for each of the 18 esters (16 analytes and the two internal standards) obtained from a triplicate analysis using both different fiber coatings. When using the DVB/CAR/PDMS fiber most esters (16 out of 18) were more effectively extracted compared to the usage of the PDMS fiber. Examples to underline the superior performance are ethyl 2-methylbutyrate and ethyl 3-methylbutyrate for which the peak areas when using the DVB/CAR/PDMS fiber were more than 30% greater when compared to the use of the PDMS fiber. Exceptions from this were geranyl propionate and geranyl isobutyrate that were more efficiently extracted when using the PDMS fiber. What can also be seen from is that the GC-SIM-MS peak area of the individual esters differed strongly. While for example ethyl 2-methylbutyrate on DVB/CAR/PDMS was found to have a peak area of 5007, the same concentration of geranyl acetate resulted in a peak area of 56,876. These differences, which are for example attributed to ions selected for GC-SIM-MS, should also be considered when evaluating HS-SPME conditions/fiber choice. Compounds that are well recovered on either phase might be of lesser concern compared to those with low peak areas and with strong fiber related extraction performance. In summary, the results show that the DVB/CAR/PDMS fiber is more suitable than the PDMS fiber when aiming for a wide range of esters in beer and especially when aiming at polar, low molecular weight esters such as ethyl butyrate, methyl 2-methylbutyrate, ethyl 2-methylbutyrate, and ethyl 3-methylbutyrate. When aiming to analyze the geranyl-esters alone, the PDMS fiber has a similar or even slightly better performance under the extraction parameters investigated herein.
The effect of NaCl addition on HS-SPME extraction efficiency depends on the structure and polarity of the target compounds.[Citation9] It was therefore not surprising to observe that the extraction of some esters was improved when NaCl was added, while for some esters no/little effect or even a decrease in extraction performance was observed. The results are illustrated in , in which the bar charts indicate the effect of salt addition at two levels (0.4 g of NaCl or 0.8 g of NaCl per sample vial) relative to GP + 50 to which no salt was added. As can be seen from , the addition of 0.4 g of NaCl per sample vial, which corresponds to 0.2 g of NaCl per mL sample, resulted in an increased relative peak area ratio (area analyte/area ISTD) for ethyl isobutyrate (+22%), methyl 2-methylbutyrate (+26%), ethyl 2-methylbutyrate (+19%), ethyl 3-methylbutyrate (+20%) ethyl 4-methylpentanoate (+11%), and phenethyl 3-methylbutyrate (+30%). No effect was observed for propyl 2-methylbutyrate, butyl isobutyrate, and geranyl acetate. For isobutyl isobutyrate (−6%), isoamyl isobutyrate (−10%), 2-methylbutyl2-methylbutyrate (−20%), 2-methylbutyl 3-methylbutyrate (−24%), methyl geranate (−30%), geranyl propionate (−19%), and geranyl isobutyrate (−40%) the addition of 0.4 g of NaCl resulted in a decrease in the relative peak area ratios. In brief, the addition of 0.8 g of NaCl per sample vial resulted in comparable findings. Compounds that were more efficiently extracted when adding 0.4 g of NaCl instead of not adding any salt were also more efficiently extracted when the salt addition was increased to 0.8 g of NaCl. For these compounds, the peak areas increased about 15% on average when the salt addition was doubled from 0.4 g of NaCl to 0.8 g of NaCl. For esters that were extracted less effectively when 0.4 g of NaCl was added, the extraction was further reduced when salt addition was increased to 0.8 g of NaCl. However, this decrease in peak area ratios was not proportional to the salt addition, meaning that a higher amount of salt added (0.8 g of NaCl) did not necessarily result in a detectable peak area reduction when compared to the 0.4 g of NaCl addition. For some compounds (e.g., propyl 2-methylbutyrate and butyl isobutyrate) that were not affected by a salt addition at the level of 0.4 g NaCl, an increase in salt addition to 0.8 g of NaCl slightly improved the extraction. Based on these comparably low positive effects by using 0.4 g resp. 0.8 g of NaCl for some compounds and the shift to a negative effect for other substances, the decision was made to not use NaCl (refer to final method description). However, for brewers only aiming to quantify a selection of esters, for example ethyl isobutyrate, methyl 2-methylbutyrate, ethyl 2-methylbutyrate, and ethyl 3-methylbutyrate, salt addition might be useful.
GC optimization and ion selection
It has been outlined earlier that the analysis of hop aroma compounds might theoretically be accomplished by a range of stationary phases and that the use of either polar (e.g., polyethylene glycol) or non-polar materials (e.g., (5%-phenyl)-methylpolysiloxane) is most common.[Citation2] Herein, a low-polarity Rtx-5MS column was used and no attempts to test different columns were made. Instead, the temperature gradient was optimized and ion selection for SIM-MS considered that some esters elute close. As can be seen in the final method description, a highly staged GC-program was designed, and this finally enabled the separation of all analytes in a short method runtime (22.4 min). Still, as shown in with some esters, for example ethyl 2-methylbutyrate and Ethyl 3-methylbutyrate, one can expect that column aging might favor co-elution of these compounds. To ensure method performance is not affected by those kinds of unavoidable changes in the instrumental setup, it was attempted to select qualifier and quantifier ions that enable differentiation of neighboring peaks by mass spectrometry. Hence, ion selection aimed not only to identify characteristic ions exhibiting high intensities, but also to ensure that compounds that elute close can be distinguished in SIM-MS. In the case of ethyl 2-methylbutyrate and ethyl 3-methylbutyrate, for example, ions with m/z = 57 and 102 or ions with m/z = 88 and 85 were chosen. lists the retention times as well as the five most prominent ions for each ester. The ions appear in order of descending intensity and the qualifier and quantifier ions appear in bold letters. To illustrate similarities and differences in the mass spectrometric properties of the esters, the ions are color coded. Underlying tentative fragmentation reactions are visualized in . As can be seen from , five ester and/or terpene characteristic fragmentation reactions account for the most prominent ions observed in EI–MS and esters can be grouped by their acidic entity. For the isobutyrate and 2-/3-methylbutyrate esters, the prominent ions relate to a fragmentation by α-cleavage (blue) and acid cleavage (green). The spectra of butyl isobutyrate () and propyl2-methylbutyrate () present characteristic fragment ions at m/z 43 and 71 (isobutyrates) and m/z 57 and 85 (2-/3-methylbutyrates) resulting from α-cleavage, as well as m/z 89 and 103 for acid cleavage. Ethyl 4-methylpentanoate is a suitable example for and ester whose mass spectrum is characterized by ions derived from McLafferty rearrangement (pink) and CnH2n−1O2 fragments (orange) that exhibit ions with m/z 88 and 101, respectively (). Compounds with terpenoic ester or alcohol groups present terpene characteristic fragments (m/z 43, 69, and 93), which are illustrated using the structure of geranyl isobutyrate as an example (monoterpene fragmentation, turquoise in ).
Method validation
Validation was performed to confirm that the method is suitable for its intended use. Across the calibration range (1–200 µg/L) linearity (R2) determined by the Mandel fitting test[Citation26] was greater than 0.99 for all analytes tested. The other validation parameters are summarized in . As can be seen in the calculated LODs ranged from 0.01 to 0.24 µg/L and the calculated LOQs ranged from 0.02 to 0.81 µg/L. Hence, the calculated LOQs were well below 1 µg/L equaling the lowest concentration of the working range, which is practically used as the LOQ when results are reported later under the Application section. The rates of recovery were in the range of 92–101%, with the exception of geranyl isobutyrate (88%). The measurement precision was in the range of 7.0–11.3%, which is in line with the measurement precision previously published for terpenes, terpenoids, and thiols in beer.[Citation7,Citation9] In ruggedness testing, a %RSD < 15 for all esters was found. It is interesting to note that in many cases ruggedness as determined at the beginning, middle, and end of a batch resulted in slightly higher %RSDs compared to the ruggedness determined on two different days or by two analysts (). These results highlight that even though HS-SPME allows complete automation and theoretically would enable analysts to run multi-day batches, this is not the preferred way of operation. Without discussing this aspect in detail, it has been shown earlier that qualitative and quantitative changes, for example acid catalyzed isomerization of terpene alcohols[Citation30] or the oxidation of thiols[Citation7] occur during sample stand times on the auto sampler prior to HS-SPME. In the analysis of esters, most importantly from unpasteurized/unfiltered process beer samples, biochemical conversions of the target analytes might occur. Even though this has not been tested herein, it is likely that warmer temperatures (no cooled auto sampler tray) and longer sample stand times favor changes driven by active yeast cells, yeast or hop enzymes. When brewers aim to run large batches of in-process samples, they should acknowledge the instability of certain esters,[Citation10] might pretreat the samples by centrifugation/heat, tightly monitor internal standard areas, or include suitable control samples throughout a batch.
Robustness testing
One of the key aspects in the practical application of an analytical method is it robustness toward matrix effects. In the targeted analysis of beer volatiles by HS-SPME-GC-MS matrix effects are frequently caused by the presence of volatiles one is not aiming to quantify.[Citation31] In the case of the current method for ester analysis, terpenes and terpenoids are of prior concern, as they are well extracted by HS-SPME, might partly co-elute with esters during GC, and their fragmentation in EI-MS might result in fragment ions similar to some of those used for ester qualification and quantification. As outlined above, robustness testing was based on analysis of beer samples that were created by adding the HAM including 15 terpenes and terpenoids (as well as geranyl acetate and 2-MBIB) in concentrations of up to 1000 µg/L each to GP + 50. Analysis of those beers was then performed as described in the final method section and both internal standards were used for quantification of each of the esters. The results of this experiment are summarized in . The analytes are listed vertically and are sorted according to their retention time, while the addition of HAM appears horizontal in five levels (0, 100, 200, 500, and 1000 µg/L). The results appear as a combination of numbers (%) and bar charts that indicate a relative deviation calculated from full recovery (100%) of the corresponding substance. In the case where no bar is visible, the addition of HAM did not affect quantification. In the case where a bar appears on the left side of the dotted line, the addition of HAM affected the quantification of esters in a way that the actual analyte recovery was lower than expected. In the case where a bar appears on the right-hand side of one of the dotted lines, the addition of HAM affected the quantification of esters in way that concentrations higher than expected were determined. In order to illustrate the relevance of the internal standard choice, is split into part A, B, and C. In , ester concentrations were calculated using 13C-methyl octanoate (green), while in , d6-geranyl acetate (purple) was used. In , the use of the most suitable internal standard (lowest offset between calculated and overserved value) is presented. Please note that color-coding in corresponds to that in and . As can be seen in , the use of 13C-methyl octanoate resulted in an underestimation of the ester levels at HAM spike levels of 0, 100, and 200 μg/L. Esters with higher molecular weight, such as for example geranyl acetate (−80%, 100 μg/L HAM) and geranyl isobutyrate (−21%, 100 μg/L HAM), were affected to a larger extent than for example ethyl isobutyrate (−6%, 100 μg/L HAM) or propyl 2-methylbutyrate (−8%, 100 μg/L HAM). As can be seen in , the use of d6-geranyl acetate led to an overestimation of esters at all HAM spike levels. Here, esters with low molecular weight were most affected, while an increasing HAM level reduced this effect. In contrast, the geranyl-esters were well recovered at all HAM spike levels and even the 1000 μg/L HAM addition resulted in acceptable recoveries. For example, the recovery in the 100 μg/L HAM for ethyl isobutyrate was +20% and the recovery of ethyl 2-methylbutyrate was +18%, while the recovery for all geranyl-esters was in the range of 2–4% in the 100 µg/L HAM spiked point. As can be seen in the usage of two ISTD led to a reduction of the effects and might therefore be preferred over methods relying on one ISTD.
Table 3. Results of robustness testing visualized by a combination of numbers and bar charts showing the relative deviation from full recovery (100%) for each analyte at different spike levels of the hop aroma mix (HAM). Positive numbers indicate a recovery greater than 100%, while negative numbers indicate a recovery below 100%. Recoveries in part A (green) were obtained using 13C-methyl octanoate, recoveries in part B (purple) were obtained using d6-geranyl acetate, while part C presents the recoveries using the most suitable ISTD for each individual analyte.
Application
In order to underline the ability of the method to differentiate beer with different ester profiles, a selection of beers was analyzed. summarizes the ester concentrations across eight beer samples, concentrations below 1 µg/L are not reported, even though the calculated LOQs would have allowed to do so. Practically, it appears meaningful to report concentrations that fall into the actual calibration range. What can be seen from is that except for geranyl propionate, all esters were at least detected in one product. Amongst the beers tested, the PA (refer to for basic chemistry parameters) had the lowest overall concentrations in hop-derived esters and only seven out of 16 analytes were detected in levels >1 µg/L in the fresh product. As indicated by the IBU (), PA contained less hops compared to IPA1, IPA2, NEIPA, and FIPA. In the aged PA (PA*), only four out of 16 analytes were found. In PA*, ethyl isobutyrate, ethyl 2-methylbutyrate, ethyl 3-methylbutyrate, and geranyl acetate were found in higher levels, while isobutyl isobutyrate, isoamyl isobutyrate, methyl geranate, and phenethyl 3-methylbutyrate were more abundant in the fresh beer. Both, fresh IPA1 and IPA2, contained higher ester levels compared to PA. In both beers, an increase of ethyl isobutyrate, ethyl 2-methylbutyrate, ehyl 3-methylbutyrate, and ethyl 4-methylpentanoate was observed upon aging, while the concentrations of isobutyl isobutyrate, propyl 2-methylbutyrate, isoamyl isobutyrate, 2-methylbutyl 2-methylbutyrate, 2-methylbutyl 3-methylbutyrate, and methyl geranate decreased. These observations are basically in line with previous reports,[Citation14,Citation32,Citation33] however to the best of our knowledge, ethyl isobutyrate has not previously been identified as an indicator for beer aging. In addition to the three aforementioned beers that were analyzed fresh and aged, a NEIPA and a FIPA were tested ( and ). The NEIPA was selected, as bulky hop additions are typical for that style. As can be seen in , the NEIPA is comparable with the fresh IPA2, the level of methyl geranate (113.7 µg/L) is worth noting as it is the primary hop-derived ester in this product. The FIPA was brewed with dried orange peel, dried grapefruit peel, grapefruit extract, blood orange extract, and extracts. The ester profile of this beer was not comparable to any other of the investigated beers. Overall, the level of esters was low, the concentration of geranyl acetate (5.3 µg/L) is notable as likely relates to the botanicals/fruits added.[Citation34–36]
Table 4. Concentration of hop-derived esters in different selected commercially available hoppy ales (µg/L).
Summary and conclusion
Esters contribute to the hop varietal flavor in beer. Upon fermentation and storage, (bio)chemical reactions alter the ester profile, but given the lack of suitable analytical methodologies the influence of these changes on hoppy-beer flavor is not yet well understood. The method introduced and validated herein aimed to close this gap by providing a comparably quick, automated, and straightforward HS-SPME-GC-SIM-MS for quantification of 16 hop-derived esters in beer. Method validation evidenced that the method is robust and precise, spiking experiments in which high terpenes levels were added evidenced that the GC-SIM-MS program and the usage of two isotopically labeled internal standards assured a robust quantification. Beer samples made with different hop additions and of varying freshness could be well distinguished by HS-SPME-GC-SIM-MS. Given the fact that beer consistency and stability are concerns of the brewing industry, many brewers aim to monitor product quality tightly. Since GC–MS is becoming available to more and more brewers, this method might not only be used to investigate beer stability on a scientific level but might be a valuable addition to brewery QA/QC.
Declaration of interest statement
The authors do note declare a conflict of interest.
Supplemental Material
Download MS Word (20.3 KB)Supplemental Material
Download JPEG Image (264 KB)
Supplemental Material
Download JPEG Image (563.5 KB)
Additional information
Funding
Related Research Data
Literature Cited
- Lafontaine, S. R.; Shellhammer, T. H. How Hoppy Beer Production Has Redefined Hop Quality and a Discussion of Agricultural and Processing Strategies to Promote It. Tech. Q. Master Brew. Assoc. Am. 2019, 56, 1–12.
- Rettberg, N.; Biendl, M.; Garbe, L. A. Hop Aroma and Hoppy Beer Flavor: Chemical Backgrounds and Analytical Tools—A Review. J. Am. Soc. Brew. Chem. 2018, 76, 1–20. DOI: 10.1080/03610470.2017.1402574.
- Roland, A.; Delpech, S.; Dagan, L. A Powerful Analytical Indicator to Drive Varietal Thiols Release in Beers: The “Thiol Potency”. Brew. Sci. 2017, 70, 170–175.
- Lafontaine, S.; Varnum, S.; Roland, A.; Delpech, S.; Dagan, L.; Vollmer, D.; Kishimoto, T.; Shellhammer, T. Impact of Harvest Maturity on the Aroma Characteristics and Chemistry of Cascade Hops Used for Dry-Hopping. Food Chem. 2019, 278, 228–239. DOI: 10.1016/j.foodchem.2018.10.148.
- Takoi, K.; Tokita, K.; Sanekata, A.; Usami, Y.; Itoga, Y.; Koie, K.; Nakayama, Y. Varietal Difference of Hop-Derived Flavour Compounds in Late-Hopped/Dry-Hopped Beers. Monatsschrift Brauwissenschaft 2016, 69, 1–7.
- Reglitz, K.; Steinhaus, M. Quantitation of 4-Methyl-4-sulfanylpentan-2-One (4MSP) in Hops by a Stable Isotope Dilution Assay in Combination with GC × GC-TOFMS: Method Development and Application to Study the Influence of Variety, Provenance, Harvest Year, and Processing on 4MSP Concentrations. J. Agric. Food Chem. 2017, 65, 2364–2372. DOI: 10.1021/acs.jafc.7b00455.
- Dennenlöhr, J.; Thörner, S.; Rettberg, N. Analysis of Hop-Derived Thiols in Beer Using on-Fiber Derivatization in Combination with HS-SPME and GC–MS/MS. J. Agric. Food Chem. 2020, 68, 15036–15047. DOI: 10.1021/acs.jafc.0c06305.
- Biendl, M.; Engelhard, B.; Forster, A.; Gahr, A.; Lutz, A.; Mitter, W.; Schmidt, R.; Schönberger, C. Hops: Their Cultivation, Composition and Usage ; Fachverlag Hans Carl GmbH: Nuremberg, Germany, 2015.
- Dennenlöhr, J.; Thörner, S.; Manowski, A.; Rettberg, N. Analysis of Selected Hop Aroma Compounds in Commercial Lager and Craft Beers Using HS-SPME-GC-MS/MS. J. Am. Soc. Brew. Chem. 2020, 78, 16–31. DOI: 10.1080/03610470.2019.1668223.
- Rettberg, N.; Schubert, C.; Dennenlöhr, J.; Thörner, S.; Knoke, L.; Maxminer, J. Instability of Hop-Derived 2-Methylbutyl Isobutyrate During Aging of Commercial Pasteurized and Unpasteurized Ales. J. Am. Soc. Brew. Chem. 2020, 78, 175–184. DOI: 10.1080/03610470.2020.1738742.
- IUPAC. Compendium of Chemical Terminology, 2nd ed. (the "Gold Book"). Compiled by A. D. McNaught and A. Wilkinson. Blackwell Scientific Publications: Oxford, 1997. Online version (2019) created by S. J. Chalk. ISBN 0-9678550-9-8. DOI: 10.1351/goldbook.
- Kishimoto, T.; Wanikawa, A.; Kono, K.; Shibata, K. Comparison of the Odor-Active Compounds in Unhopped Beer and Beers Hopped with Different Hop Varieties. J. Agric. Food Chem. 2006, 54, 8855–8861. DOI: 10.1021/jf061342c.
- Rettberg, N.; Thörner, S.; Labus, A. B.; Garbe, L. A. Aroma Active Monocarboxylic Acids–Origin and Analytical Characterization in Fresh and Aged Hops. Brew. Sci. 2014, 67, 33–47.
- Nielsen, T. P. Character Impact of Hop Aroma Compounds in Ale. In Hop Flavor and Aroma-Proceedings of the 1st International Brewers Symposium, Shellhammer, T. H., Ed.; Master Brewers Association of the Americas: St. Paul, Minnesota, USA, 2009; pp. 59–77.
- Vanderhaegen, B.; Delvaux, F.; Daenen, L.; Verachtert, H.; Delvaux, F. R. Aging Characteristics of Different Beer Types. Food Chem. 2007, 103, 404–412. DOI: 10.1016/j.foodchem.2006.07.062.
- Williams, R. S.; Wagner, H. The Isolation and Identification of New Staling Related Compounds from Beer. J. Am. Soc. Brew. Chem. 1978, 36, 27–31. DOI: 10.1094/ASBCJ-36-0027.
- Takoi, K.; Itoga, Y.; Koie, K.; Takayanagi, J.; Kaneko, T.; Watanabe, T.; Matsumoto, I.; Nomura, M. Behaviour of Hop-Derived Branched-Chain Esters During Fermentation and Unique Characteristics of Huell Melon and Ekuanot (HBC366) Hops. Brew. Sci. 2018, 71, 100–109.
- Forster, A.; Gahr, A.; Van Opstaele, F. On the Transfer Rate of Geraniol with Dry Hopping. Brew. Sci. 2014, 67, 60–62.
- Kemp, O.; Hofmann, S.; Braumann, I.; Jensen, S.; Fenton, A.; Oladokun, O. Changes in Key Hop-Derived Compounds and Their Impact on Perceived Dry-Hop Flavour in Beers after Storage at Cold and Ambient Temperature. J. Inst. Brew. 2021. DOI: 10.1002/jib.667.
- Schmidt, C.; Biendl, M. Headspace Trap GC–MS Analysis of Hop Aroma Compounds in Beer. Brew. Sci. 2016, 69, 9–15.
- Dresel, M.; Opstaele, F.; Praet, T.; Jaskula-Goiris, B.; Van Holle, A.; Naudts, D.; De Keukeleire, D.; Cooman, L.; Aerts, G. Investigation of the Impact of the Hop Variety and the Hopping Technology on the Analytical Profile of Single-Hopped Worts and Beers. Brew. Sci. 2013, 66, 162–175.
- Analytica EBC. 9.2.6 – Alcohol in Beer by Near Infrared Spectroscopy; Analytica EBC. 9.6 – Colour of Beer: Spectrophotometric Method (IM); 9.8 – Bitterness of Beer (IM); 9.35 - pH of Beer; Analytica EBC. 9.43.2 – Specific Gravity of Beer using a Density Meter. https://brewup.eu/ebcanalytica.
- Van Opstaele, F.; De Causmaecker, B.; Aerts, G.; De Cooman, L. Characterization of Novel Varietal Floral Hop Aromas by Headspace Solid Phase Microextraction and Gas Chromatography–Mass Spectrometry/Olfactometry. J. Agric. Food Chem. 2012, 60, 12270–12281. DOI: 10.1021/jf304421d.
- Van Opstaele, F.; Aerts, G.; De Cooman, L. Determination of Hop Aromatisation of Beer by Headspace Solid Phase Microextraction in Combination with Gas Chromatography and Mass Spectrometry. Brew. Sci. 2014, 67, 149–160.
- Takoi, K.; Degueil, M.; Shinkaruk, S.; Thibon, C.; Maeda, K.; Ito, K.; Bennetau, B.; Dubourdieu, D.; Tominaga, T. Specific Flavor Compounds Derived from Nelson Sauvin Hop and Synergy of These Compounds. Brew. Sci. 2009, 62, 108–118.
- Takoi, K.; Koie, K.; Itoga, Y.; Katayama, Y.; Shimase, M.; Nakayama, Y.; Watari, J. Biotransformation of Hop-Derived Monoterpene Alcohols by Lager Yeast and Their Contribution to the Flavor of Hopped Beer. J. Agric. Food Chem. 2010, 58, 5050–5058. DOI: 10.1021/jf1000524.
- Funk, W.; Dammann, V.; Donnevert, G. 2005. Qualitätssicherung in der Analytischen Chemie, 2nd ed.; Wiley-VCH Verlag GmbH & Co.KGaA: Weinheim.
- ASBC Technical Committee. Limits of Detection and Determination. In ASBC Methods of Analysis, 14th ed.; Sedin, D., chair.; The Society: St. Paul, MN, 2011. DOI: 10.1094/ASBCMOAStatistical-2.
- Dennenlöhr, J.; Thörner, S.; Maxminer, J.; Rettberg, N. Analysis of Selected Staling Aldehydes in Wort and Beer by GC-EI-MS/MS Using HS-SPME with on-Fiber Derivatization. J. Am. Soc. Brew. Chem. 2020, 78, 284–298. DOI: 10.1080/03610470.2020.1795478.
- Pedersen, D. S.; Capone, D. L.; Skouroumounis, G. K.; Pollnitz, A. P.; Sefton, M. A. Quantitative Analysis of Geraniol, Nerol, Linalool, and Alpha-Terpineol in Wine. Anal. Bioanal. Chem. 2003, 375, 517–522. DOI: 10.1007/s00216-002-1716-x.
- Rettberg, N. Instrumental Analysis of Hop Aroma in Beer: The Challenges of Transforming a Research Application into a QC Tool. In Hop Flavor and Aroma: Proceedings of the 2nd International Brewers Symposium, Shellhammer, T. H., Lafontaine, S. R., Eds.; American Association of Brewing Chemists and Master Brewers Association of the Americas: St. Paul, MN, 2020; pp 11–24.
- Vanderhaegen, B.; Neven, H.; Verachtert, H.; Derdelinckx, G. The Chemistry of Beer Aging – A Critical Review. Food Chem. 2006, 95, 357–381. DOI: 10.1016/j.foodchem.2005.01.006.
- Schnaitter, M.; Wimmer, A.; Kollmannsberger, H.; Gastl, M.; Becker, T. Influence of Hop Harvest Date of the ‘Mandarina Bavaria’ Hop Variety on the Sensory Evaluation of Dry-Hopped Top-Fermented Beer. J. Inst. Brew. 2016, 122, 661–669. DOI: 10.1002/jib.382.
- Dharmawan, J.; Kasapis, S.; Sriramula, P.; Lear, M. J.; Curran, P. Evaluation of Aroma-Active Compounds in Pontianak Orange Peel Oil (Citrus nobilis Lour. Var. microcarpa Hassk.) by Gas Chromatography-Olfactometry, Aroma Reconstitution, and Omission Test. J. Agric. Food Chem. 2009, 57, 239–244. DOI: 10.1021/jf801070r.
- Boelens, M. H.; Jimenez, R. The Chemical Composition of the Peel Oils from Unripe and Ripe Fruits of Bitter Orange, Citrus aurantium L. ssp. amara Engl. Flavour Fragr. J. 1989, 4, 139–143. DOI: 10.1002/ffj.2730040313.
- Bernhard, R. A. Citrus Flavor. Volatile Constituents of the Essential Oil of the Orange (Citrus sinesis). J. Food Sci. 1961, 26, 401–411. DOI: 10.1111/j.1365-2621.1961.tb00380.x.