
 ?Mathematical formulae have been encoded as MathML and are displayed in this HTML version using MathJax in order to improve their display. Uncheck the box to turn MathJax off. This feature requires Javascript. Click on a formula to zoom.
Abstract
The volatile organic compounds (VOCs) produced during cider fermentation, maturation, and dry hopping greatly impact enjoyment of the final product. To investigate the effect of apple variety on VOC development in cider, five apple varieties were picked from two orchards in southwest Colorado. Each apple variety was juiced, fermented with Lalvin QA23 Saccharomyces cerevisiae, dry-hopped with Citra hops, and analyzed separately alongside non-dry hopped controls. The aroma attributes of these historical southwest Colorado apples have never been explored, and few studies have chemically profiled the aromas of dry-hopped cider. A total of 73 VOCs were identified using headspace-solid phase microextraction-gas chromatography-mass spectrometry (HS-SPME-GC-MS) from fruit juice to cider. Ethyl esters, acetate esters, higher alcohols, and terpenes were the major aroma contributors observed in dry-hopped cider. The identity and concentrations of VOCs varied greatly between apple varieties, with only 24 common VOCs detected in all samples studied. This indicates the importance of apple variety choice in tuning the aroma profile of the finished cider. This method can be used to more effectively evaluate orchard or cider production treatments on cider quality. This case study also provides practical information for cider makers seeking to improve the quality of their products through consideration of fruit variety and dry hopping.
Supplemental data for this article is available online at https://doi.org/10.1080/03610470.2021.2013645 .
Introduction
Over the last twenty years, hard cider has undergone a global revival as a refreshing, gluten-free alternative to beer. The global hard cider market currently has the highest growth rate of all alcoholic beverages, including craft beer.[Citation1–3] With this resurgence comes an incentive to restore and preserve historic orchards. Most of the apple trees planted in the United States in the 18th and 19th centuries were planted by seed, rather than grafted from European apple trees.[Citation4] Apples are heterozygous, meaning each apple seed will grow a unique apple tree allowing for a vast diversity in apple varieties.[Citation4] Many of these apple varieties, in particular crab apples, are too bitter and astringent for raw consumption, but are perfect for cider making.[Citation4,Citation5] The Montezuma Orchard Restoration Project (MORP) in southwest Colorado seeks to preserve the region’s fruit-growing history and the heritage cider trees growing there.[Citation6] The Old Fort Orchard in Hesperus, CO and a small, privately-owned orchard in Hermosa, CO include apple trees that were historically used for cider-making and are only now being rediscovered for the unique aromas that they generate in cider. This study presents a novel investigation of the volatile profiles of both cider and dry-hopped cider made from single apple varieties grown in these southwest Colorado orchards, and all data reported herein has been added to MORP’s collaborative cider database to inform producers of both non-dry hopped and dry hopped cider with these apples. The results reported herein represent a case study. Although these data are not generalizable due to the limited scope of five apple varieties, they represent a novel chemical analysis that elucidates the influence of both apple variety and dry hopping on cider aroma.
Hard cider is typically made from a mixture of apple juice varieties to obtain a desired cider aroma and taste. If too tart, a sweeter apple juice can be supplemented. The initial apple juice variety chosen by a cider maker becomes the chemical environment of the fermentation and maturation processes, and therefore greatly influences the production of all subsequent sensory species.[Citation7–9] Dry hopping, the process of adding whole cone or dry hop pellets to a beverage after fermentation is complete, has recently become popular in cider production.[Citation10,Citation11] However, the volatile profiles resulting from dry hopping apple ciders have not been well studied. Additionally, the chemical process of hops extraction in the unique chemical environments generated from different apple varieties has not been previously explored. Differentiating the aromatic profiles of southwest Colorado apple varieties in juice, cider, and dry-hopped cider provides invaluable information to help cider makers achieve their desired finished product. This method can be applied to test the influence of various orchard or cider treatments on cider quality, which is of great interest to apple and cider producers.
Headspace-solid phase microextraction-gas chromatography-mass spectrometry (HS-SPME-GC-MS) is a dependable technique for the determination of the volatile organic compounds (VOCs) of cider.[Citation12,Citation13] The aroma of cider has previously been reported to be composed of ethyl esters, acetate esters, and higher alcohols (). A divinylbenzene/carboxen/polydimethylsiloxane (DVB/CAR/PDMS) fiber is an effective choice to preconcentration these analytes prior to GC-MS analysis.[Citation12,Citation13]
Figure 1. VOCs of interest in this study include ethyl esters (A), acetate esters (B), and higher alcohols (C). Specific hydrocarbon (R) groups are color coded. Ethyl esters (A) observed in apple juices or ciders were ethyl butanoate [R=(CH2)2CH3], ethyl hexanoate [R=(CH2)4CH3], ethyl octanoate [R=(CH2)6CH3], and ethyl decanoate [R=(CH2)8CH3]. Acetate esters (B) were 3-methyl-1-butyl acetate [R=(CH2)2CH(CH3)2], 2-methyl-1-butyl acetate [R = CH2CHCH3CH2CH3], and hexyl acetate [R=(CH2)5CH3]. Lastly, higher alcohols (C) contributing to the aroma profiles were 1-butanol [R = CH2CH3], 1-pentanol [R=(CH2)2CH3], 1-hexanol [R=(CH2)3CH3], 1-octanol [R=(CH2)5CH3], 2-phenylethyl alcohol [R = C6H5], 2-hexen-1-ol, and 5-dodecanol.
![Figure 1. VOCs of interest in this study include ethyl esters (A), acetate esters (B), and higher alcohols (C). Specific hydrocarbon (R) groups are color coded. Ethyl esters (A) observed in apple juices or ciders were ethyl butanoate [R=(CH2)2CH3], ethyl hexanoate [R=(CH2)4CH3], ethyl octanoate [R=(CH2)6CH3], and ethyl decanoate [R=(CH2)8CH3]. Acetate esters (B) were 3-methyl-1-butyl acetate [R=(CH2)2CH(CH3)2], 2-methyl-1-butyl acetate [R = CH2CHCH3CH2CH3], and hexyl acetate [R=(CH2)5CH3]. Lastly, higher alcohols (C) contributing to the aroma profiles were 1-butanol [R = CH2CH3], 1-pentanol [R=(CH2)2CH3], 1-hexanol [R=(CH2)3CH3], 1-octanol [R=(CH2)5CH3], 2-phenylethyl alcohol [R = C6H5], 2-hexen-1-ol, and 5-dodecanol.](/cms/asset/28f141bf-cd8b-410f-9c91-68e4982d06f8/ujbc_a_2013645_f0001_c.jpg)
Herein, we analyze juice and cider produced from five southwest Colorado apple varieties. The two major classifications of VOCs identified and semi-quantified in this study are shown in : esters (ethyl esters and acetate esters), and higher alcohols. A third class of aroma compounds, terpenes, were only observed after dry hopping the cider. The VOCs of the juice, cider, and dry-hopped cider were identified and semi-quantified using HS-SPME-GC-MS to delineate the unique aromas produced from each apple variety.
Experimental
Sample preparation, fermentation, and dry hopping
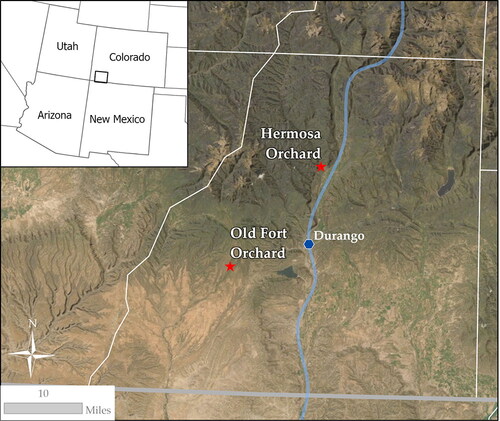
Ripe apples were hand-picked from two orchards in southwest Colorado (U.S.A.) in August and September 2020: The Old Fort Orchard in Hesperus, CO and a small, privately-owned orchard in Hermosa, CO (). Apple ripeness was determined based on flesh softness and skin color (ground color) observations made in collaboration with orchard owners and local cider makers (EsoTerra Cider, Dolores, CO) to verify consistency across apple types. MORP has surveyed these orchards and genetically profiled and GIS mapped the apple varieties that were picked for this study: Virginia Hewe’s Crab Apples (MORP Tree ID: hesx009), Transcendent Crab Apples (MORP Tree ID: hesq002), an unknown variety of crab apple similar in appearance to Transcendent Crab Apple (MORP Tree ID: hess002), Hibernal Crab Apples (MORP Tree ID: hesdd07), and Gravenstein Apples (MORP Tree ID: ca2c010).[Citation14] For simplicity, these apple varieties will hereafter be referred to as V, T, U, H and G, respectively. It must be noted that both the lifestage and environment of the tree as well as the harvest timing has been shown to dramatically affect the chemical composition of the apple.[Citation15] Therefore, our single trees harvested in a single season cannot be generalized. They rather represent a case study, from which we can learn and build on in future work. All apples were stored at 2 °C immediately after picking for 2–3 weeks prior to juicing so that all varieties were juiced and inoculated on the same day. Each apple variety was carefully rinsed with filtered water and juiced individually. Equipment was cleaned, rinsed, and sanitized with Powdered Brewery Wash (PBW), filtered water, and Saniclean (Five-Star Chemicals & Supply, Inc.) thoroughly between samples.
Figure 2. This map indicates the locations of the southwest Colorado orchards where all samples were obtained. Virginia Hewe’s crab apples (V), Transcendent crab apples (T), an unknown variety of local crab apple (U), and Hibernal crab apples (H) were picked at the Old Fort Orchard. Gravenstein apples (G) were picked from six trees at a privately-owned orchard in Hermosa, CO.
Dry Lalvin QA23 Saccharomyces cerevisiae yeast was mixed with filtered 35–40 °C water prior to inoculation. Each apple juice variety was inoculated with 1.00 ± 0.03 g of yeast for every 3.8 L of juice. The 18.9 L of V, U, and G were fermented in 18.9 L carboys (zero headspace), 15.1 L of T was fermented in an 18.9 L carboy, and 7.6 L of H was fermented in a 11.4 L carboy. These sample volumes were determined by the quantity of ripe apples on each tree. Each sample was sealed with an airlock between sampling occurrences to avoid oxidation during fermentation. During maturation, samples were racked into smaller vessels, where headspace was kept consistent. Due to the limited volume available, the sample with the largest apple juice volume (G) was fermented in triplicate and run in parallel with all other samples. All precision values reported herein are based on those of the triplicate G samples, which were run on the same day and in random order alongside every other surveyed sample reported herein. After inoculation, each carboy was placed in a dark, 14.4 ± 1.7 °C temperature-controlled chamber for fermentation. No nutrients or preservatives were added during inoculation or fermentation.
Ciders were sampled every 48 h for the first 22 days of fermentation, and weekly for the remainder of fermentation. During each sampling occurrence, the temperatures of the fermentation chamber and the cider samples were recorded, the pH was determined using a general-purpose pH sensor (Vernier, OR, U.S.A.), and the specific gravity was measured using an EasyDens digital gravity/density testing unit (Anton Paar, Austria) for each sample. The temperature of the fermentation chamber was decreased to 2 °C on day 25 to cold crash the gross lees prior to racking. The ciders were all racked on fermentation day 28 and brought back to 14.4 ± 1.7 °C for the remainder of fermentation and maturation.
Although primary fermentation is complete after a few weeks, several months may be required for cider maturation.[Citation16] Exactly 135 days after initial inoculation, samples were racked a second time and divided in half. Half of the volume of each sample was dry hopped with 7 g Citra (Artisan Hops ®, Batch #54150, Northern Brewer, St. Paul, MN) hops per 3.8 L of cider. The dry-hopped cider samples were bottled after 8 days in contact with hops (143 days after initial inoculation). The other half of the volume of each sample served as control (non-dry hopped) samples. During each sampling occurrence, the temperatures of the fermentation chamber and the cider samples were recorded, pH was determined, and the specific gravity of each sample was measured.
Juice analysis
The specific gravity and pH of each juice variety was measured after juicing. The malic acid and tannin content of each juice sample was established through two well-known titrations: titratable acidity and the Lowenthal permanganate titration.[Citation17] In brief, diluted apple juice samples were titrated with 0.2 M NaOH (Fisher Scientific, U.S.A., 97.0%), and phenol red indicator (Millipore Sigma, U.S.A., ACS reagent) was added to visually determine the end point. The tannin content of each juice was quantified by these published methods using indigo carmine (Millipore Sigma, U.S.A., 85%), sulfuric acid (Fisher Scientific, U.S.A., 98.0%), and 0.005 M potassium permanganate (Millipore Sigma, U.S.A., ACS Reagent,
99.0%). Total Yeast Assimilable Nitrogen (YAN) concentration was determined spectrophotometrically by using two enzymatic kits: ammonium ion (Ammonia Rapid Assay Kit) and primary amino nitrogen (K-PANOPA kit) following the manufacturer’s instructions (Megazyme International Ireland Ltd., Wicklow, Ireland).[Citation18]
Solid phase microextraction (SPME)
Cider samples were prepared for SPME in a 20 mL 22.5 × 75 mm glass headspace vial (Sigma Aldrich, U.S.A.). A 10 mL cider aliquot was combined with 2.6 g of NaCl for salting out,[Citation19] 1 μL of 0.87 g mL−1 ethyl heptanoate internal standard (Millipore Sigma, U.S.A., 99%), 30 μL of 0.802 g mL−1 4-methyl-2-propanol internal standard (Millipore Sigma, U.S.A., 98%), and 0.1 μL of 0.01 g mL−1 β-myrcene-d6 internal standard in ethyl acetate[Citation20] (Axios Research, Canada, 97.4%) for dry-hopped samples only. The vials were capped with a 20 mm aluminum release seal PTFE/silicone liner cap (Sigma Aldrich, U.S.A.) with a manual vial crimper to create an airtight seal. The vials were partially immersed in a 40 °C water bath for a period of 10 min for headspace equilibration. The cider aroma samples were collected by introducing a 50/30 μm DVB/CAR/PDMS SPME fiber (Millipore Sigma, U.S.A., 24 ga needle size) into the headspace of the vial for 30 min. VOCs released from SPME fibers were then analyzed by GC-MS within 48 h of exposure and stored at 4.4 °C in the interim.
Gas chromatography—mass spectrometry analysis
An Agilent 7820A Gas Chromatograph (GC) with a DB5 30 m × 0.25 mm × 0.25 μm column and a 5977E Mass Spectrometer Detector (MSD) with MassHunter GC-MS Acquisition Software (B.07.00.1203 Agilent, U.S.A.) was implemented for all analyses. The SPME fibers were manually inserted in random order into the GC inlet for 1 min at 260 °C during the splitless injection process. The oven temperature was held at 50 °C for 5 min, increased to 190 °C at a rate of 3 °C min−1, increased again to 230 °C at a rate of 70 °C min−1, and held at 230 °C for 5 min. The carrier gas (He) flow rate was set to 1 mL min−1.
A 70 eV electron ionization (EI) source, a single quadrupole with a mass range of m/z 50–550, and an electron multiplier were used for analyte ionization, ion separation, and detection, respectively. The mass spectrometer transfer line temperature was held at 280 °C. The National Institute of Standards and Technology (NIST) library (Version 2.2. Agilent technologies) was used to identify all volatiles within these samples based on their EI fragmentation patterns. All compounds in this case study were semi-quantified by comparing their chromatographic peak areas to the peak area of the corresponding internal standard (ester, alcohol, or terpene) in accordance with previously-published methods.[Citation12] Column and fiber blanks were taken regularly to verify instrument performance, and SPME fibers were conditioned after every exposure for 30 min at 270 °C according to manufacturer specifications.
Results and discussion
Juice analysis & fermentation
Juice samples from the five apple varieties were analyzed for specific gravity (SG), pH, tannin content, malic acid content, and YAN concentration () to characterize the initial chemical environment for primary fermentation. The reported ABV was calculated using previously published methods.[Citation21] Notably, G (an apple) had the lowest starting SG and T (a crab apple) had the highest: 1.049 and 1.076, respectively. As expected based on those SG values, G also had the lowest predicted ABV (6.8%) and T had the highest (9.6%). H began fermentation under the most acidic conditions (pH 2.8), resulting in a decreased rate of fermentation compared to juices with similar starting SG, as shown in . The tannin (astringent) and malic acid (tart) content of starting apple juice greatly influences the final mouthfeel and sharpness of the cider.[Citation22] The average tannin content of the apple juice varieties was 0.18 ± 0.07% and the average malic acid content was 1.18 ± 0.33%. Interestingly, T (0.29 ± 0.02%) and U (0.21 ± 0.04%) tannins were in a very similar range, and in consultation with MORP in July 2021, the genetic profile of U was obtained and shown to be very similar to T as well. Based on tannin and malic acid values, the English classification of these juices are bittersharp (T and U) and sharp (G, V, and H).[Citation23] Lastly, YAN was measured for its importance to both yeast growth and metabolism during fermentation and its direct impact on volatile aroma compounds generated by the yeast.[Citation24] The YAN of these apple varieties varied considerably with G (14 ± 1 mg L−1) and T (101 ± 7 mg L−1) again being the lowest and highest.
Figure 3. SG (± 0.005 for all data points) of five apple varieties (V, T, U, H, and G) throughout fermentation. SG was measured with an EasyDens digital gravity/density testing unit (Anton Paar) every 48 h for the first 22 days of fermentation, then once a week for 4 weeks, before dry hopping and bottling the finished cider.
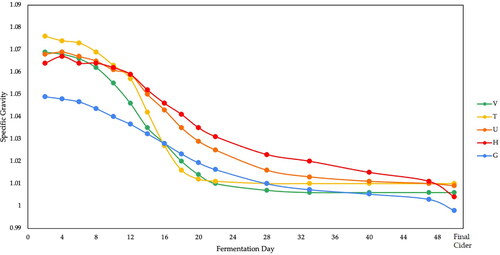
Table 1. Apple variety juice and cider analysis.
SG was measured throughout fermentation, maturation, and dry hopping to correlate the rise and fall of aroma molecules within each stage of the cider making process (). Fermentation was considered finished when the SG reached a value equal to or less than 1.010. Immediately following the initial racking event (day 28), we observed the evolution of CO2 bubbles indicating that primary fermentation continued to take place. This is supported by the observed drop in SG after that event. In the weeks following, an increase in pH and a continued evolution of CO2 suggest that malolactic fermentation may have contributed to aroma formation in these samples as well. The pH of all varieties increased during fermentation, starting from an average pH of 3.1 ± 0.2 and ending with an average pH of 3.7 ± 0.2. This pH increase is driven by the increase in alcohol concentration as a result of fermentation.[Citation25] H began and ended with the lowest pH, 2.8 ± 0.1 and 3.4 ± 0.1, respectively. Likewise, G began and ended fermentation with the highest pH, 3.4 ± 0.1 and 3.8 ± 0.1. The final cider pH for both G and T was slightly greater than the target pH range for cider of 3.3–3.7, while U, V, and H were all well within that range.[Citation26] The pH of the must is not solely responsible for specific VOC production, as discussed in the following section. For cidermakers, this means that mixing varietials to achieve a desired aroma profile must take into consideration not just this initial pH or acid content of the apples being mixed, but also the known flavor compounds produced by those apples.
Ester & higher alcohol semi-quantification
The ethyl ester, acetate ester, and higher alcohol concentrations were semi-quantified in the five varieties of apple juice and finished cider shown in alongside their retention times (RT) in min, their odor decriptors (OD) and their published perception thresholds (PT) in mg L−1. Among the five varieties, a total of 14 higher alcohols, 7 acetate esters, 11 ethyl esters, 18 other esters, 6 aldehydes, 2 ketones, and 5 volatile acids were identified in the juices and ciders prior to dry hopping (). The LOQ of each class of analytes was calculated based on the ASBC method for low-level detection.[Citation34] LOQ is defined as (
= mean signal of replicate reagent blanks, N = 10; and σ = standard deviation of the blank). As indicates, coelutions were observed for species with very short (
3 min) RTs. To avoid these coelutions and to baseline resolve these highly volatile analytes, we suggest that the GC method for future studies should begin at a lower temperature (<50 °C) and be held at that temperature for at least 5 min before ramping begins.
Table 2. Major volatile higher alcohol and ester concentrations identified in juice and cider from five apple varieties (V, T, U, H, and G) measured by HS-SPME-GC-MS.Table Footnotea,b
compares the total ester (A) and higher alcohol (B) concentrations of the juice, cider, and dry-hopped cider prepared from the five apple and crab apple varieties. The total concentrations of esters were obtained by adding the concentrations of ethyl esters and acetate esters together. Ethyl esters constitute the majority of the ester concentrations observed herein, and these compounds are synthesized from sugar alcohols in the juice through an esterification reaction during maturation.[Citation35] The relative ester concentration increased an average of 70-fold from juice to cider as a result of this biochemical process. The apple varieties with the fewest esters in their headspace (H and G) had 1–2 orders of magnitude lower total ester concentrations than those with the most esters (V, T, U), evidencing the importance of apple variety choice in defining the final cider aroma. G had the highest total concentration of esters among the juices, T had the highest ester concentration among the ciders, and V finished with the highest ester concentration among the dry-hopped ciders (). Although T juice had the lowest total ester concentration to begin with, H cider finished with the lowest total ester concentration for both cider and dry-hopped cider. The low pH of the H juice may have played a role in limiting the efficiency of esterification.[Citation36] Differences in the concentration of esters could also result from differences in the amount of oxygen available during primary fermentation, with more oxygen being introduced after the start of fermentation leading to increased ester production.[Citation37] For example, the varieties T and H had more headspace compared to varieties V, U, and G, which could possibly lead to increased ester production. While we do observe higher concentrations of esters in T, this is expected for the juice with the highest SG, highest YAN, and moderate pH. And as noted before, H had the lowest concentration of esters in the finished cider. This suggests that factors such as apple variety, lifestage of tree, tree environment, and harvest timing have a significant impact on the chemical environment of primary fermentation due to their influence on SG, YAN, and pH, while differences in headspace during primary fermentation of aerated juice have a lesser effect.
Figure 4. Total ester (A) and higher alcohol (B) concentrations in juice, cider, and dry-hopped cider samples obtained from five apple varieties (V, T, U, H, and G) are compared. The average precision is reported based on triplicate G trials.
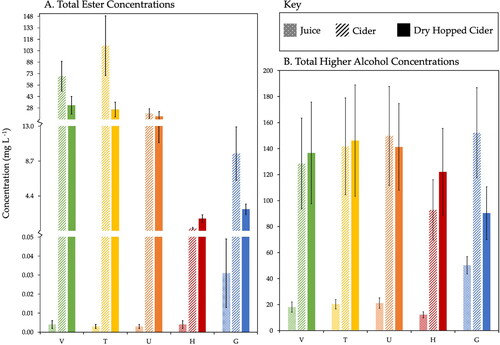
Although this preliminary case study focuses on quantitative analysis rather than sensory evaluation, it is well known from previous work that the ester concentration is incredibly important to the aroma profile of the final cider product due to their fruity, banana, pineapple, and grape notes.[Citation8,Citation27,Citation31] The total concentration of esters decreased from cider to dry-hopped cider in all varietals except for H, likely due to the second racking event prior to dry hopping. Experimental observations indicate that racking decreases volatile ester concentrations, which underscores the importance of carefully-timed filtration and quiet transfers (limiting oxygen exposure during transfer by avoiding splashing and siphoning the cider at a low flow rate). Ethyl octanoate was detected in all five cider varieties and has the odor descriptor of fruity, candy, and pineapple.[Citation27] All varieties, except for H (which began fermentation at pH 2.8), had concentrations of ethyl octanoate higher than its perception threshold of 0.58 mg L−1.[Citation13] V had the highest concentration of ethyl octanoate at 12.10 ± 4.18 mg L−1. Ethyl decanoate (fruity, grape[Citation27]) and ethyl hexanoate (fruity, green apple[Citation27]) had the second and third highest concentrations of esters detected in all varieties. All five cider varieties had concentrations of ethyl hexanoate over its perception threshold and all varieties except H had concentrations of ethyl decanoate over its perception threshold. Published work suggests that ethyl hexanoate and ethyl octanoate levels increase with the length of time that the cider is allowed to rest on the yeast cake and are often referred to as the “apple esters.”[Citation35,Citation38] includes the identities and concentrations of every ester that was detected and semi-quantified in all juice, cider, and dry-hopped cider samples in this study alongside their perception thresholds and odor descriptors, when available.
Acetate esters produced in fermentation have been found to be unique to each yeast strain,[Citation38] and 3-methyl-1-butyl acetate and 2-methyl-1-butyl acetate are commonly observed products of fermentation by S. cerevisiae.[Citation38] In addition to yeast strain, the surrounding matrices of these apple juice varieties clearly plays an important role in final ester concentration. Three acetate esters were semi-quantified in these ciders: 3-methyl-1-butyl acetate (banana[Citation31]), 2-methyl-1-butyl acetate (fruity, banana[Citation32]), and hexyl acetate (fruity, sweet[Citation29]) at varying concentrations. The compound 3-methyl-1-butyl acetate was the most abundant acetate ester in G, U, T, and V ciders (semi-quantified above the perception threshold of 0.094 mg L−1[Citation31]), but was not detected in H cider. Similarly, 2-methyl-1-butyl acetate was detected above the perception threshold (0.011 mg L−1[33]) in either the final cider or the final dry-hopped cider in all apple varieties except H. Hexyl acetate was detected and semi-quantified in all cider varietals, however these concentrations were below the published perception threshold (1.040 mg L−1).[Citation29]
Higher alcohol concentrations are also integral to the unique aroma profiles of cider, due to their fruity and floral notes.[Citation12] These species are synthesized from amino acid-derived oxo-acids during fermentation.[Citation16] The higher alcohols found in apple juice and cider come from the apple fruit and can be products of fermentation unique to the yeast strain utilized.[Citation35] The total higher alcohol concentrations of each juice, cider, and dry-hopped cider sample are shown in . Of all of the juices, ciders, and dry-hopped ciders, G juice, U cider, and T dry-hopped cider had the highest observed total higher alcohol concentrations. The relative higher alcohol concentration increased an average of 6-fold from juice to cider, with G increasing the least and H increasing the most. Unlike the ester concentrations, the concentration of higher alcohols increased after dry hopping in all varieties except for G. The only higher alcohol detected in all five juice varietals above its perception threshold of 0.11 mg L−1[27] was 1-hexanol (floral, green[Citation27]). G juice had the highest individual concentration of 1-hexanol with 40.53 ± 6.67 mg L−1. The concentration of 1-hexanol increased from juice to cider in G, U, V, and H, while the concentration decreased in T. The most abundant higher alcohol in U, T, V, and H juices was 2-hexen-1-ol (grassy, green, sweet[Citation29]), with the highest concentration observed in V juice. The compound 2-hexen-1-ol was not, however, detected in any of the ciders, so may have been consumed by the yeast during fermentation. The compound 1-pentanol (balsamic, fruity[Citation12]) had the highest concentration in cider across all varietals. Glucose has been shown to be negatively correlated with 1-pentanol, because it is continuously consumed during yeast metabolism as higher alcohols are being produced.[Citation39] This suggests that the high glucose content of apple juice contributes to this increased concentration of 1-pentanol produced during fermentation. T had the highest concentration of 1-pentanol at 121.00 ± 37.51 mg L−1 and G had the lowest at 70.17 ± 16.76 mg L−1. Notably, 1-pentanol, 3-methyl-1-butanol, and 2-methyl-1-butanol are reported together as they were not chromatographically resolved with our GC method due to their high volatility. Future work is necessary to characterize the impact of these concentration differences on consumer perception through sensory evaluation.
Terpene semi-quantification
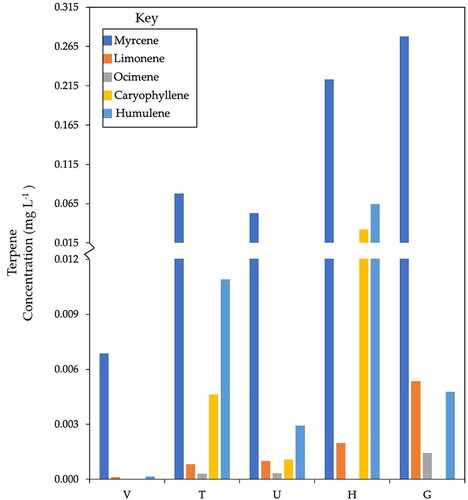
Each cider variety was dry-hopped for eight days with Citra hops. On the eighth day, the ciders were bottled, and VOCs measured. shows the concentrations of terpenes semi-quantified in each dry-hopped cider sample. Interestingly, no terpenes were detected in cider samples that were not dry hopped. A known aroma compound common in hops, β-myrcene (lime[Citation38,Citation40]), had the highest concentration in every variety. G had the highest concentration of β-myrcene of 0.28 ± 0.08 mg L−1 and V had the lowest of 0.010 ± 0.003 mg L−1. Humulene (resin[Citation40]) had the next highest concentration, with H containing the most (0.06 ± 0.02 mg L−1). Only β-myrcene, D-limonene, and humulene were detected in all five cider varietals. Interestingly, H had the highest concentration of terpenes, but the lowest concentrations of higher alcohols and esters. V had the lowest concentration of terpenes yet had the highest concentration of esters. Clearly, the chemical environment dictated by the apple varietal yields drastically different extraction efficiencies for terpenes. This highlights an interesting and important point for cider makers: using identical hops, one may generate a wide array of terpene aroma profiles simply by changing the starting apple.
Figure 5. Concentrations of terpenes (mg L−1) semi-quantified in three or more of the dry-hopped cider varieties are shown. Compounds β-myrcene, D-limonene, ocimene, caryophyllene, and humulene concentrations varied considerably across apple variety, even though all cider samples were hopped with identical Citra hops (average RSD of triplicate G samples = 30%). No terpenes were detected in non-dry hopped samples.
Conclusion
Overall, apple variety was found to greatly influence the final aroma profile of novel ciders produced from historical southwest Colorado apples and crab apples. Each apple juice variety began with varying SG, pH, tannin equivalents, malic acid equivalents, and YAN, all of which impact the fermentation and final cider aroma. There were 73 total VOCs detected by HS-SPME-GC-MS (): 14 higher alcohols, 7 acetate esters, 11 ethyl esters, 18 other esters, 6 aldehydes, 2 ketones, 5 volatile acids, and 10 terpenes. Only 24 of these VOCs were detected in all samples, evidencing the uniqueness of cider aroma generated from each apple variety. Three internal standards (ethyl heptanoate, 4-methyl-2-propanol, and β-myrcene-d6) were employed to semi-quantify esters, higher alcohols, and terpenes, respectively. The total ester concentration varied widely from one apple variety to another, with final ester headspace concentrations spanning 2 orders of magnitude with V, T, and U in the lead. Total higher alcohol concentrations were similar across the apple varieties, with three coeluting species predominating: 1-pentanol, 3-methyl-1-butanol, and 2-methyl-1-butanol. Future work will utilize a lower starting temperature (<50 °C) to baseline resolve these highly volatile species. Lastly, the identity and headspace concentrations of terpenes were drastically different from one apple variety to another even though all ciders were dry hopped identically with Citra hops. This provides a valuable insight into how apple variety drives volatile profile development during the dry hopping process, and how essential it is for cider makers to consider the compatibility of apple and hop varieties during cider production. The compound β-myrcene was the most abundant terpene observed in all dry-hopped cider, and H cider had the highest concentration of terpenes overall. The ciders with the highest ester concentrations in the headspace (V, T, and U), had the lowest terpene concentrations after dry hopping, and those with the highest terpene concentrations in the headspace (G and H) had the lowest ester concentrations. This work has provided novel analyses of southwest Colorado apple varieties and the aroma profiles of their cider and dry-hopped cider. Results reported herein are of a small case study, and therefore cannot be generalized. Rather, they represent a starting point in this research, and they have been added to the MORP collaborative database to inform local cider makers about the cider outcomes of different apple varieties. This method has many applications for apple and cider producers who seek to test various treatments on overall cider quality and should be combined with sensory evaluation in the future to better understand consumer preference.
Author contributions
Dr. C. Cole, undergraduate students J. Hinkley and M. Bingman, and collaborators Dr. C. Bradley II and Dr. J. Lee implemented the study and interpreted the results together. Undergraduate students J. Hinkley and M. Bingman collected and analyzed all reported experimental data under the mentorship of Dr. C. Cole, Dr. J. Lee, and Dr. C. Bradley II. J. Hinkley prepared the manuscript draft, and manuscript editing was performed by Dr. C. Cole and Dr. C. Bradley II. Dr. C. Cole acquired all funding that supported this work and led project administration and supervision.
Supplemental Material
Download MS Excel (31.2 KB)Acknowledgments
We thank Jared Scott, Elizabeth Philbrick, and Avery Scott of EsoTerra Cider, for their collaborative insights, cider samples, and assistance picking and pressing the apples used in this study. We also thank them greatly for the use of their facilities for sample preparation. Special thanks go to the orchard owners in Hermosa, CO for their Gravenstein apples, and to Beth Lashell and the Old Fort Orchard in Hesperus, CO for their many varieties of crab apples. We are grateful for Benjamin Cole’s design of the graphical abstract included with this manuscript. We acknowledge and thank Marty Emmes, Sam Bingman, Zach Myers, Kelly Bleck, Dr. Gigi Richard, Dr. Michael Grubb, and Dr. Jeff McFarlane for their discussions, edits, advice, and assistance throughout the project. Lastly, our laboratory would not function without the support of several good dogs, cats, and rabbits: thank you especially to O’Malley, Liessel, Ivy, Stuart, and Tilli for your support and cuteness.
Conflicts of interest
The authors declare no conflict of interest.
Additional information
Funding
Related Research Data
Literature cited
- Sigh, S. Cider Market by Product. https://www.alliedmarketresearch.com/cider-market (accessed Mar 7, 2021).
- Kessinger, J.; Earnhart, G.; Hamilton, L.; Phetxumphou, K.; Neill, C.; Stewart, A. C.; Lahne, J. Exploring Perceptions and Categorization of Virginia Hard Ciders through the Application of Sorting Tasks. J. Am. Soc. Brew. Chem. 2021, 79, 187–200. DOI: 10.1080/03610470.2020.1843927.
- Cider Market Size, Share & Trends Analysis Report By Product (Sparkling, Still, Apple Wine), By Source (Apple, Fruit Flavored, Perry, Other Vegan Sources), By Region, And Segment Forecasts, 2019–2025. https://www.grandviewresearch.com/industry-analysis/cider-market (accessed Nov 16, 2021).
- Watson, B. Cider, Hard and Sweet: History, Traditions, and Making Your Own; The Country Man Press: New York: 2013; Vol. 3.
- Leforestier, D.; Ravon, E.; Muranty, H.; Cornille, A.; Lemaire, C.; Giraud, T.; Durel, C. E.; Branca, A. Genomic Basis of the Differences between Cider and Dessert Apple Varieties. Evol. Appl. 2015, 8, 650–661. DOI: 10.1111/eva.12270.
- Schuenemeyer, A.; Schuenemeyer, J. Montezuma Orchard Resoration Project. https://montezumaorchard.org/ (accessed May 24, 2021).
- Pello-Palma, J.; Mangas-Alonso, J. J.; de la Fuente, E. D.; Gonzalez-Alvarez, J.; Diez, J.; Alvarez, M. D. G.; Abrodo, P. A. Characterization of Volatile Compounds in New Cider Apple Genotypes Using Multivariate Analysis. Food Anal. Methods 2016, 9, 3492–3500. DOI: 10.1007/s12161-016-0521-7.
- Medina, S.; Perestrelo, R.; Pereira, R.; Camara, J. S. Evaluation of Volatilomic Fingerprint from Apple Fruits to Ciders: A Useful Tool to Find Putative Biomarkers for Each Apple Variety. Foods 2020, 9, 1830. DOI: 10.3390/foods9121830.
- Rosend, J.; Kaleda, A.; Kuldjarv, R.; Arju, G.; Nisamedtinov, I. The Effect of Apple Juice Concentration on Cider Fermentation and Properties of the Final Product. Foods 2020, 9, 1401. DOI: 10.3390/foods9101401.
- Shockey, C.; Shockey, K. K. The Big Book of Cidermaking; Storey Publishing: North Adams, MA; 2020.
- Alexander, T. R.; Valliere, B. L. E. The Professional Handbook of Cider Tasting; CAB International: Boston, MA; 2019.
- He, W.; Liu, S.; Heponiemi, P.; Heinonen, M.; Marsol-Vall, A.; Ma, X.; Yang, B.; Laaksonen, O. Effect of Saccharomyces cerevisiae and Schizosaccharomyces pombe Strains on Chemical Composition and Sensory Quality of Ciders Made from Finnish Apple Cultivars. Food Chem. 2021, 345, 128833. DOI: 10.1016/j.foodchem.2020.128833.
- Bingman, M. T.; Stellick, C. E.; Pelkey, J. P.; Scott, J. M.; Cole, C. A. Monitoring Cider Aroma Development throughout the Fermentation Process by Headspace Solid Phase Microextraction (HS-SPME) Gas Chromatography–Mass Spectrometry (GC-MS) Analysis. Beverages 2020, 6, 40. DOI: 10.3390/beverages6020040.
- Schuenemeyer, A.; Schuenemeyer, J. Montezuma Orchard Restoration Project Map. https://morp-acp.maps.arcgis.com/apps/webappviewer/index.html?id=91f531fb0d9843fab5d7455c15addefd&extent=-12208863.2258%2C4278369.2786%2C-11132629.8676%2C5105112.1766%2C102100 (accessed May 24, 2021).
- Miles, C. A.; Alexander, T. R.; Peck, G.; Galinato, S. P.; Gottschalk, C.; van Nocker, S. Growing Apples for Hard Cider Production in the United States-Trends and Research Opportunities. HortTechnology 2020, 30, 148–155. DOI: 10.21273/HORTTECH04488-19.
- Cousin, F.; Schlusselhuber, M.; Dalmasso, M.; Laplace, J.-M.; Cretenet, M. Microorganisms in Fermented Apple Beverages: Current Knowledge and Future Directions. Microorganisms 2017, 5, 39. DOI: 10.3390/microorganisms5030039.
- Zoecklein, B. W.; Fugelsang, K. C.; Gump, B. H.; Nury, F. S. Wine Analysis and Production; Springer Science and Business Media: New York; 1995.
- Dukes, B. C.; Butzke, C. E. Rapid Determination of Primary Amino Acids in Grape Juice Using an o-Phthaldialdehyde/N-Acetyl-L-Cysteine Spectrophotometric Assay. Am. J. Enol. Vitic. 1998, 49, 125–134.
- Jonker, M. T. O.; Muijs, B. Using Solid Phase Micro Extraction to Determine Salting-out (Setschenow) Constants for Hydrophobic Organic chemicals. Chemosphere 2010, 80, 223–227. DOI: 10.1016/j.chemosphere.2010.04.041.
- Dennenlohr, J.; Thorner, S.; Manowski, A.; Rettberg, N. Analysis of Selected Hop Aroma Compounds in Commercial Lager and Craft Beers Using HS-SPME-GC-MS/MS. J. Am. Soc. Brew. Chem. 2020, 78, 16–31. DOI: 10.1080/03610470.2019.1668223.
- Williams, L. E. Making Hard Cider a Guide for Small-Scale Producers; Bellevue College: Bellvue, WA; 2018.
- Lobo, A. P.; Anton-Diaz, M. J.; Bedrinana, R. P.; Garcia, O. F.; Hortal-Garcia, R.; Valles, B. S. Chemical, Olfactometric and Sensory Description of Single-Variety Cider Apple Juices Obtained by Cryo-Extraction. LWT-Food Sci. Technol. 2018, 90, 193–200. DOI: 10.1016/j.lwt.2017.12.033.
- Lea, A. G. H. Fermented Beverage Production; Lea, A. G. H., Piggott, J. R., Eds.; Springer Science and Business Media: New York; 1995.
- Boudreau, T. F.; Peck, G. M.; O’Keefe, S. F.; Stewart, A. C. Free Amino Nitrogen Concentration Correlates to Total Yeast Assimilable Nitrogen Concentration in Apple Juice. Food Sci. Nutr. 2018, 6, 119–123. DOI: 10.1002/fsn3.536.
- Akin, H.; Brandam, C.; Meyer, X.-M.; Strehaiano, P. A Model for pH Determination during Alcoholic Fermentation of a Grape Must by Saccharomyces cerevisiae. Chem. Eng. Process 2008, 47, 1986–1993. DOI: 10.1016/j.cep.2007.11.014.
- Miles, C. A.; King, J.; Alexander, T. R.; Scheenstra, E. Evaluation of Flower, Fruit, and Juice Characteristics of a Multinational Collection of Cider Apple Cultivars Grown in the U.S. Pacific Northwest. HortTechnology 2017, 27, 431–439. DOI: 10.21273/HORTTECH03659-17.
- Arcari, S. G.; Caliari, V.; Sganzerla, M.; Godoy, H. T. Volatile Composition of Merlot Red Wine and Its Contribution to the Aroma: Optimization and Validation of Analytical Method. Talanta 2017, 174, 752–766. DOI: 10.1016/j.talanta.2017.06.074.
- Yu, H.; Xie, T.; Xie, J.; Chen, C.; Ai, L.; Tian, H. Aroma Perceptual Interactions of Benzaldehyde, Furfural, and Vanillin and Their Effects on the Descriptor Intensities of Huangjiu. Food Res. Int. 2020, 129, 108808. DOI: 10.1016/j.foodres.2019.108808.
- Aparicio, R.; Morales, M. T. Characterization of Olive Ripeness by Green Aroma Compounds of Virgin Olive Oil. J. Agric. Food Chem. 1998, 46, 1116–1122. DOI: 10.1021/jf970540o.
- Condurso, C.; Cincotta, F.; Tripodi, G.; Sparacio, A.; Giglio, D. M. L.; Sparla, S.; Verzera, A. Effects of Cluster Thinning on Wine Quality of Syrah Cultivar (Vitis vinifera L.). Eur. Food Res. Technol. 2016, 242, 1719–1726. DOI: 10.1007/s00217-016-2671-7.
- Niu, Y. W.; Yao, Z. M.; Xiao, Z. B.; Zhu, G. Y.; Zhu, J. C.; Chen, J. Y. Sensory Evaluation of the Synergism among Ester Odorants in Light Aroma Type Liquor by Odor Threshold, Aroma Intensity and Flash GC Electronic Nose. Food Res. Int. 2018, 113, 102–114. DOI: 10.1016/j.foodres.2018.01.018.
- Jirapong, C.; Wongs-Aree, C.; Noichinda, S.; Uthairatanakij, A.; Kanlayanarat, S. Assessment of Volatile and Non-Volatile Organic Compounds in the Liquid Endosperm of Young ‘Nam Hom’ Coconut (Cocos nucifera L.) at Two Stages of Maturity. J. Horticult. Sci. Biotechnol. 2015, 90, 477–482. DOI: 10.1080/14620316.2015.11668703.
- Roth, E.; Berna, A.; Beullens, K.; Yarramraju, S.; Lammertyn, J.; Schenk, A.; Nicolai, B. Postharvest Quality of Integrated and Organically Produced Apple Fruit. Postharvest Biol. Technol. 2007, 45, 11–19. DOI: 10.1016/j.postharvbio.2007.01.006.
- ASBC. ASBC Methods of Analysis, 14th ed.; ASBC: St. Paul, MN, 2011.
- Anton, M. J.; Suarez Valles, B.; Garcia Hevia, A.; Picinelli Lobo, A. Aromatic Profile of Ciders by Chemical Quantitative, Gas Chromatography-Olfactometry, and Sensory Analysis. J. Food Sci. 2014, 79, S92–S99. DOI: 10.1111/1750-3841.12323.
- Ramsay, C. M.; Berry, D. R. Effect of Temperature and pH on the Formation of Higher Alcohols, Fatty Acids and Esters in the Malt Whisky Fermentation. Food Microbiol. 1984, 1, 117–121. DOI: 10.1016/0740-0020(84)90021-2.
- Tarko, T.; Duda-Chodak, A.; Sroka, P.; Januszek, M. Effect of Musts Oxygenation at Various Stages of Cider Production on Oenological Parameters, Antioxidant Activity, and Profile of Volatile Cider Compounds. Biomolecules 2020, 10, 890. DOI: 10.3390/biom10060890.
- Holt, S.; Miks, M. H.; de Carvalho, B. T.; Foulquie-Moreno, M. R.; Thevelein, J. M. The Molecular Biology of Fruity and Floral Aromas in Beer and Other Alcoholic Beverages. FEMS Microbiol. Rev. 2019, 43, 193–222. DOI: 10.1093/femsre/fuy041.
- Yang, Y. D.; Li, M.; Zhang, Z.; Peng, B. Z. Correlation Analysis of Key Enzyme Activities and Aroma Compounds during Fermentation of Simulated Juice System with Saccharomyces cerevisiae. LWT-Food Sci. Technol. 2019, 108, 214–220. DOI: 10.1016/j.lwt.2019.03.072.
- Cibaka, M. L.; Gros, J.; Nizet, S.; Collin, S. Quantitation of Selected Terpenoids and Mercaptans in the Dual-Purpose Hop Varieties Amarillo, Citra, Hallertau Blanc, Mosaic, and Sorachi Ace. J. Agric. Food Chem. 2015, 63, 3022–3030. DOI: 10.1021/jf5058556.